Grafana dashboards for AWS CloudWatch 
Doc: Cloudwatch datasource configuration
Feel free to create pull request for additional AWS resources/printscreens/...
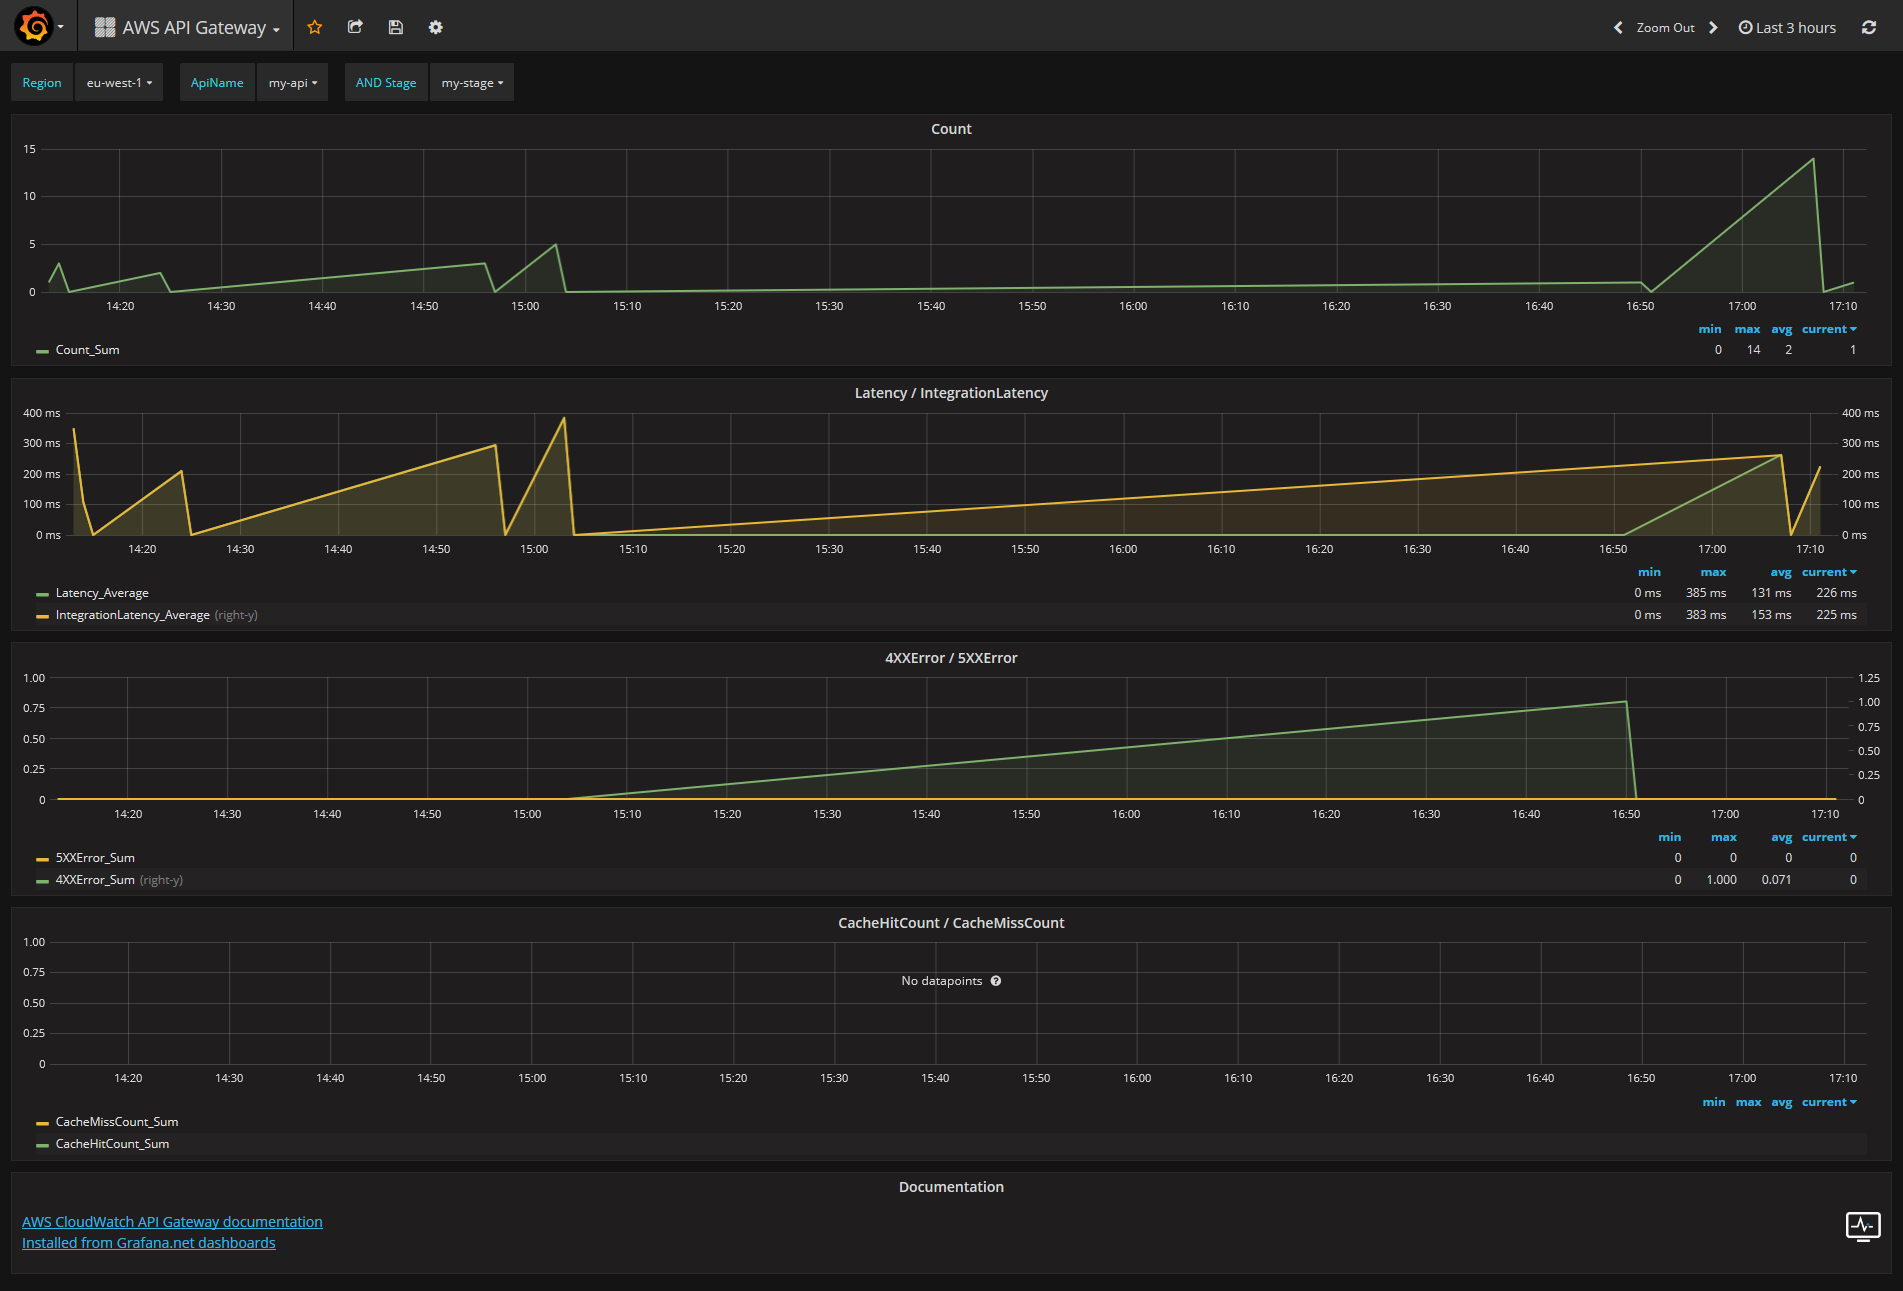
AWS API Gateway
AWS Auto Scaling
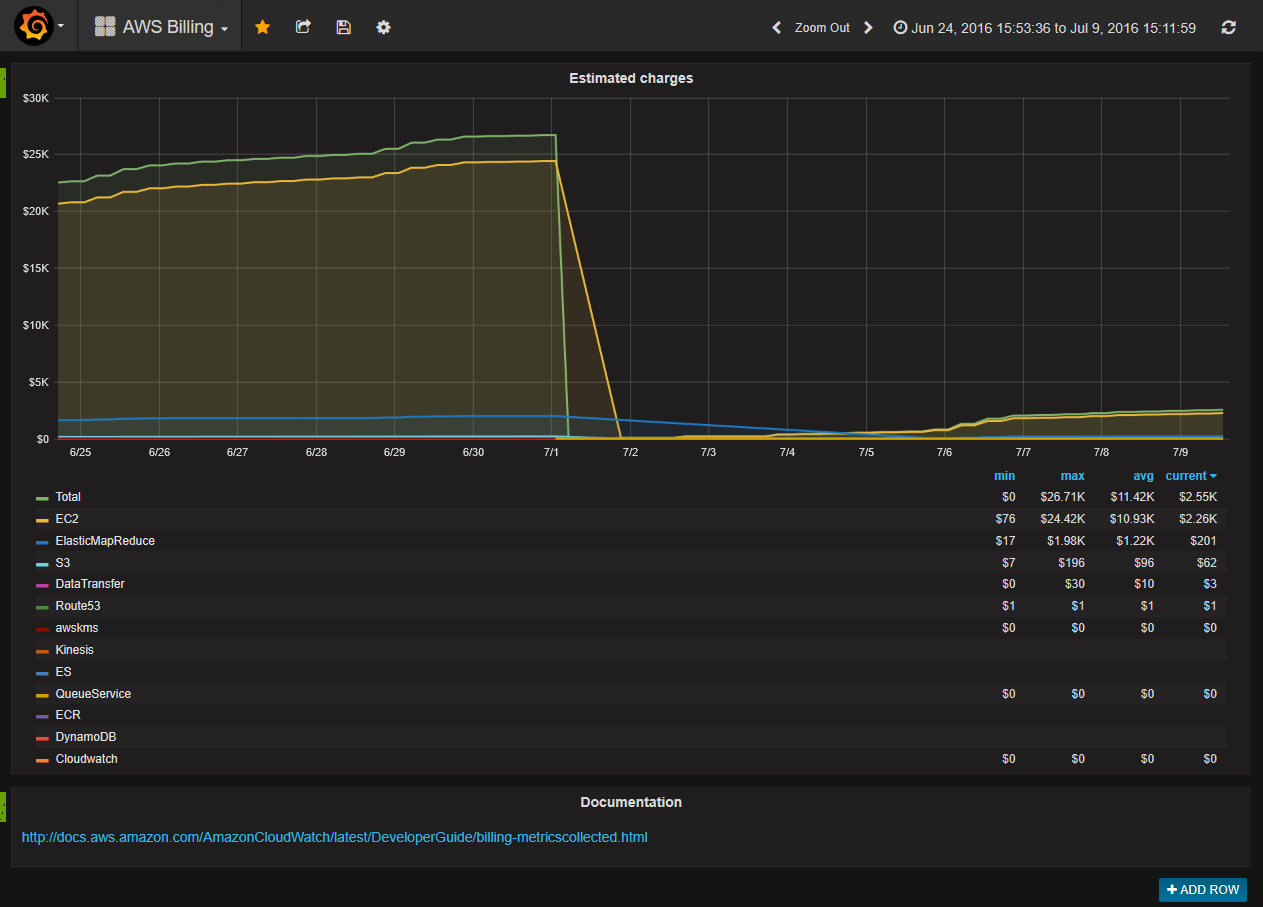
AWS Billing
AWS CloudFront
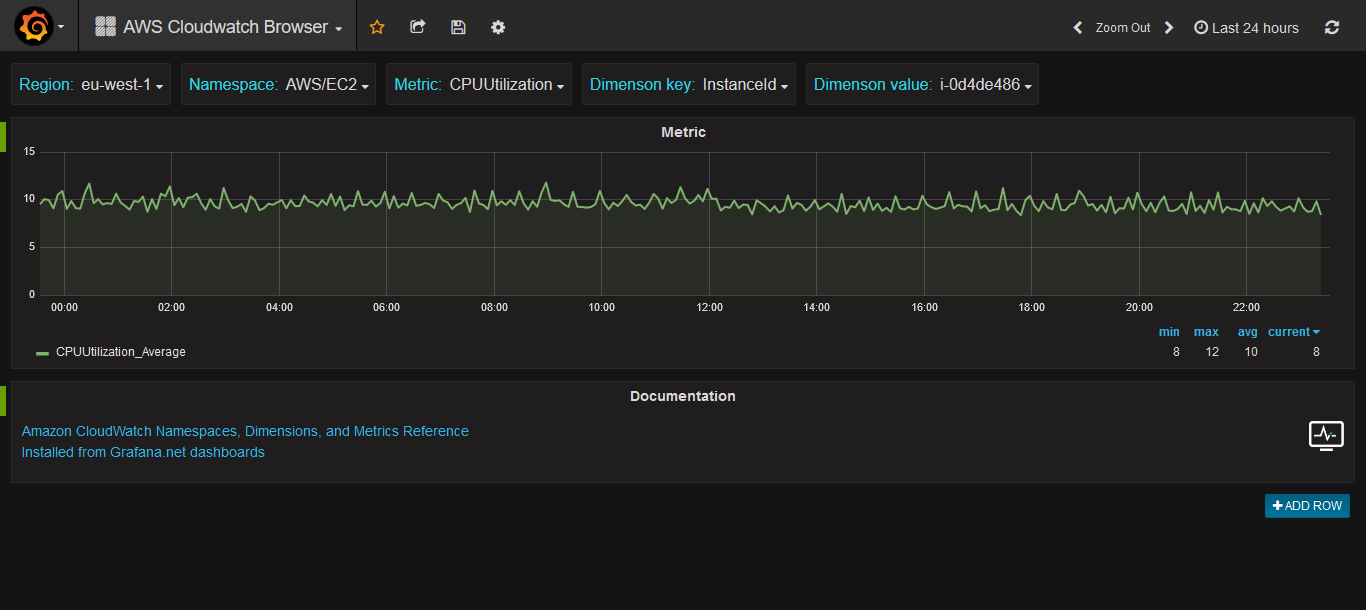
AWS Cloudwatch Browser
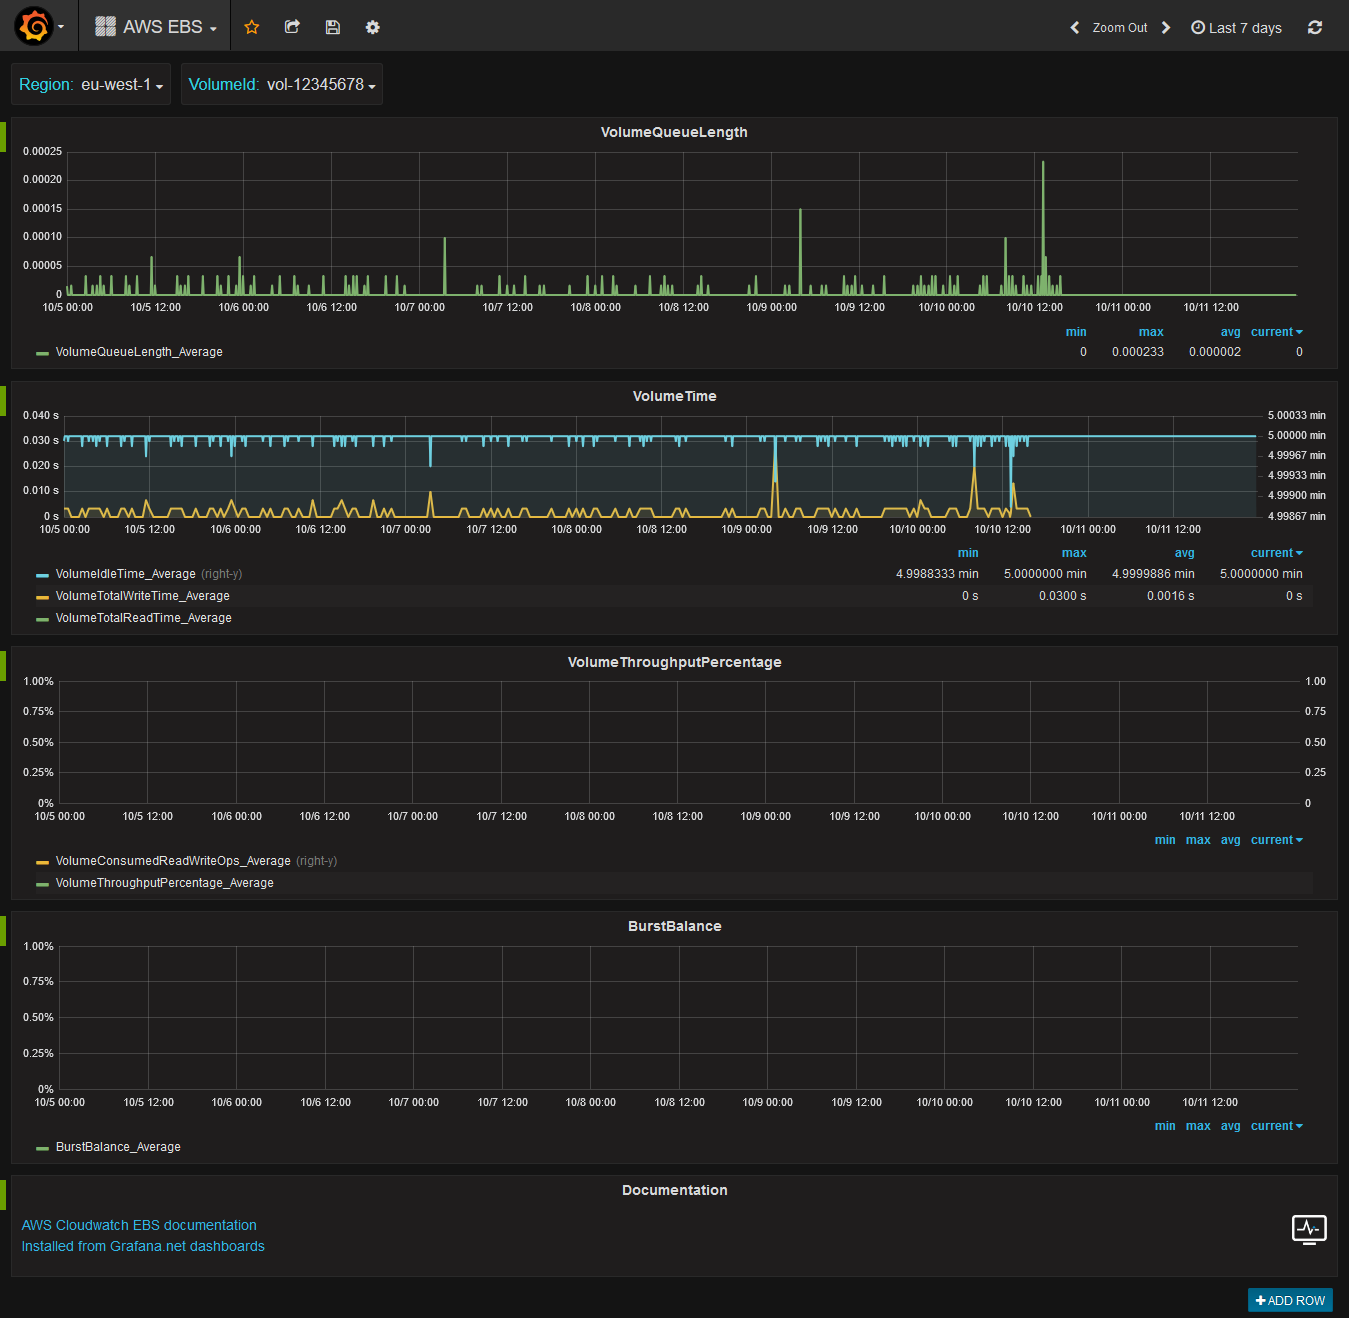
AWS EBS
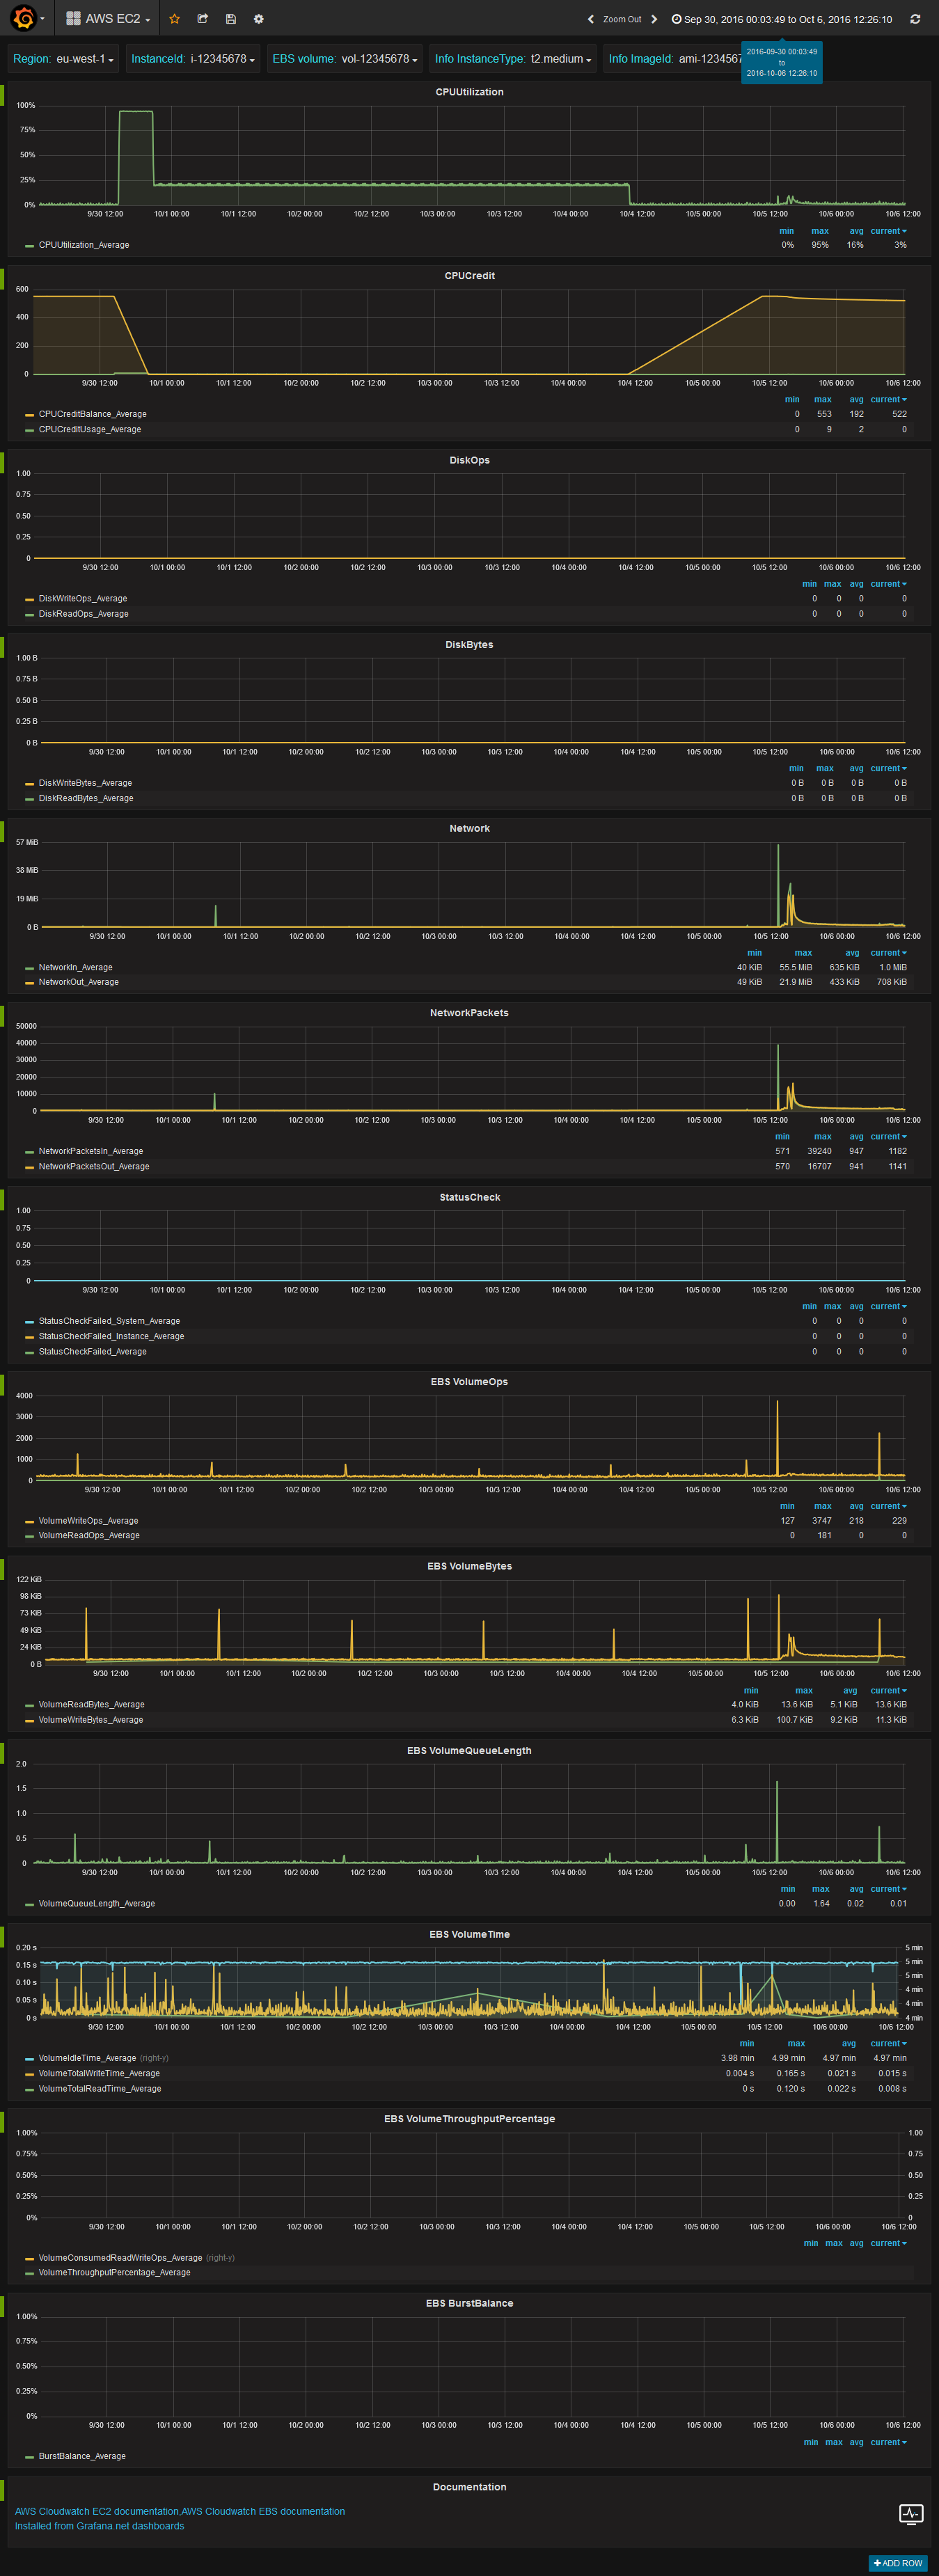
AWS EC2
AWS ECS
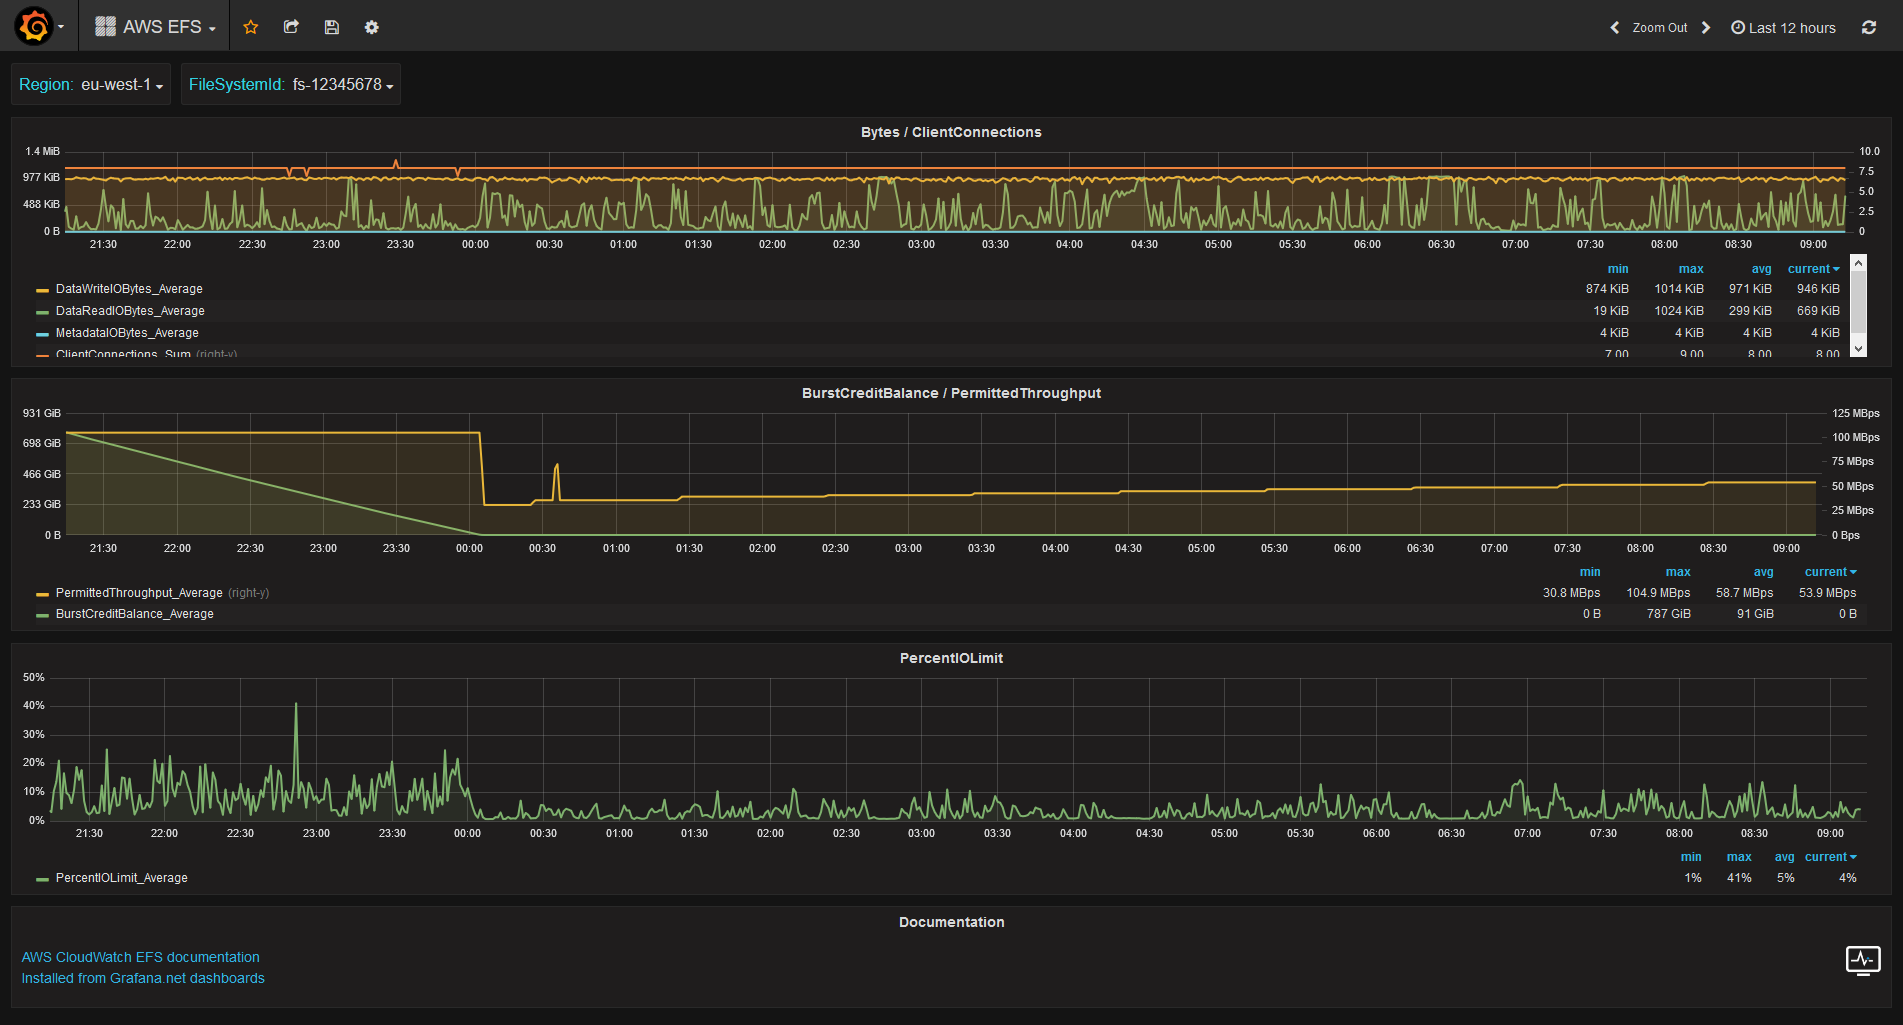
AWS EFS
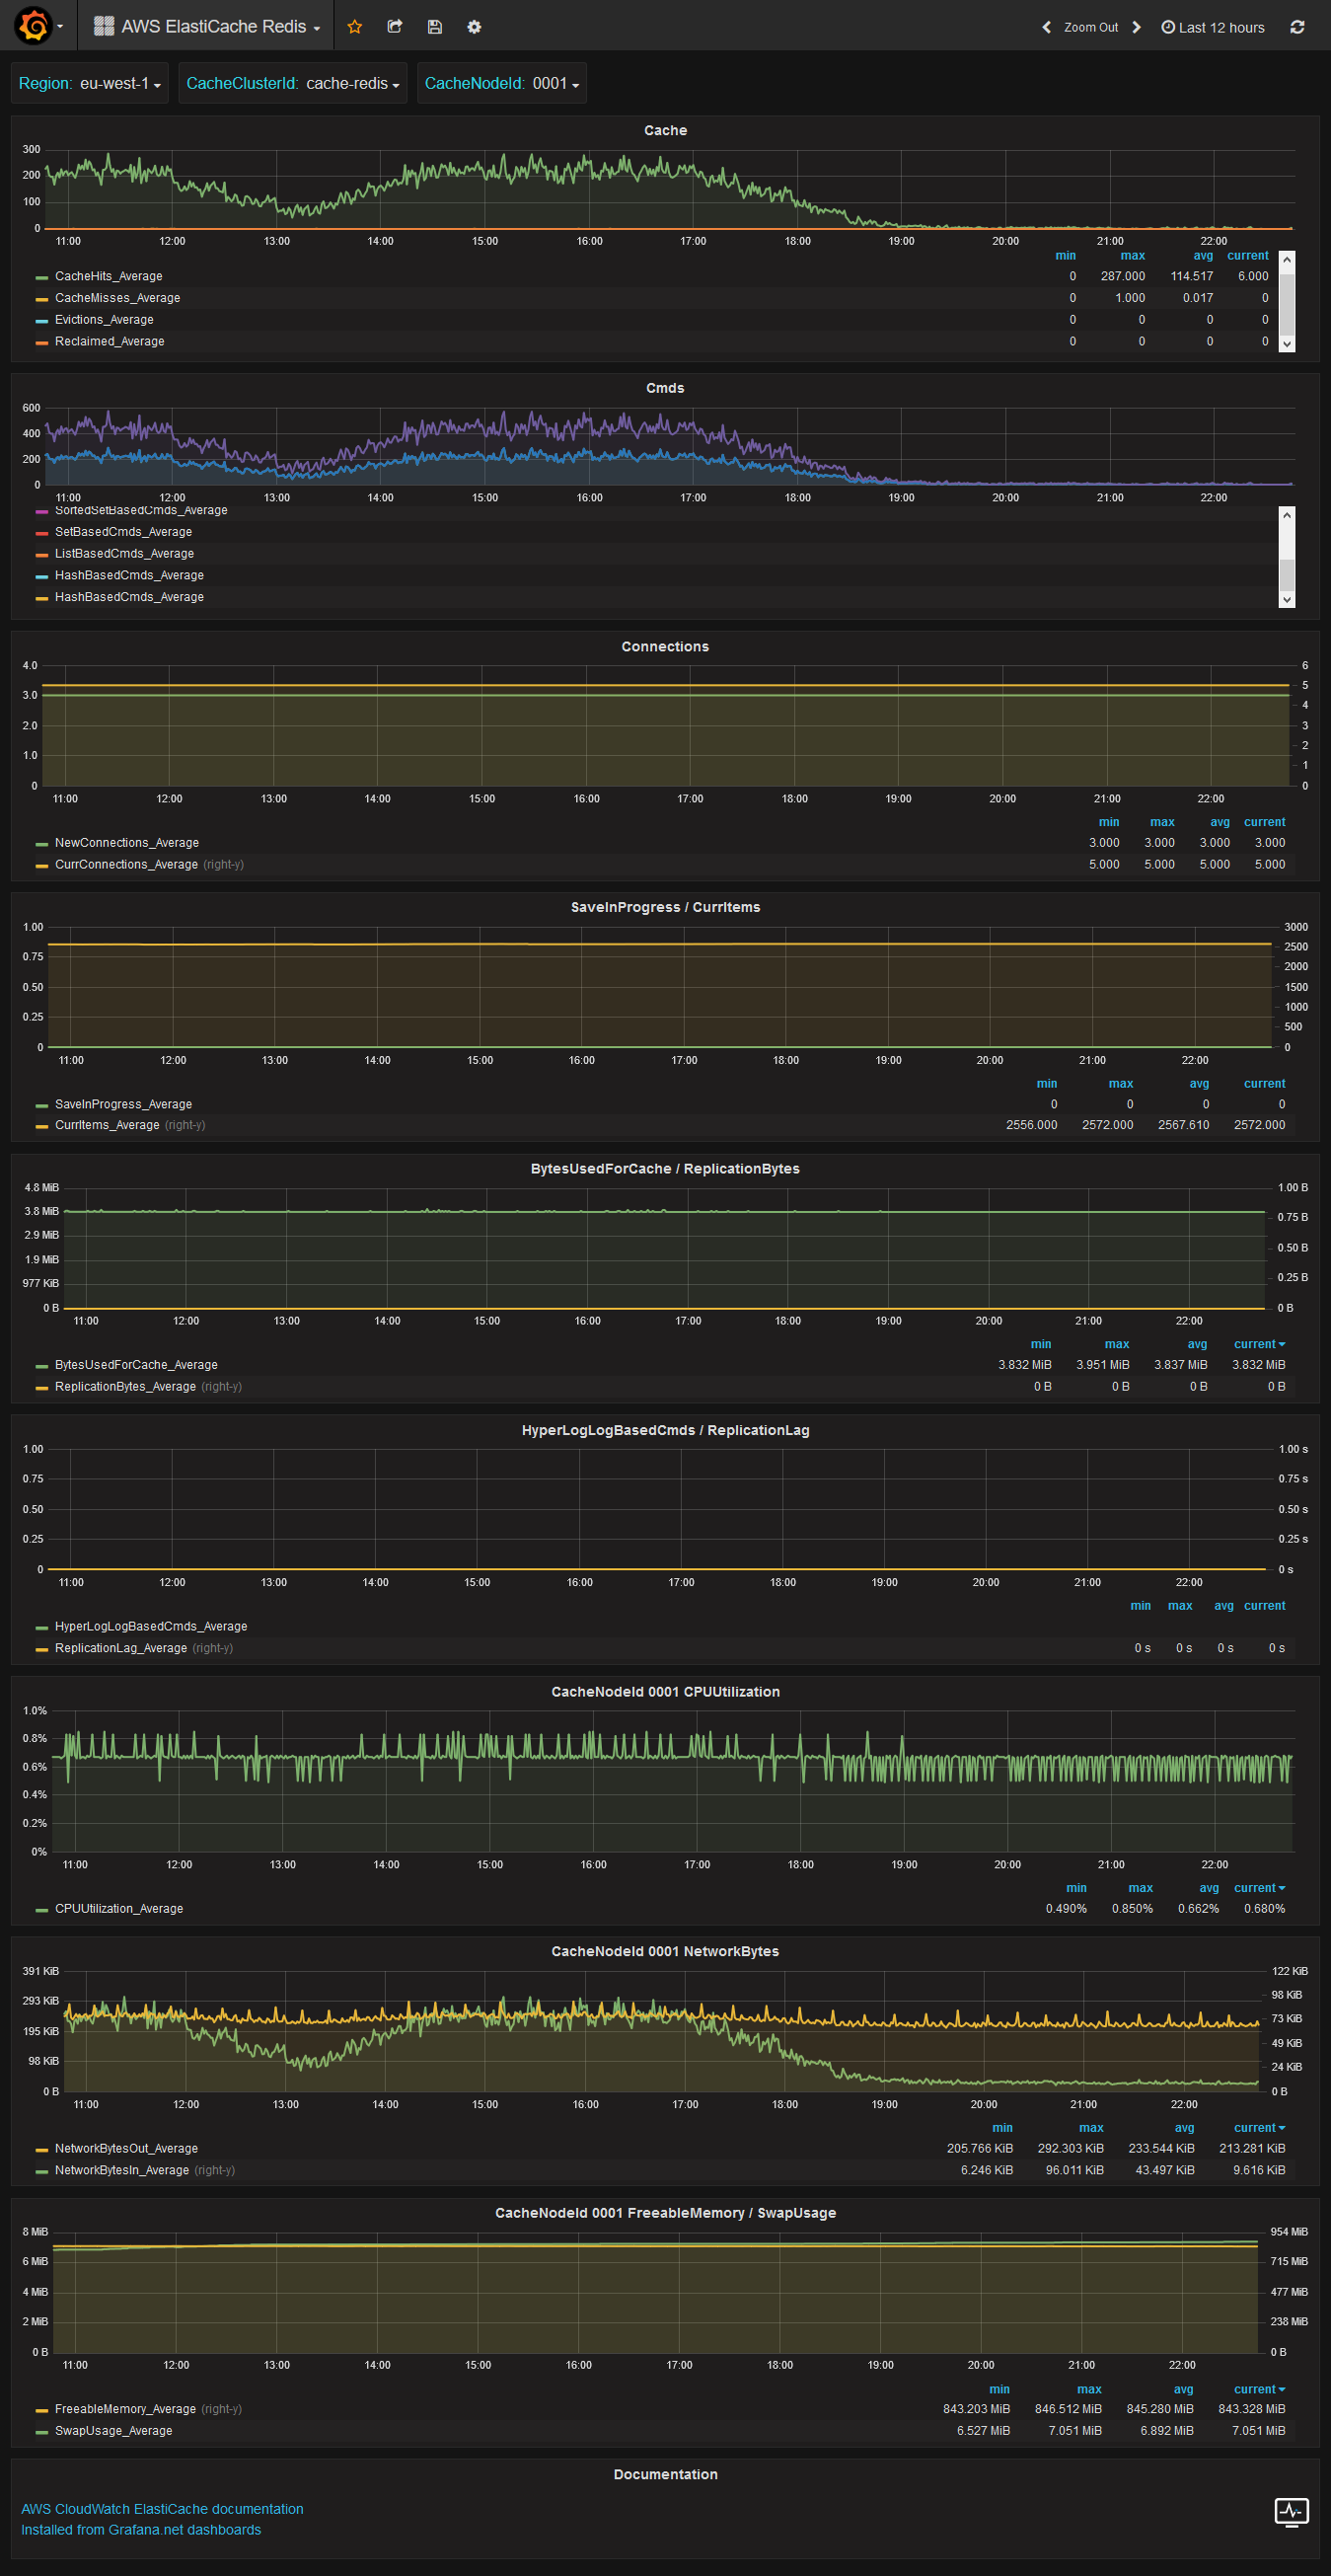
AWS ElastiCache Redis
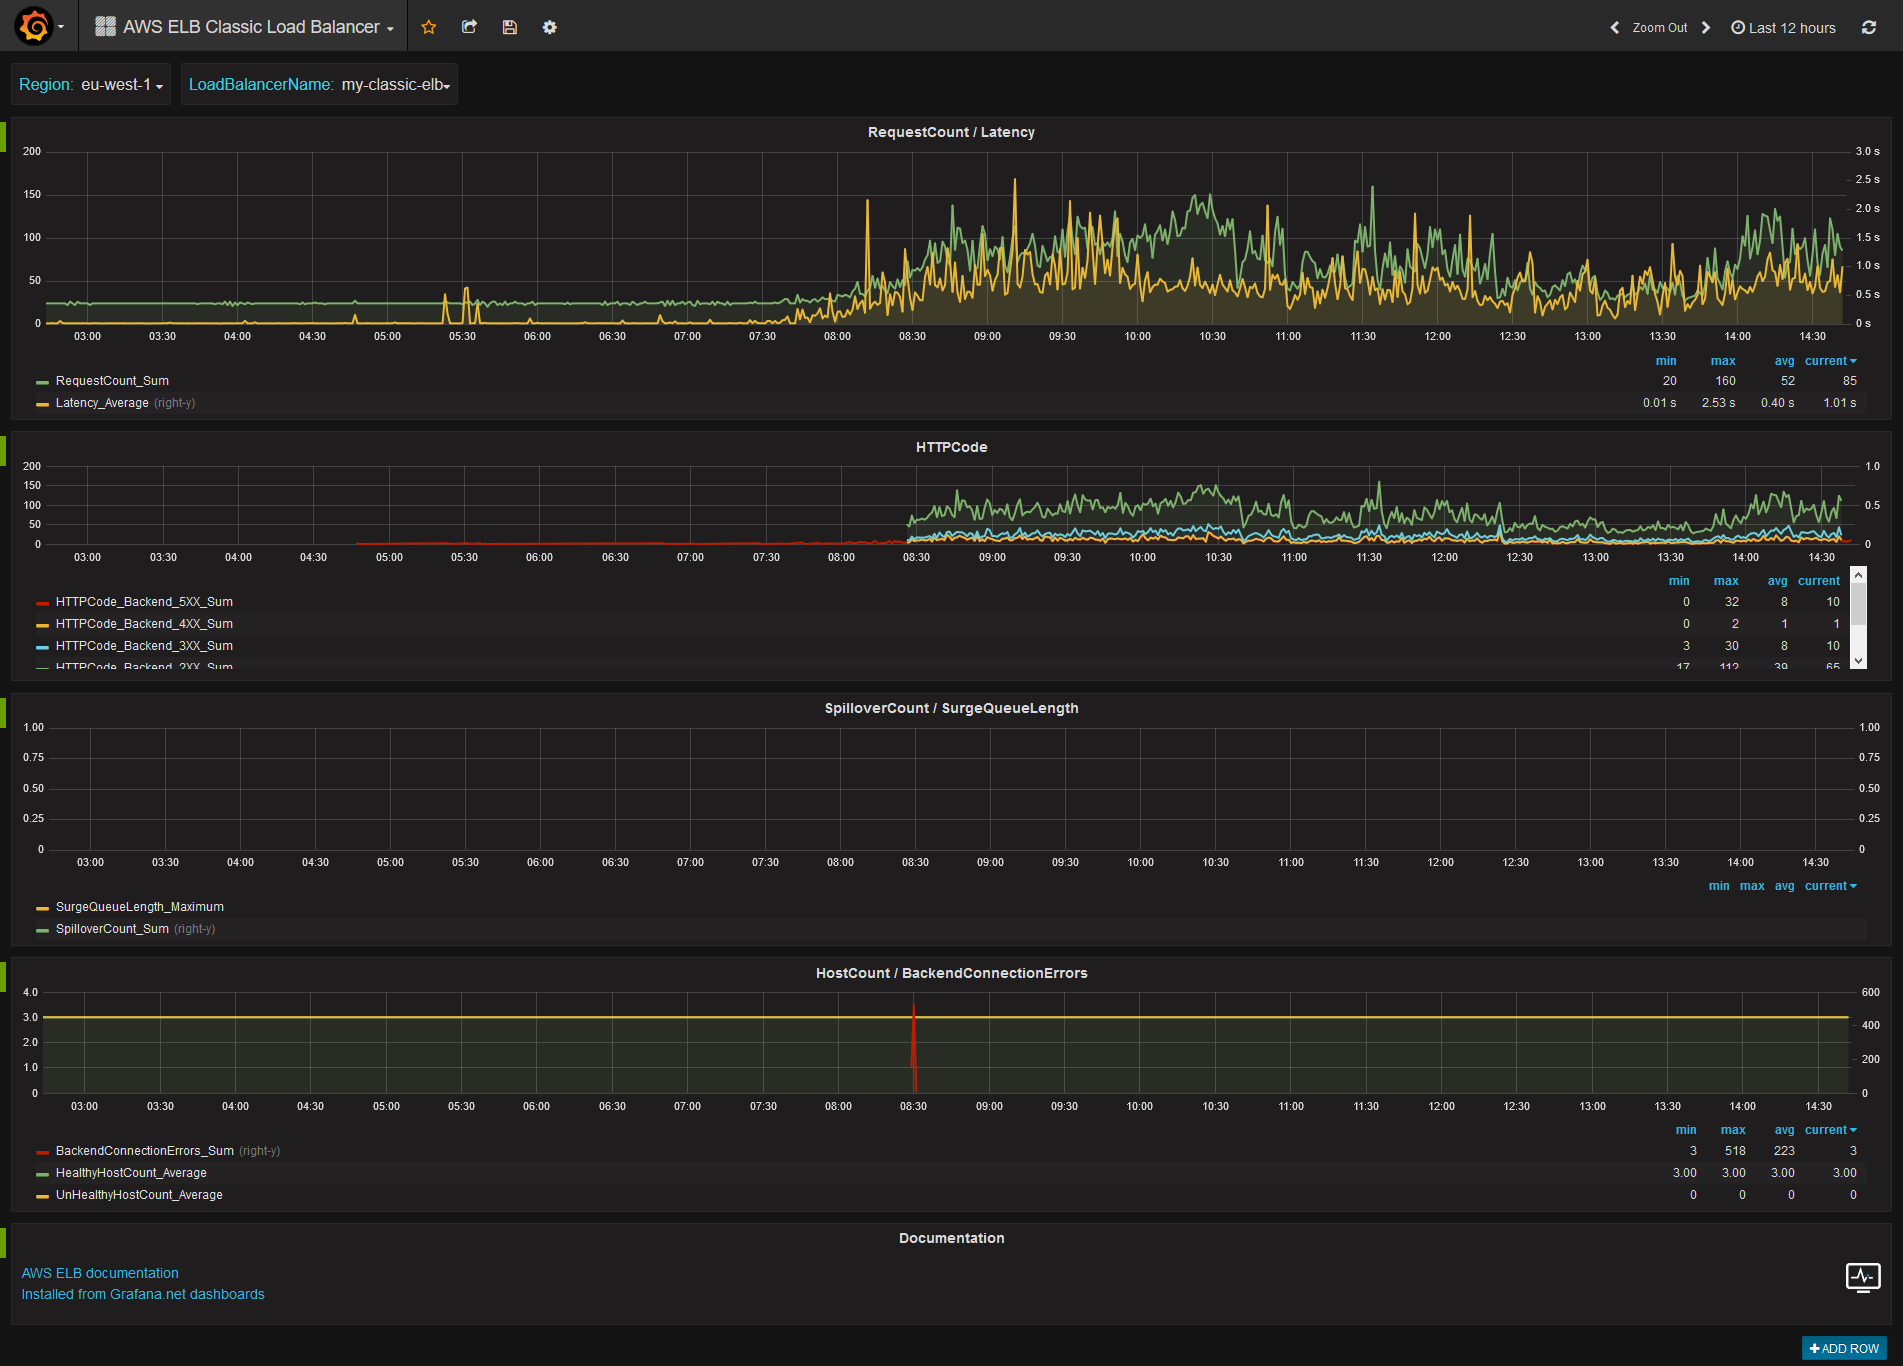
AWS ELB Classic Load Balancer
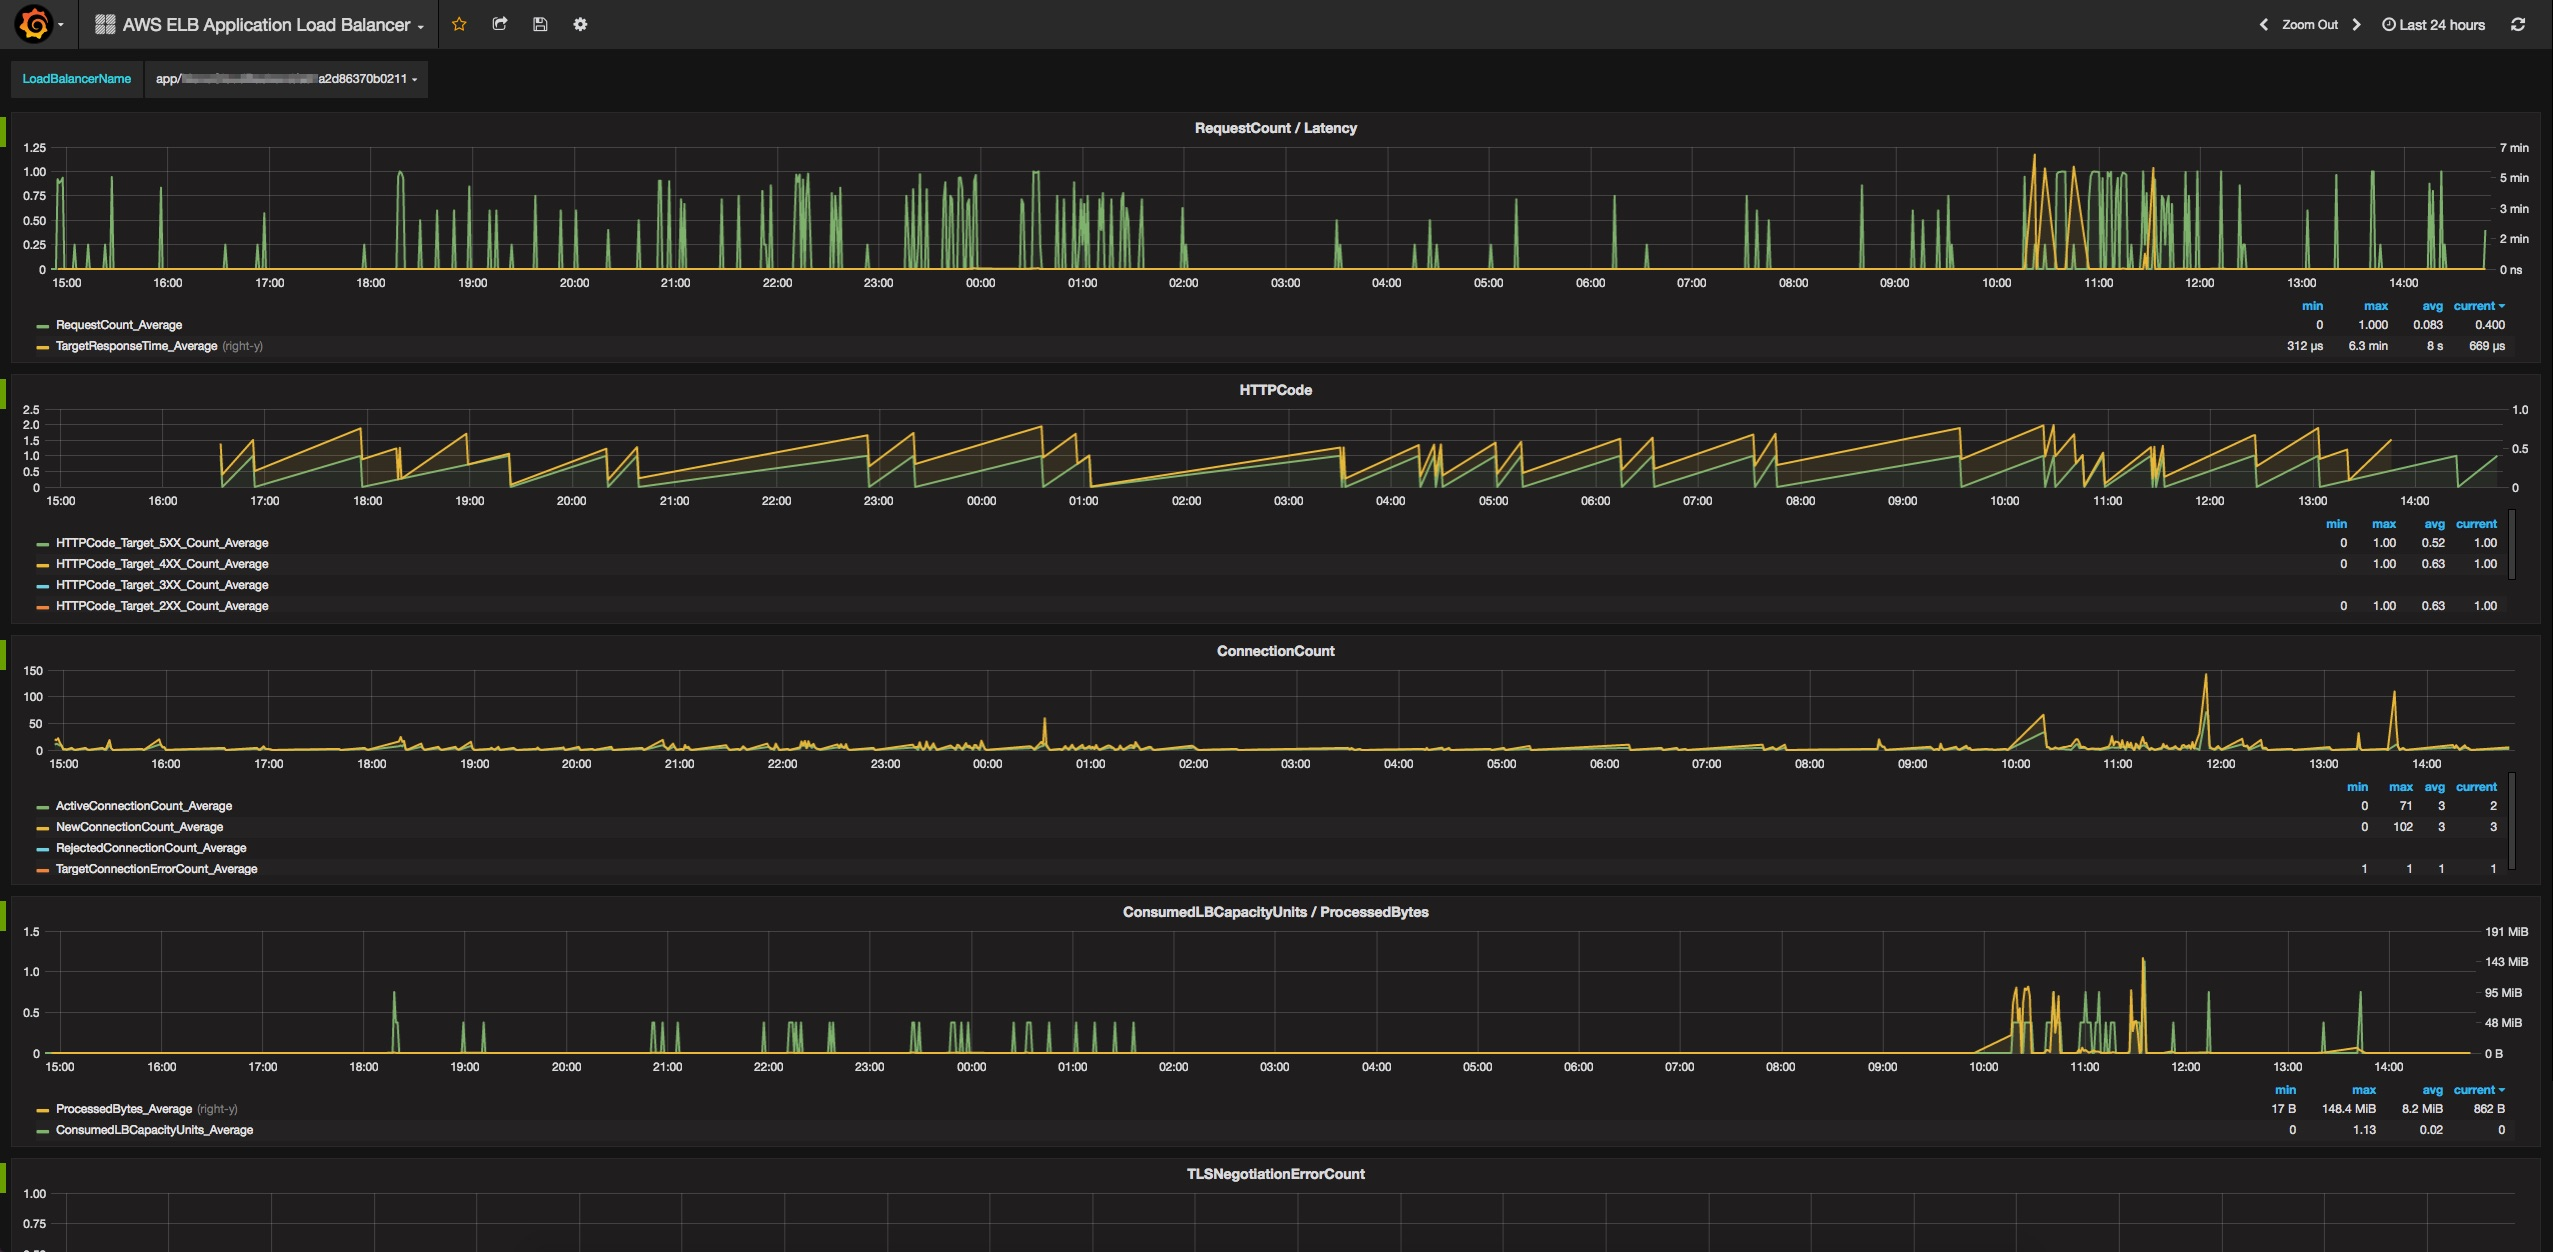
AWS ELB Application Load Balancer
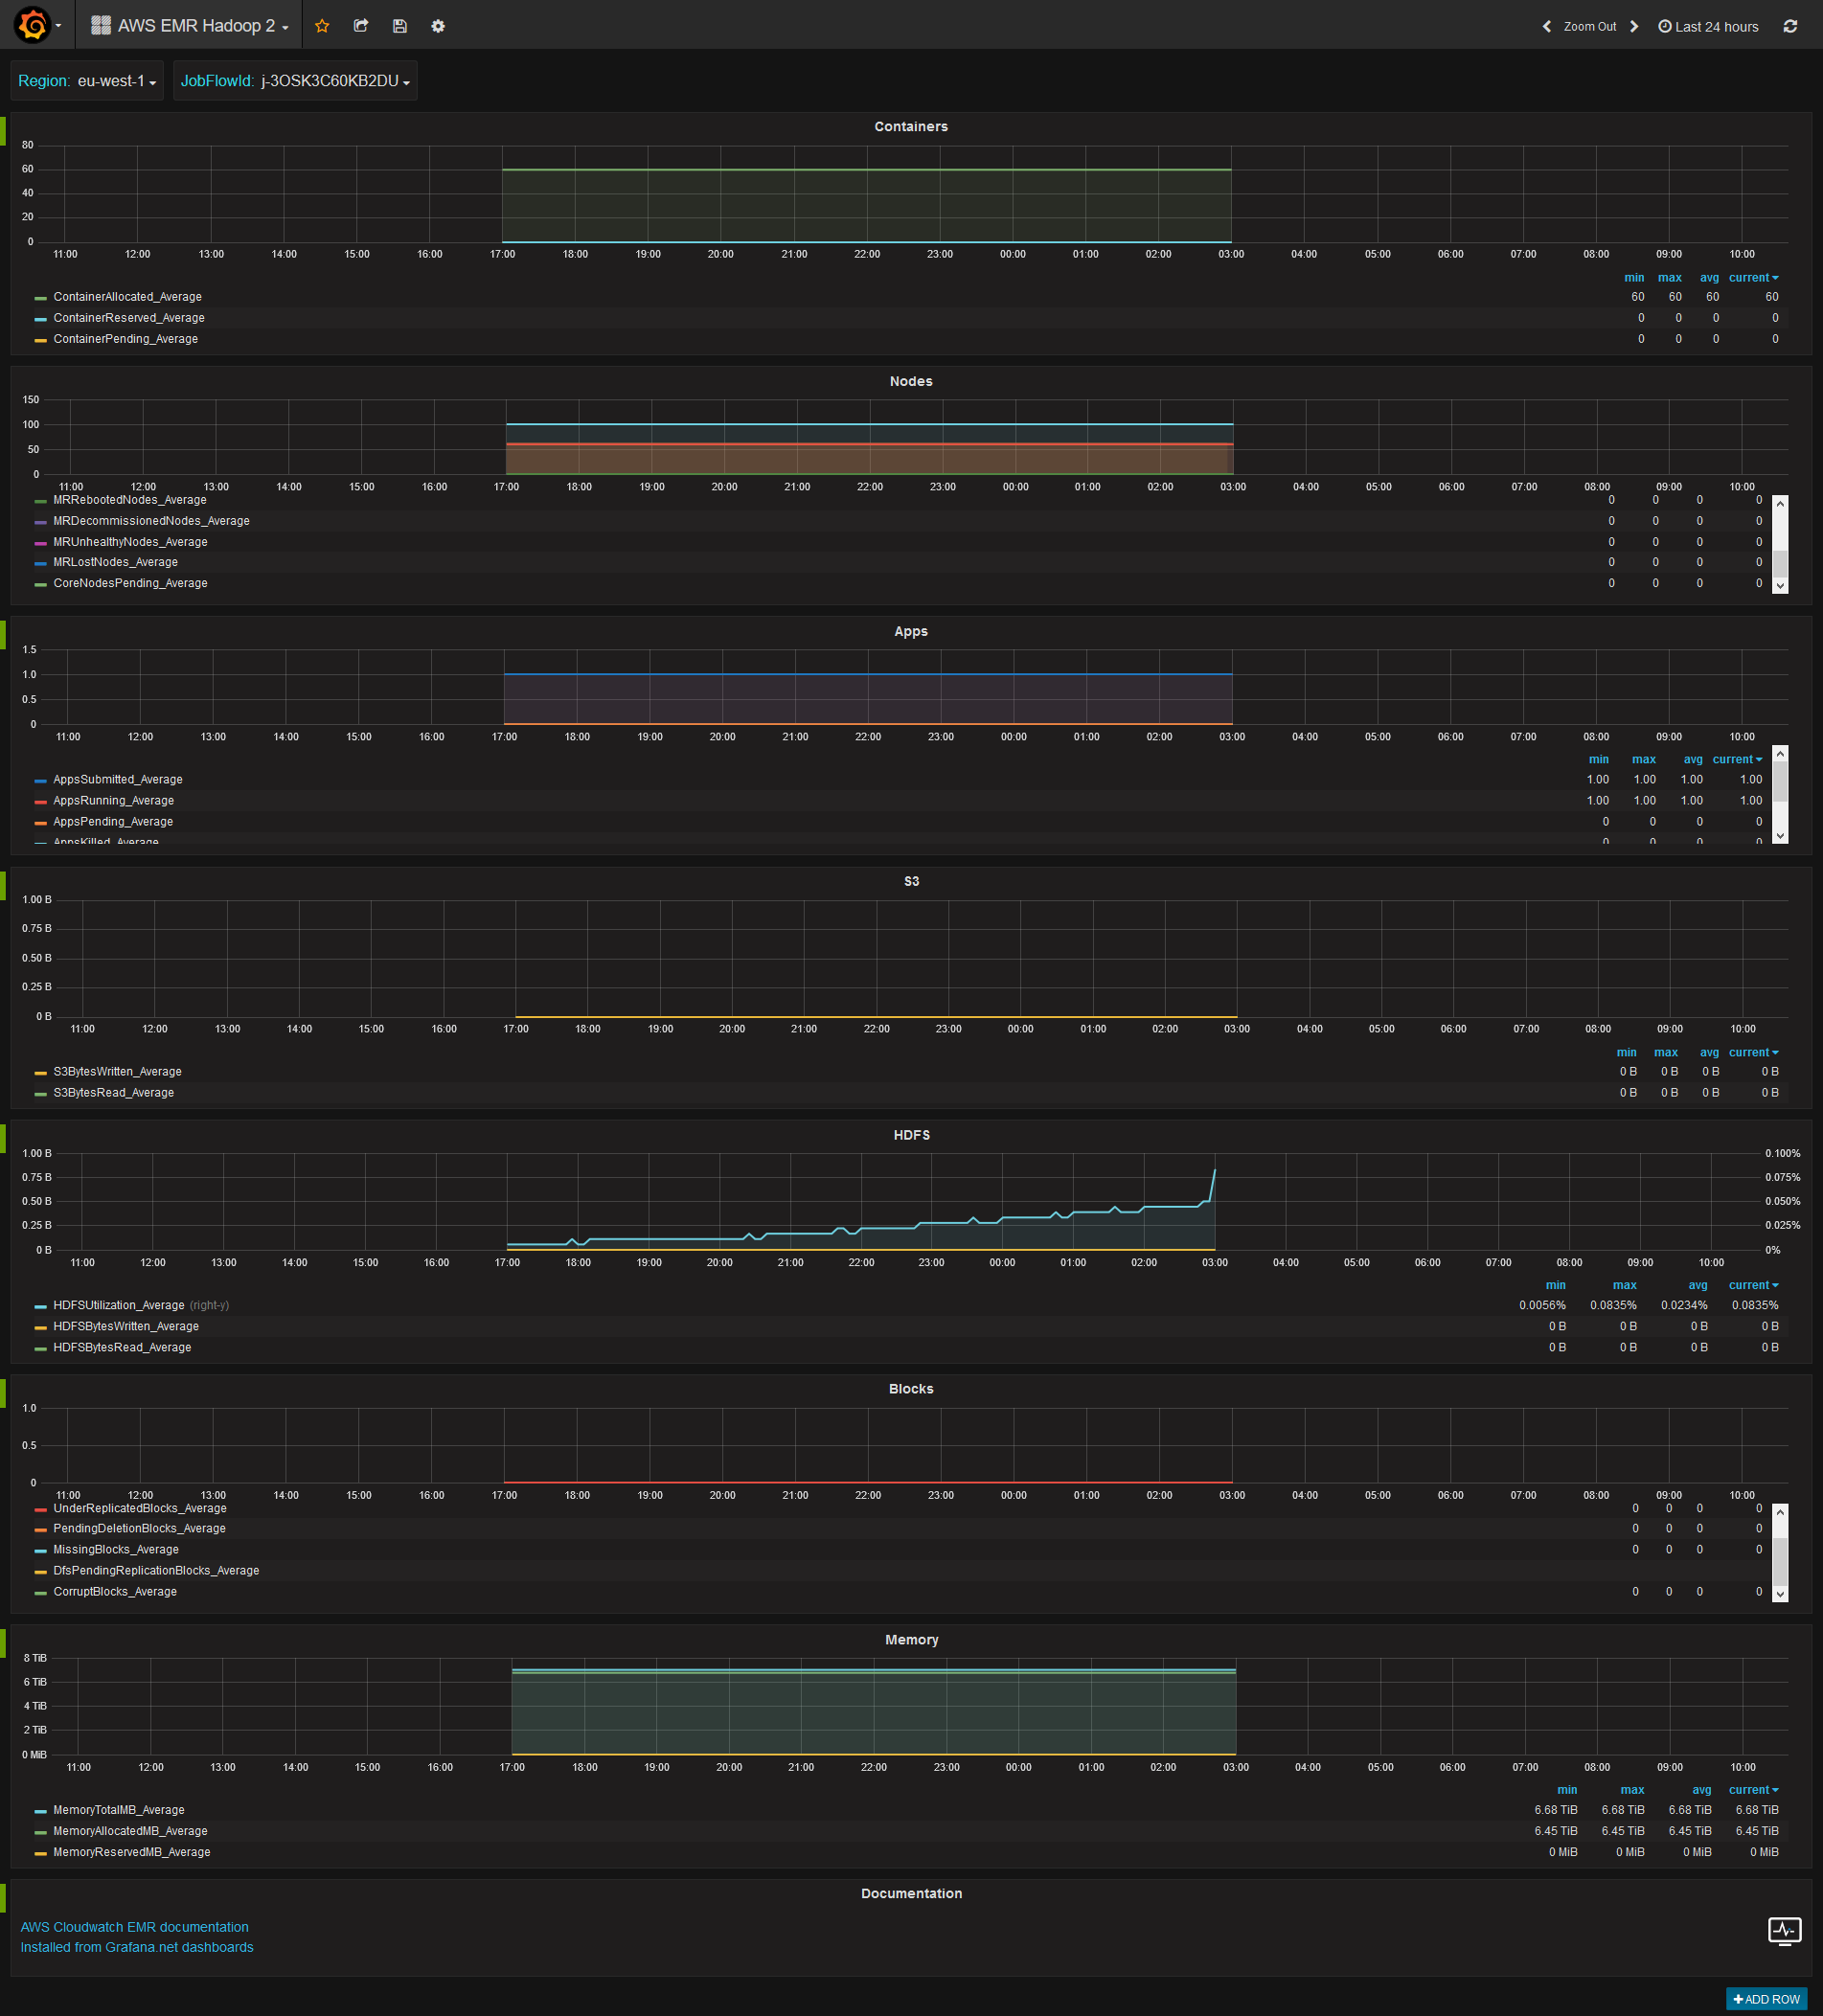
AWS EMR Hadoop 2
AWS Events
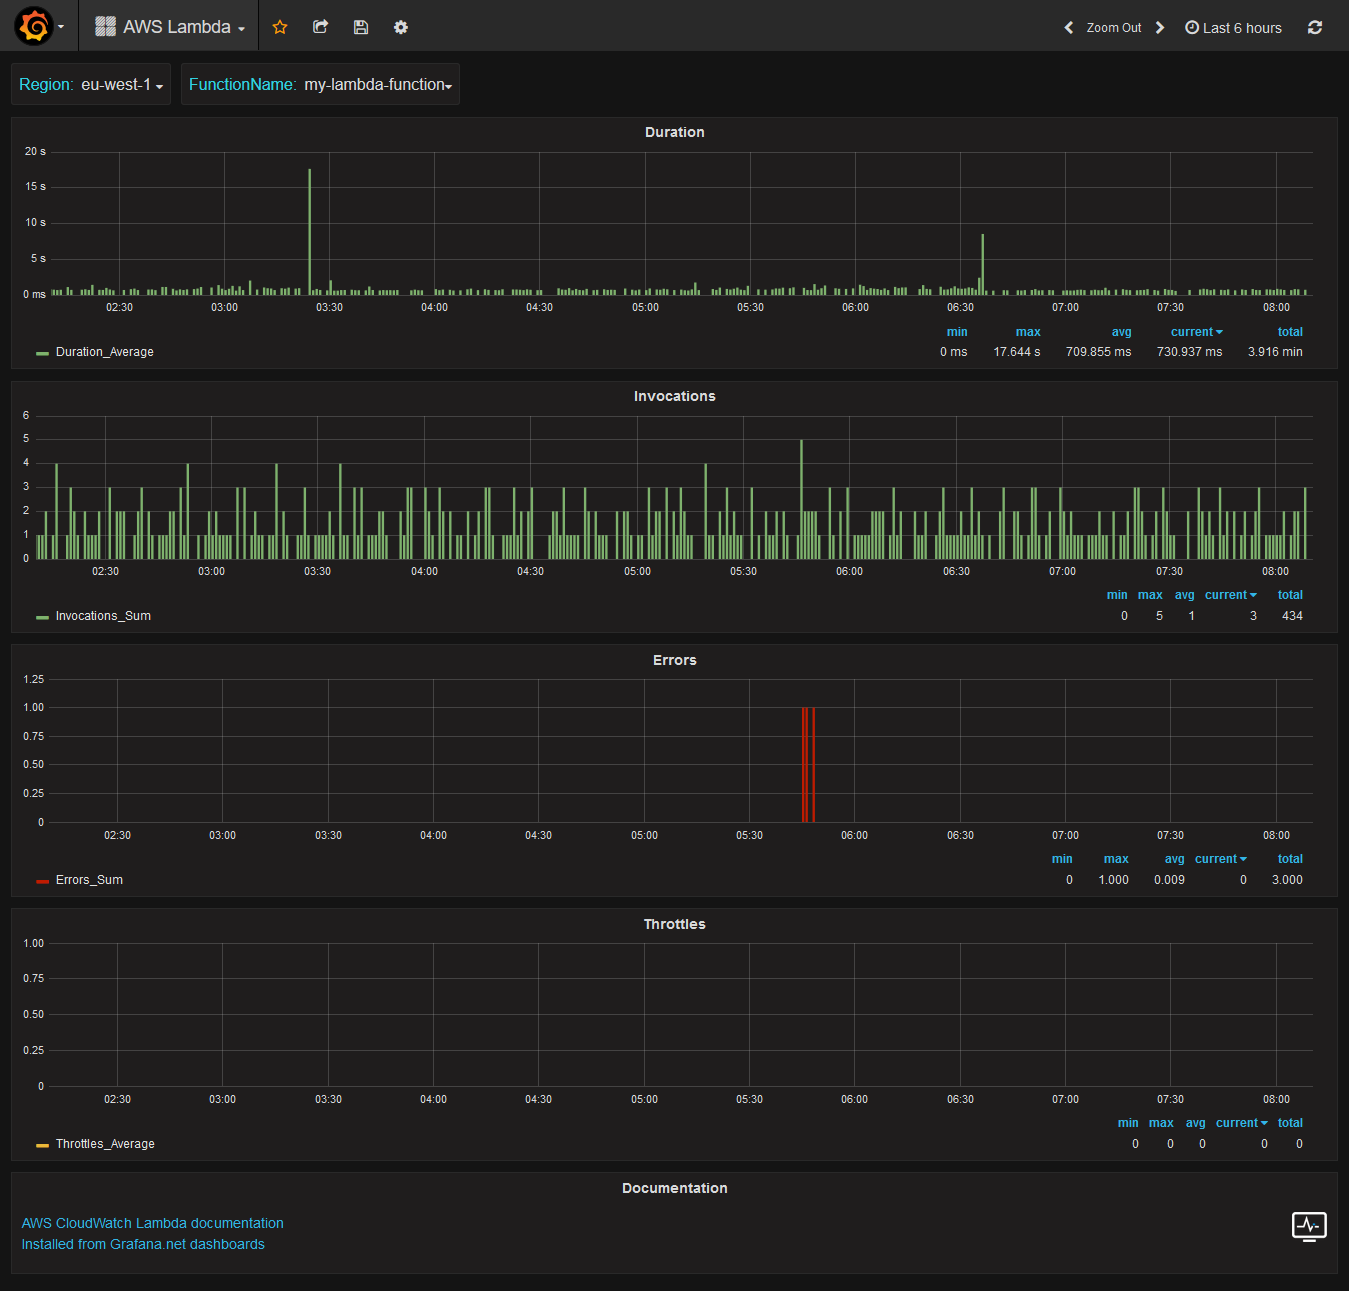
AWS Lambda
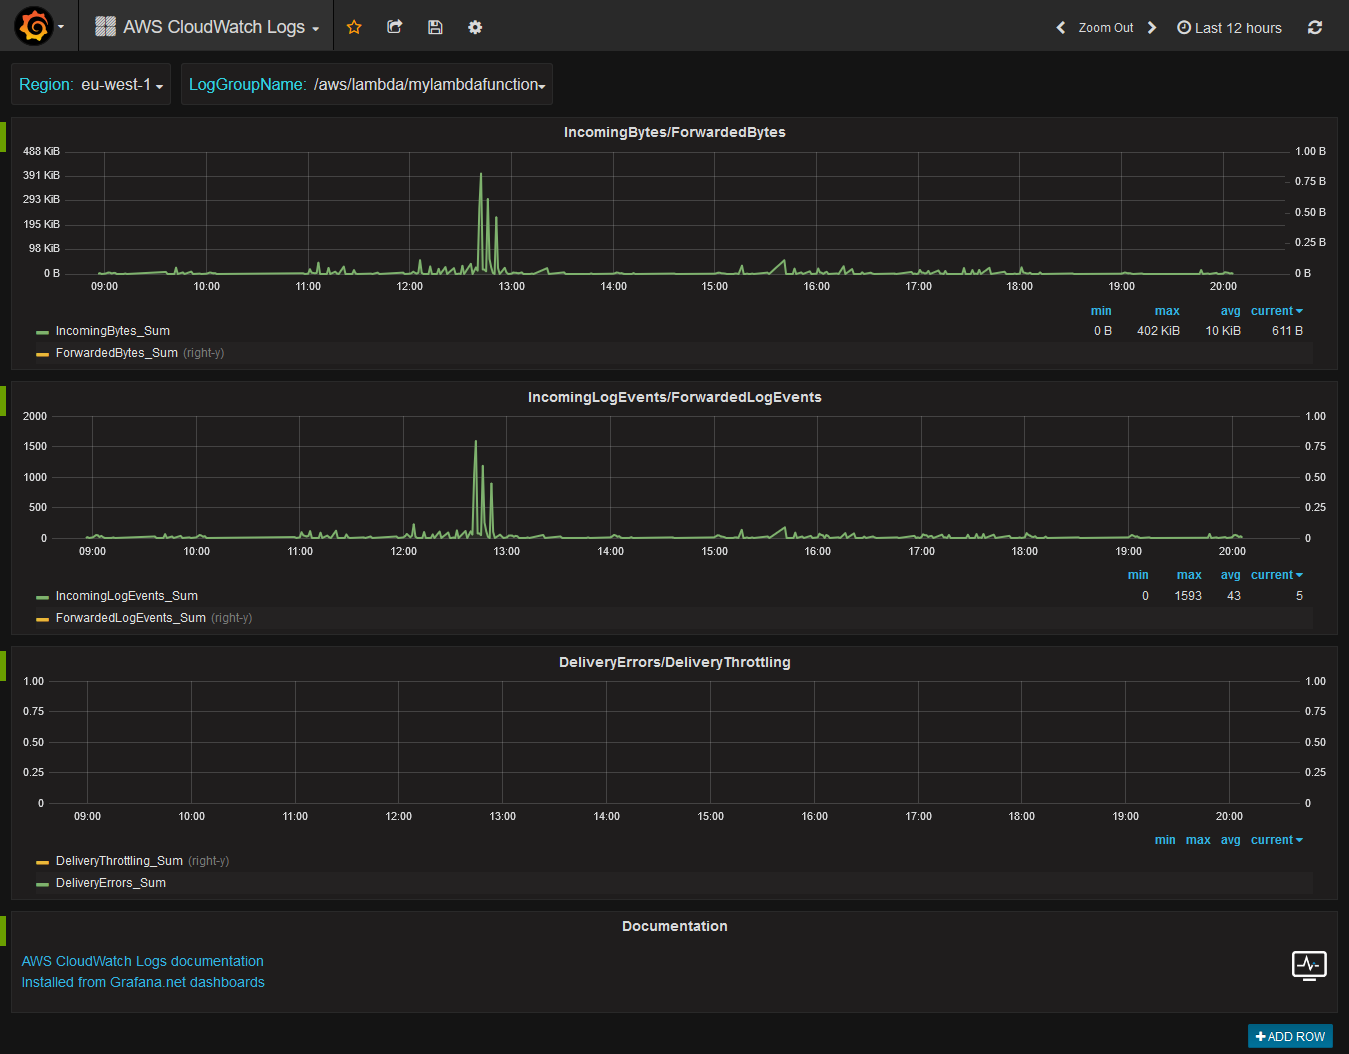
AWS Logs
AWS RDS
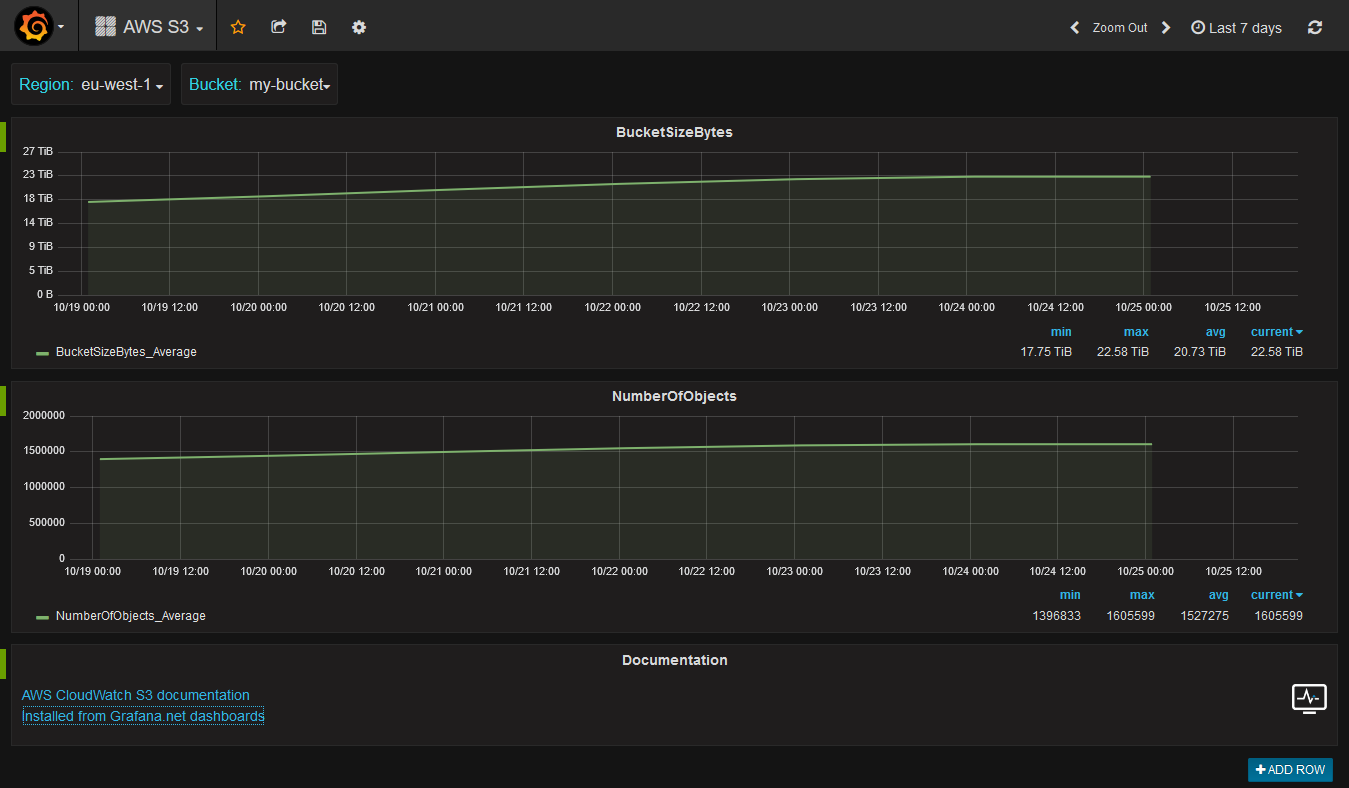
AWS S3
AWS SES
AWS SNS
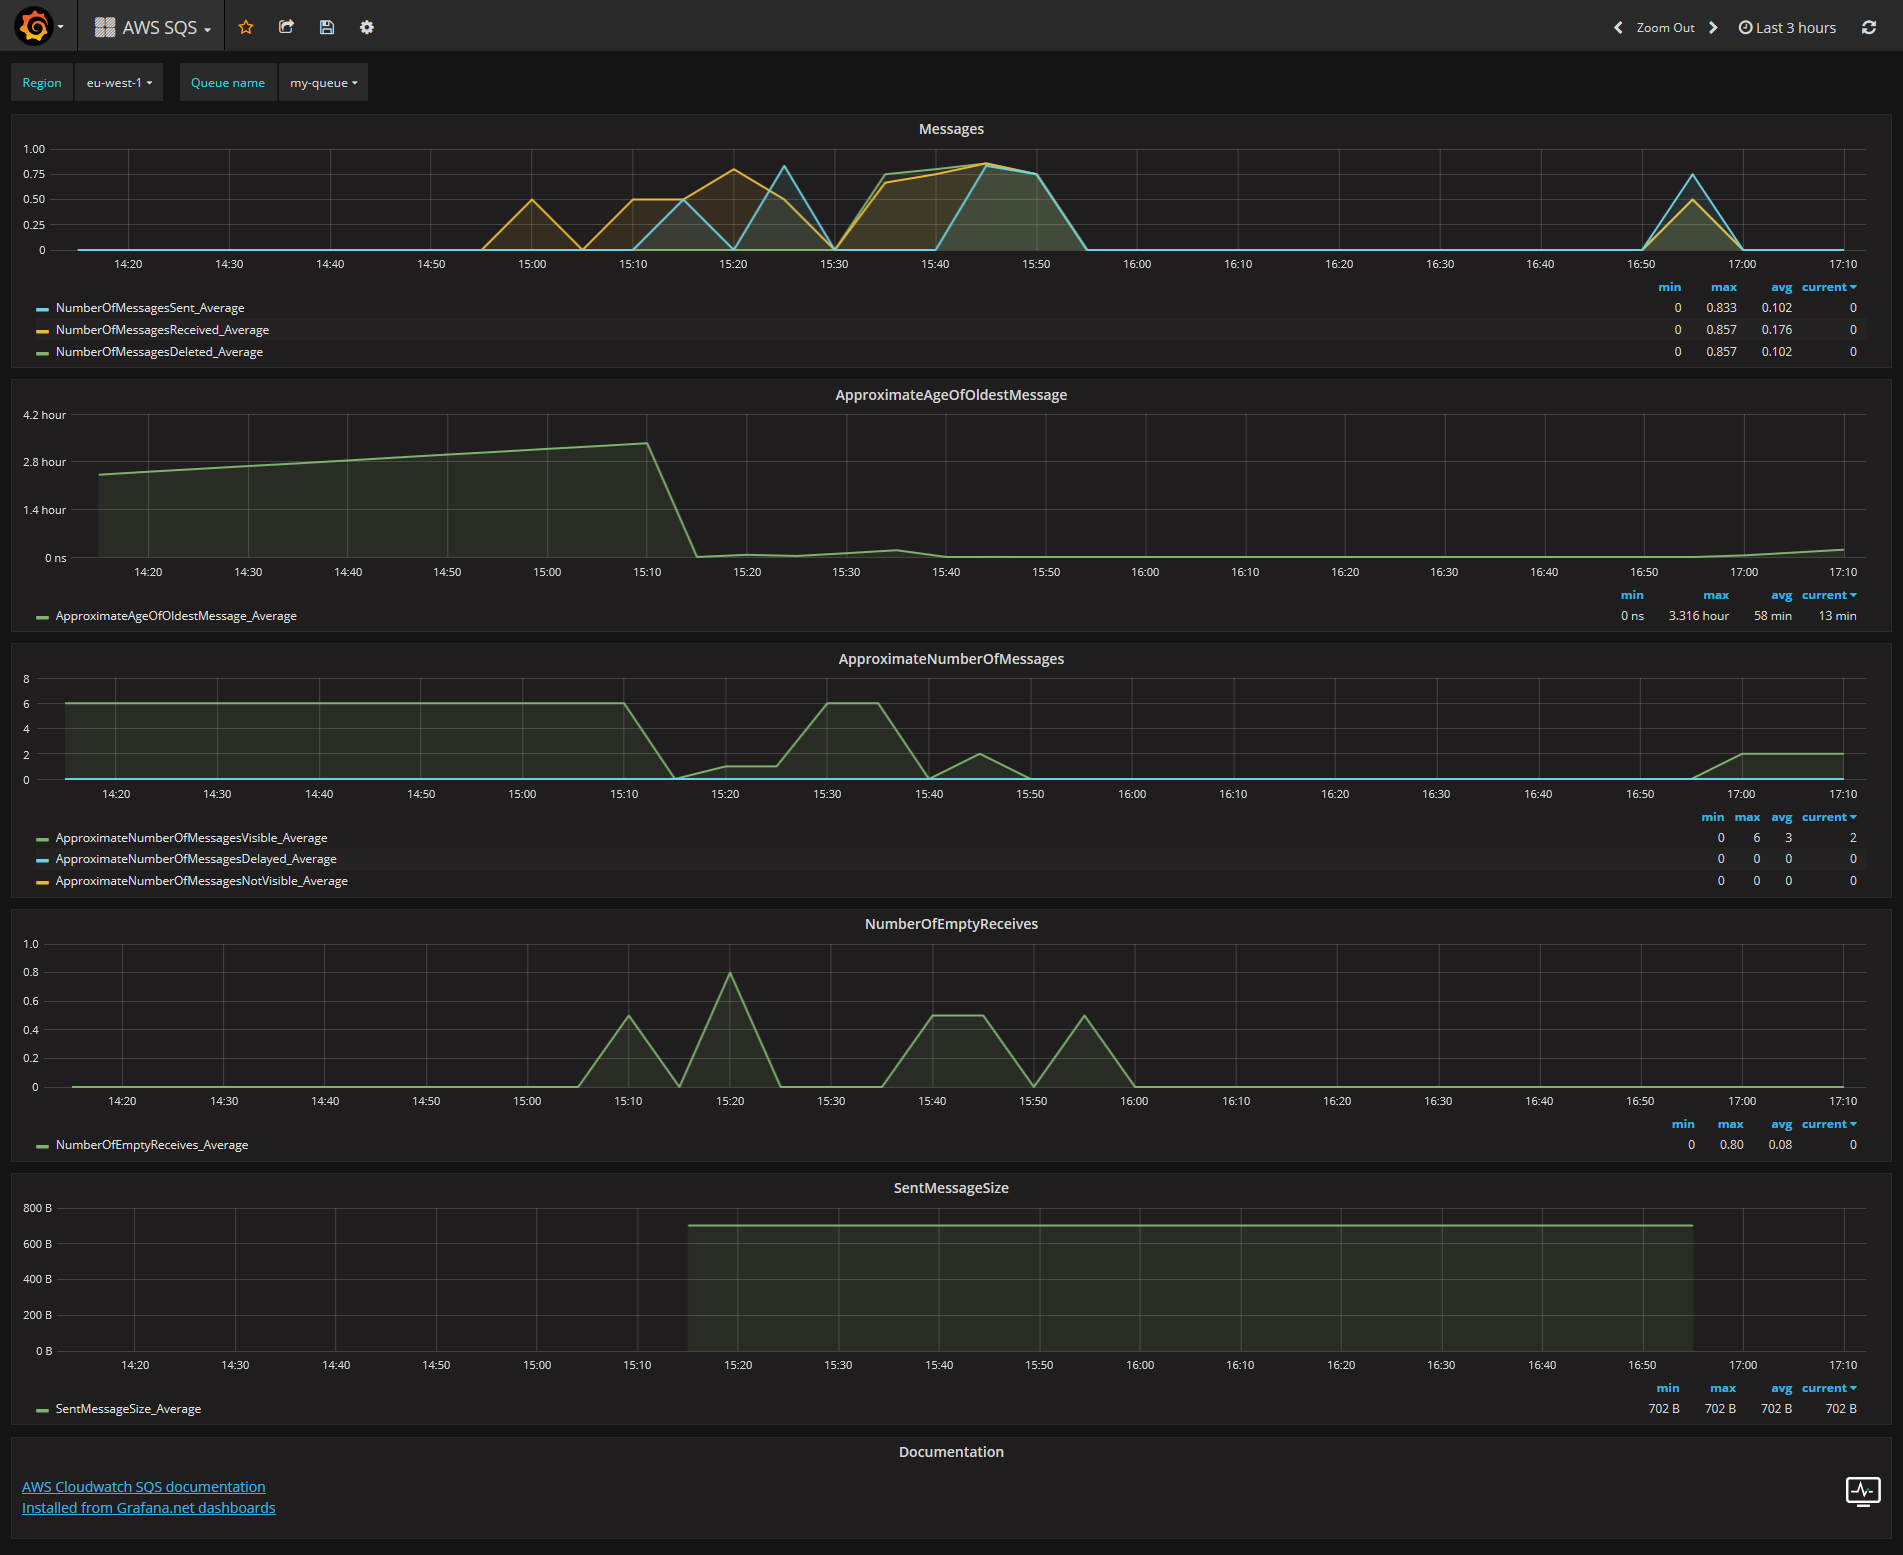
AWS SQS
Author
Devops Monitoring Expert, who loves monitoring systems and cutting/bleeding edge technologies: Docker, Kubernetes, ECS, AWS, Google GCP, Terraform, Lambda, Zabbix, Grafana, Elasticsearch, Kibana, Prometheus, Sysdig, ...
Summary:
- 1000+ GitHub stars
- 6000+ Grafana dashboard downloads
- 800 000+ Docker image pulls
Professional devops / monitoring / consulting services:

