by Felipe Zapata and C. Daniel Cadena
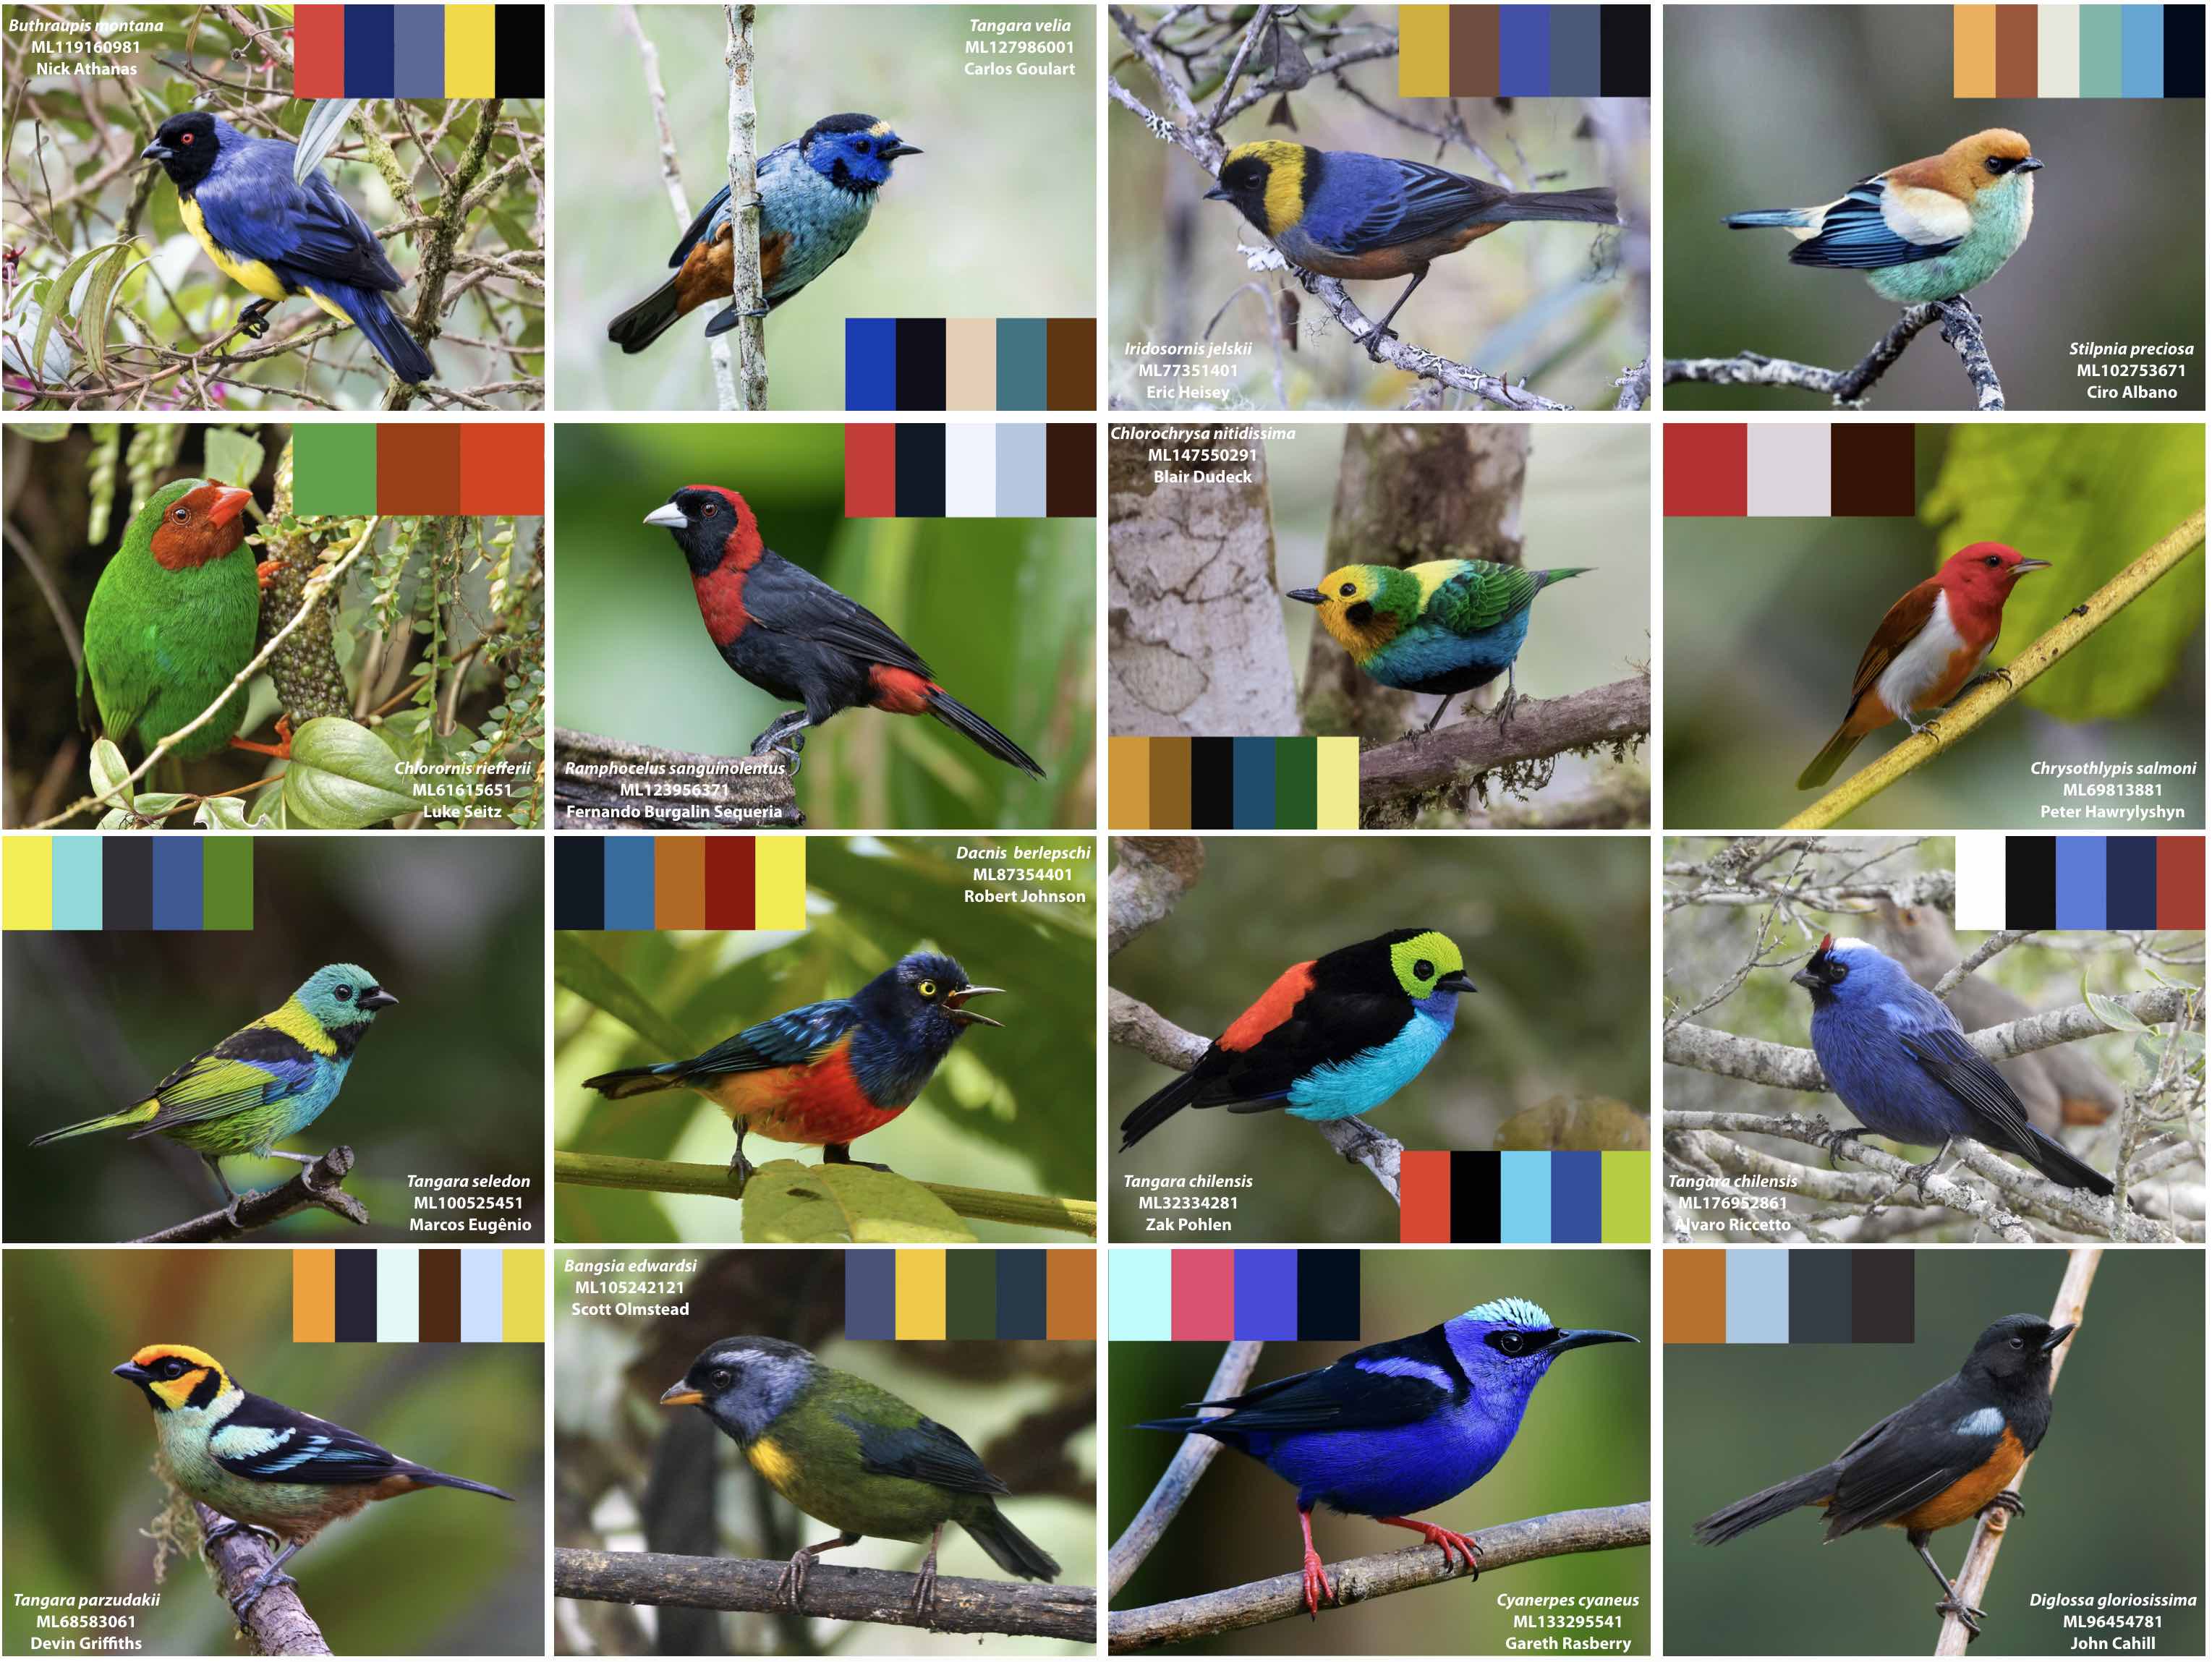
Sexual selection and natural selection have produced the most beautiful color patterns in the plumage of birds over millions of years of evolution - so why reinvent the (color) wheel? tanagR is an R package to generate color palettes for graphs inspired by the plumage of passerine birds in the tanager family (Thraupidae). The package currently includes palettes based on 16 tanager species from Central and South America.
tanagR is currently available only through GitHub. We will make it available via CRAN soon. To install tanagR via GitHub, you will need devtools
install.packages("devtools")
We strongly recommend to install or update to the latest version of devtools. If you have problems installing devtools please visit the devtools website here or here. You may need to install developer tools specific to your OS. We used devtools v 2.2.0 to build tanagR.
Once you have installed devtools you can load it and install tanagR.
library(devtools)
install_github("cdanielcadena/tanagR")
or
devtools::install_github("cdanielcadena/tanagR")
When installing tanagr, R will try to update curl. We have noticed some problems on MacOS using the version that requires compilation. We recommend to install the binary version of curl instead.
tanagR depends on the following R libraries:
ggplot2
graphics
grDevices
gridExtra
magick
All these libraries will be installed with tanagR if not available on your system. Installation should go smoothly. If you have issues, please double check the requirements for those libraries (e.g., R version, your OS, etc). For Linux or OSX users, magick requires installing other libraries; for further information on installing magick on Linux and OSX click here.
The typical pipeline for using tanagR involves 3 steps:
- Visualize color palettes to choose the one that fits your needs
- Select a color palette
- Use the selected color palette to make beautiful graphs
Load tanagR and list available palettes
library(tanagR)
names(tanagr_palettes)
You can use two different functions to visualize the palettes. To see only a color palette you can use
viz_palette("bangsia_edwardsi")
To see both the color palette and a photo of the bird species on which it is based use
visualize_palette("stilpnia_preciosa")
We made options to use tanagR easily with base R and ggplot2 graphs. This is an example using base R and a discrete palette
pal = tanagr_palette("bangsia_edwardsi")
data(iris)
plot(iris$Sepal.Width,
	iris$Sepal.Length,
	col = pal[as.numeric(iris$Species)],
	pch = 19,
	cex = 2)
This is an example using base R and a continuous palette
pal = tanagr_palette("dacnis_berlepschi", n = 100, discrete = FALSE)
image(volcano,
	col = pal,
	main = "Colors: Dacnis berlepschi")
You can use the palettes above with ggplot2, but we made a couple of helper functions to integrate tanagR easily with ggplot2. Here is an example using a discrete palette
library(ggplot2)
ggplot(iris,
	aes(x = Sepal.Length,
	    y = Petal.Length,
	    color = Species)) +
geom_point(size  = 3) +
geom_density2d() +
theme_bw(base_size = 12) +
scale_color_tanagr(palette_name = "stilpnia_preciosa")
This is an example using a continuous palette
ggplot(iris,
	aes(x = Sepal.Width,
	    y = Sepal.Length,
	    color = Petal.Width)) +
geom_point(size  = 4) +
theme_bw(base_size=12) +
scale_color_tanagr(palette_name = "chlorochrysa_nitidissima",
                   discrete = FALSE)
This is an example using a "filling" aesthetic with a discrete palette
ggplot(mpg, aes(fl, fill = fl)) +
	geom_bar() +
	theme(axis.text.x = element_text(hjust = 1), panel.background = element_blank()) +
	scale_fill_tanagr(palette = "stilpnia_preciosa", guide = "none")
And this one using a continuous palette
library(gridExtra)
g = ggplot(faithfuld, aes(waiting, eruptions)) +
	geom_raster(aes(fill = density)) +
	theme_bw() +
	theme(panel.grid=element_blank())

grid.arrange(
	g + scale_fill_tanagr(palette = "cyanerpes_cyaneus", guide = "none", discrete  = FALSE),
	g + scale_fill_tanagr(palette = "dacnis_berlepschi", guide = "none", discrete  = FALSE),
	g + scale_fill_tanagr(palette = "ramphocelus_sanguinolentus", guide = "none", discrete  = FALSE),
	g + scale_fill_tanagr(palette = "tangara_seledon", guide = "none", discrete  = FALSE),
	ncol = 2, nrow = 2
	)
Please use the issue tracker to file issues. Please do not send us emails.
- More color palettes
- Color-blind friendly palettes
- Automatic generation of color palette given a bird name, extendable to species in other families
Thanks to Karthik Ram for releasing his wesanderson library under MIT license.
All photographs used to generate palettes were obtained from The Macaulay Library at the Cornell Lab of Ornithology.
