Local craft breweries and their correlation to outdoor retailers.
Our team believed there was potential for retail growth based on locations in the nearby vicinity of breweries. The increasing popularity of both breweries and outdoor clothing establishments may lead to data that could assist future development.
- Is there a strong current correlation between breweries and outdoor clothing stores?
- What is the potential market opportunity for clothing store expansion based on brewery locations?
- What is the potential market opportunity for brewery expansion based on outdoor clothing locations?
- Data is preprocessed and cleaned by removing unneeded columns, merging zip code/cities datasets, and limiting dataset to the top 1,000 most populated cities.
- To obtain the best possible predictive results, preliminary features should be explored, engineered, and carefully selected. Possible preliminary features for this model could be average income per zipcode, income per capita, and clothing stores per brewery count.
- The importance of correlation between breweries and outdoor clothing stores will drive which features will be engineered and selected, ultimately answering the hypothesis.
- Data was split into training and testing sets using train_test_split and a random state of 24. This will assist in evaluating the performance of the model in relation to the dataset.
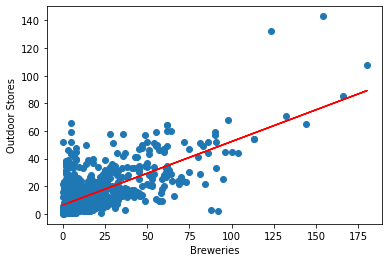
- A linear regression model was chosen to best illustrate correlation between brewery location and outdoor clothing store location. Is there a strong relationship between the two? The benefits of using a linear regression is readability and abiility to answer basic questions. Limitations of a linear regression model will be sensitivity to outliers.
Brewery-Outdoor Analysis-Machine Learning Model
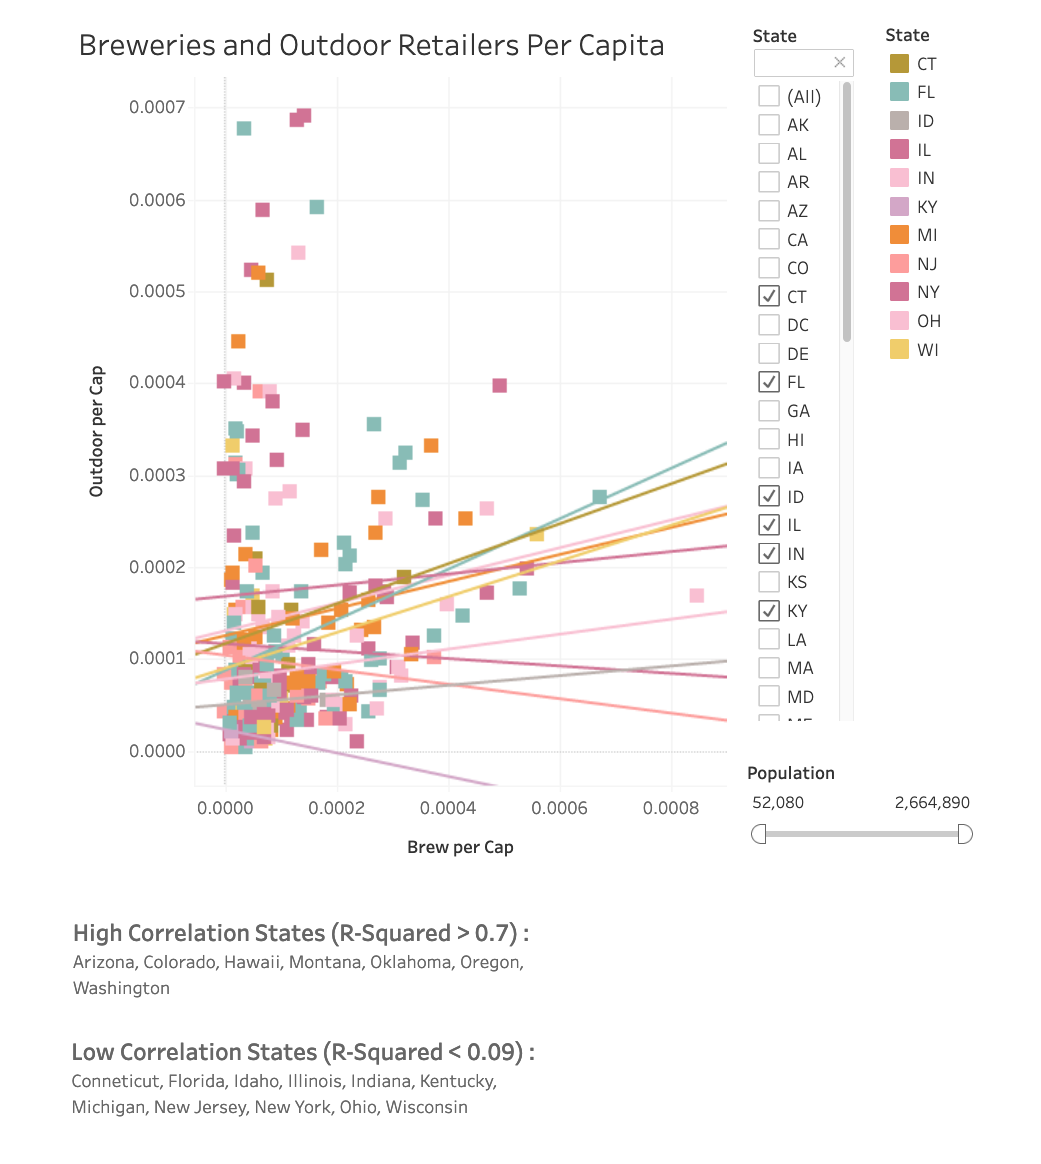
- The amount of breweries and outdoor clothing stores in a location have little impact on each other. While customers may like both shops, there is not a strong correlation to the two variables based on the machine learning model.
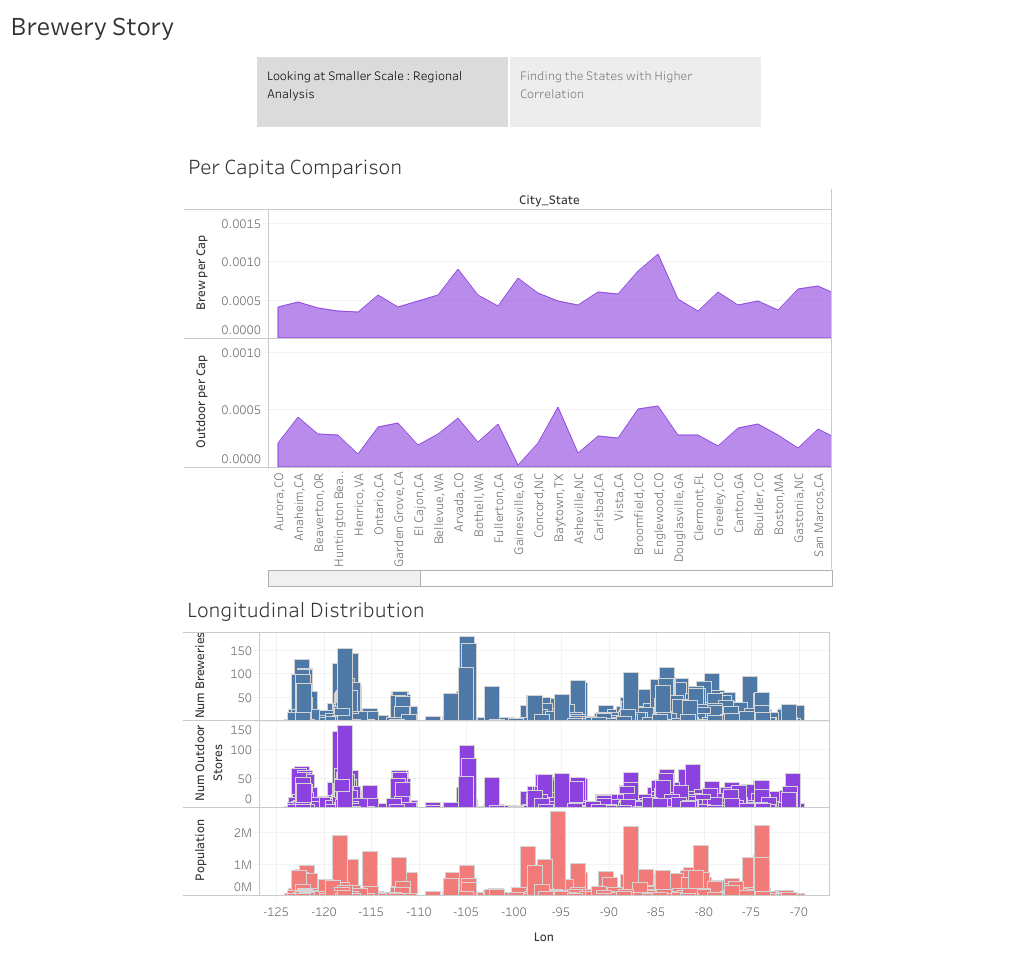
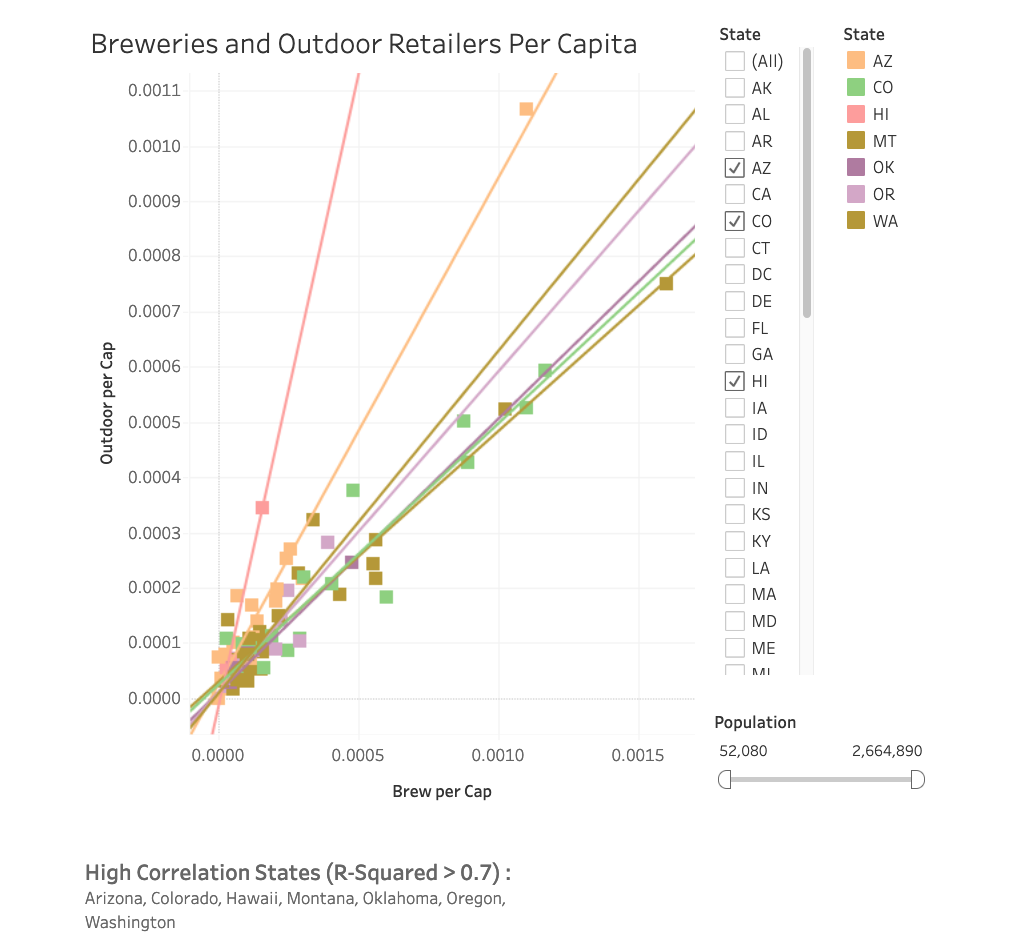
- Cities similar to Portland, Oregon may be outliers and simply have an above average amount of both breweries and outdoor stores, independent of each other. We observed that regionally there is a correlation between the two variables and specific regions.
- Cities similar to Portland, Oregon may be outliers and simply have an above average amount of both breweries and outdoor stores, independent of each other. There is also the possibility that the original hypothesis is biased towards being a Pacific Northwest phenomemom.
With the low correlation of breweries and outdoor stores, the team recommends looking into possible other hypotheses.
- Regionally there may a stronger correlation between breweries and outdoor stores.
- Areas with higher levels of disposable income have greater opportunities for outdoor clothing stores.
- Areas with high foot traffic have more outdoor stores and/or breweries.
- Areas with both higher income and lower real estate costs have more breweries or outdoor clothing stores.
Using the yelpapi python package, we queried business information from the Yelp business_search endpoint.
IRS SOI Tax Stats - Individual Income Tax Statistics from 2019, available here: https://www.irs.gov/statistics/soi-tax-stats-individual-income-tax-statistics-2019-zip-code-data-soi
CSV of data directly accessed here: https://www.irs.gov/pub/irs-soi/19zpallagi.csv
Includes population data, used to create our top 1000 cities table. https://www.unitedstateszipcodes.org/zip-code-database/
- Python (including
pandas,numpy,sklearn,yelpapi,matplotlib,sqlalchemy) - Tableau
- Jupyter Notebook / Lab
- PostgreSQL (including pgAdmin)
- Google Slides
- LucidChart
- Brandon Clark
- Brandon Driver
- Tim Nilsen
- Warren Pavlat


