A bike-sharing program in Des Moines is being proposed. To solidify the proposal, one of the key stakeholders would like to see a bike trip analysis for New York City's Citi Bike program. See the results of our analysis below.
The Tableau results of our analyis can be accessed directly here. For convenience, they have been replicated below as well.
As included in the above analysis, our primary insights are as follows:
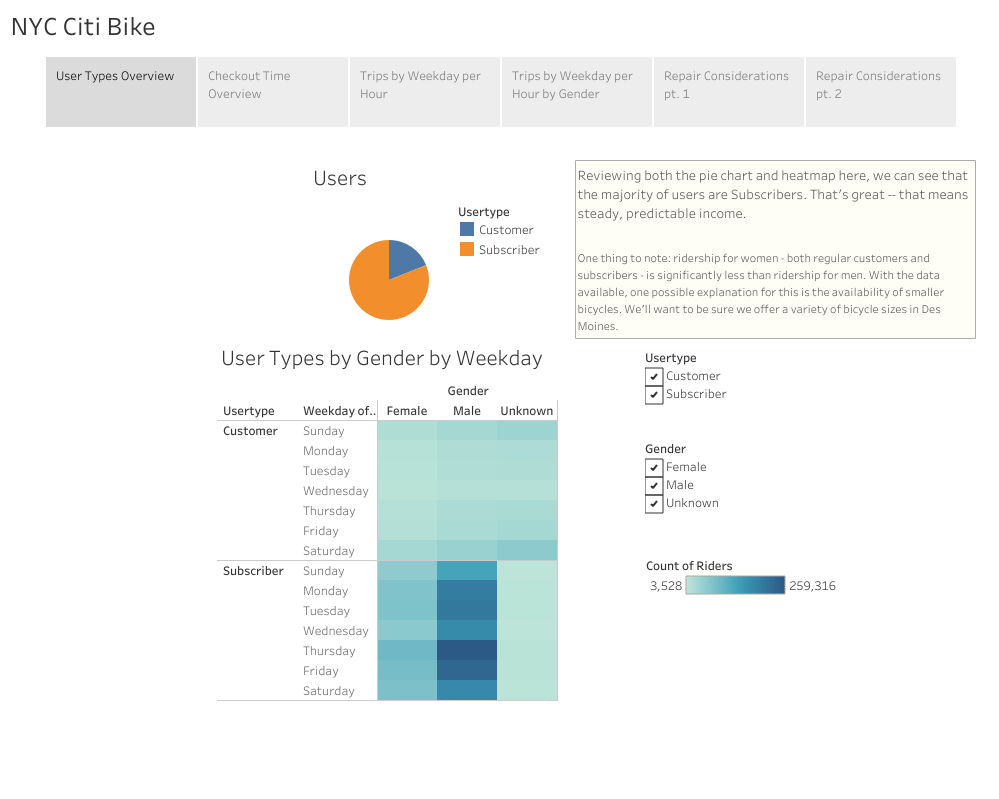
- riders primarily consist of subscribers, which mean steady, more guaranteed income
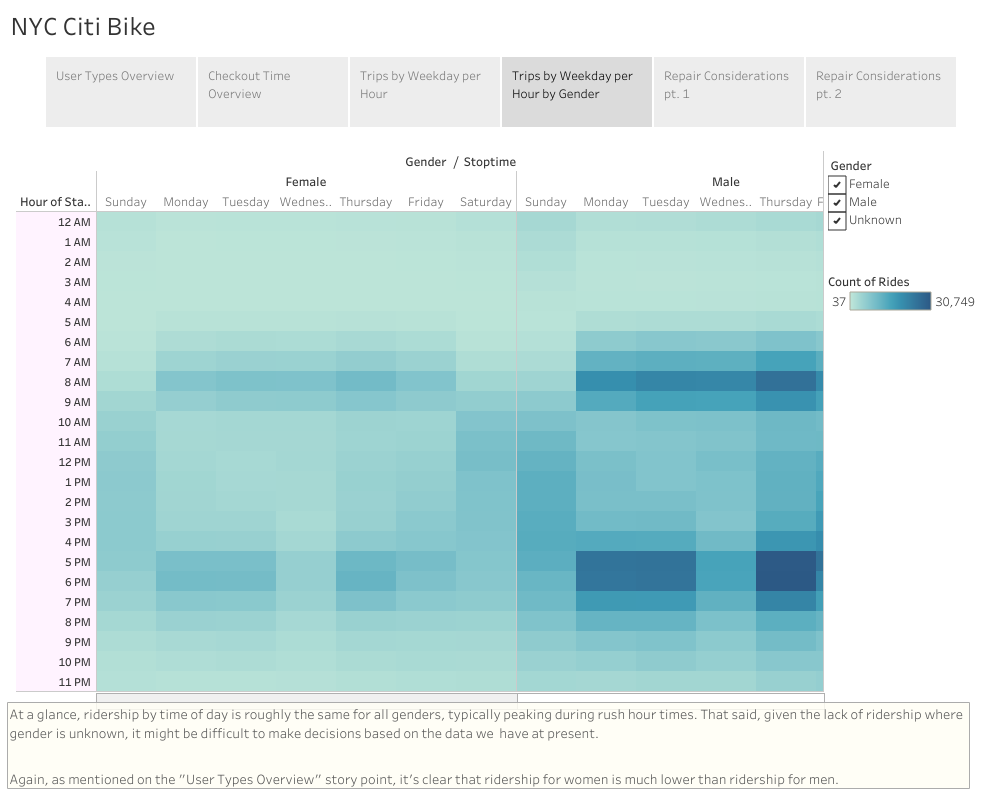
- ridership for women is significantly lower than ridership for men; some investigation is likely warranted, but we might start with the hypothesis that "ridership for women is less than ridership for men because there is a lack of a variety of bicycle sizes available"
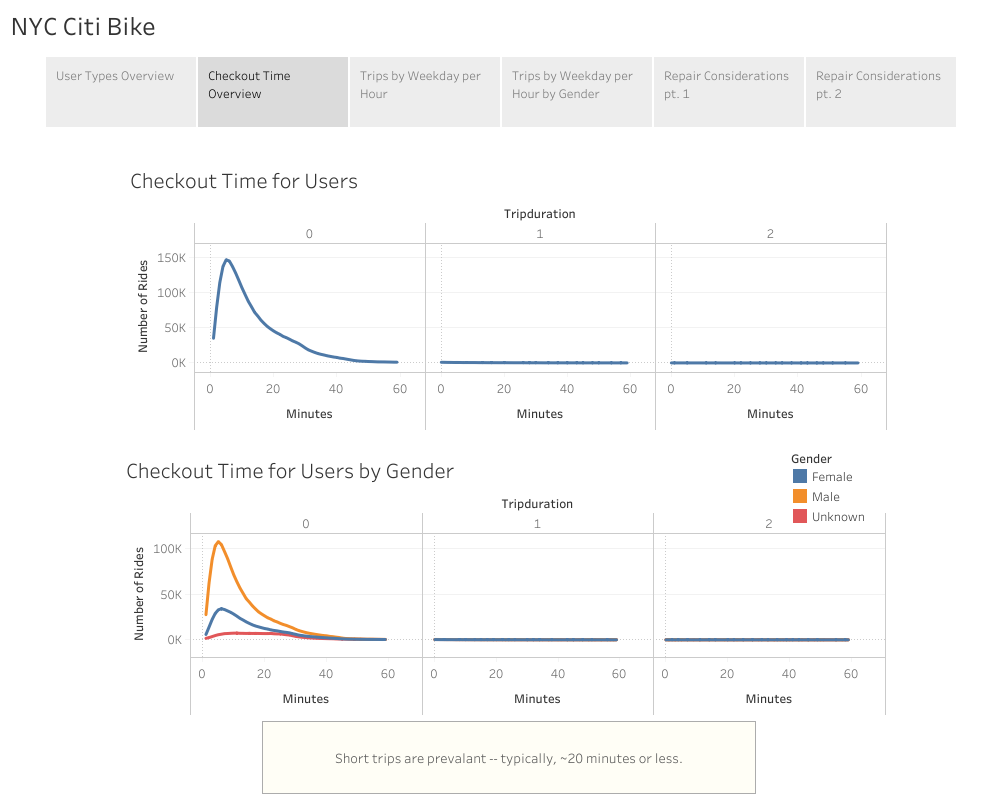
- most rides are ~20 minutes or less
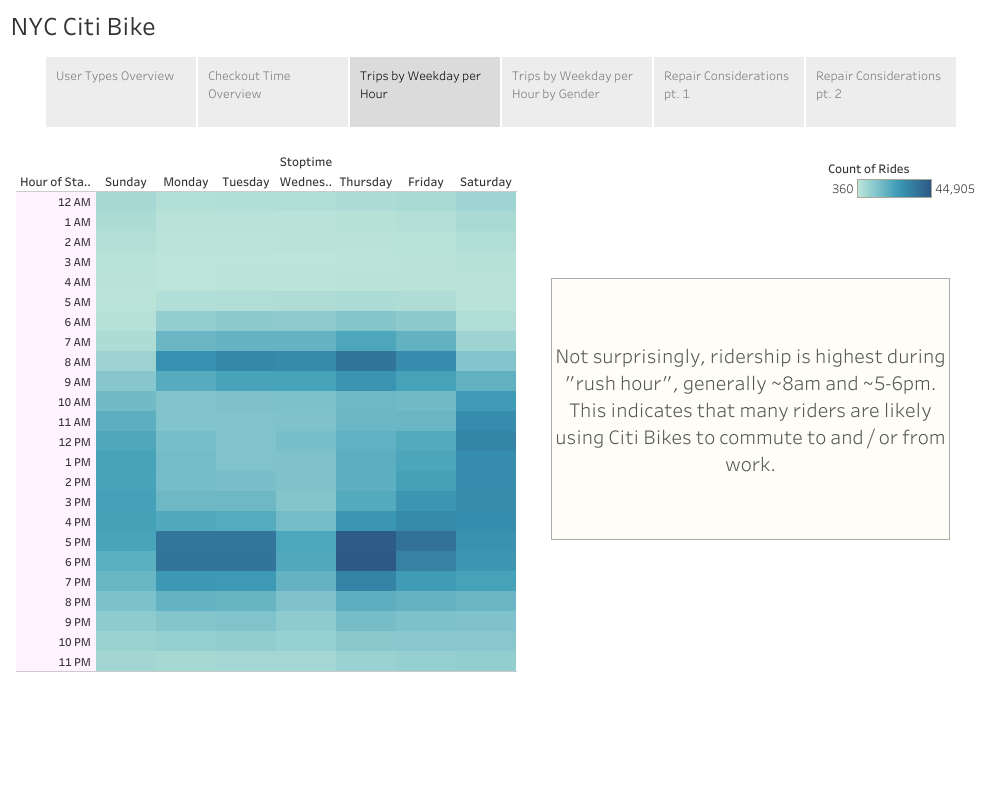
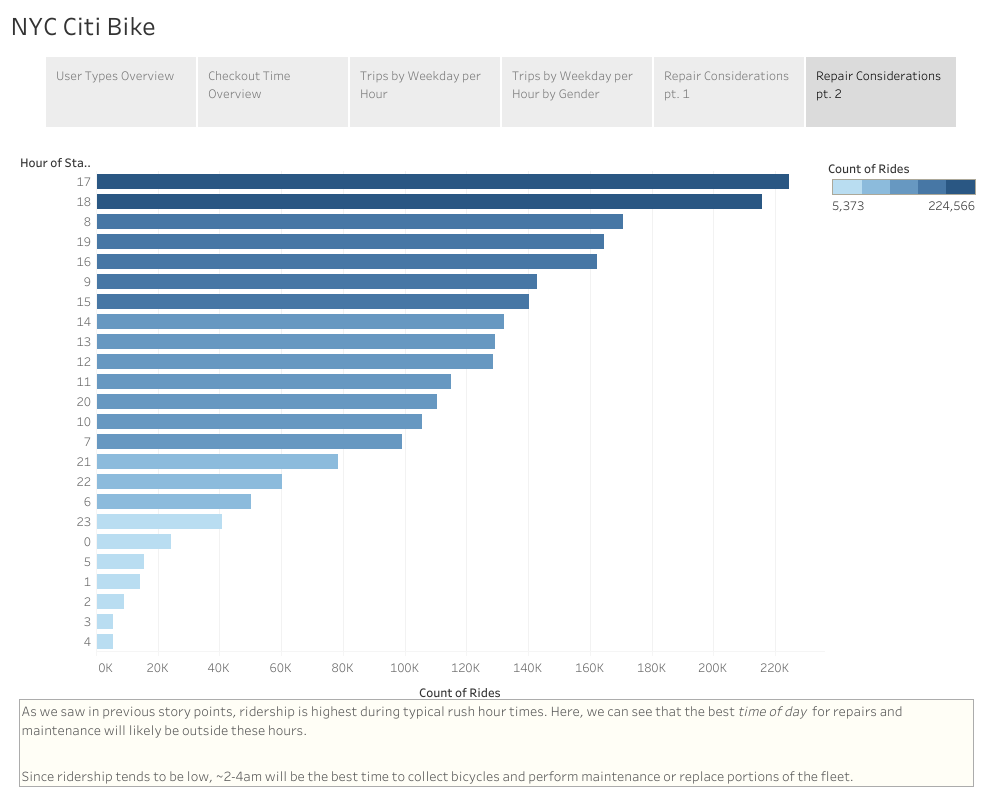
- most rides occur during "rush hour" times, likely to commute to and / or from work
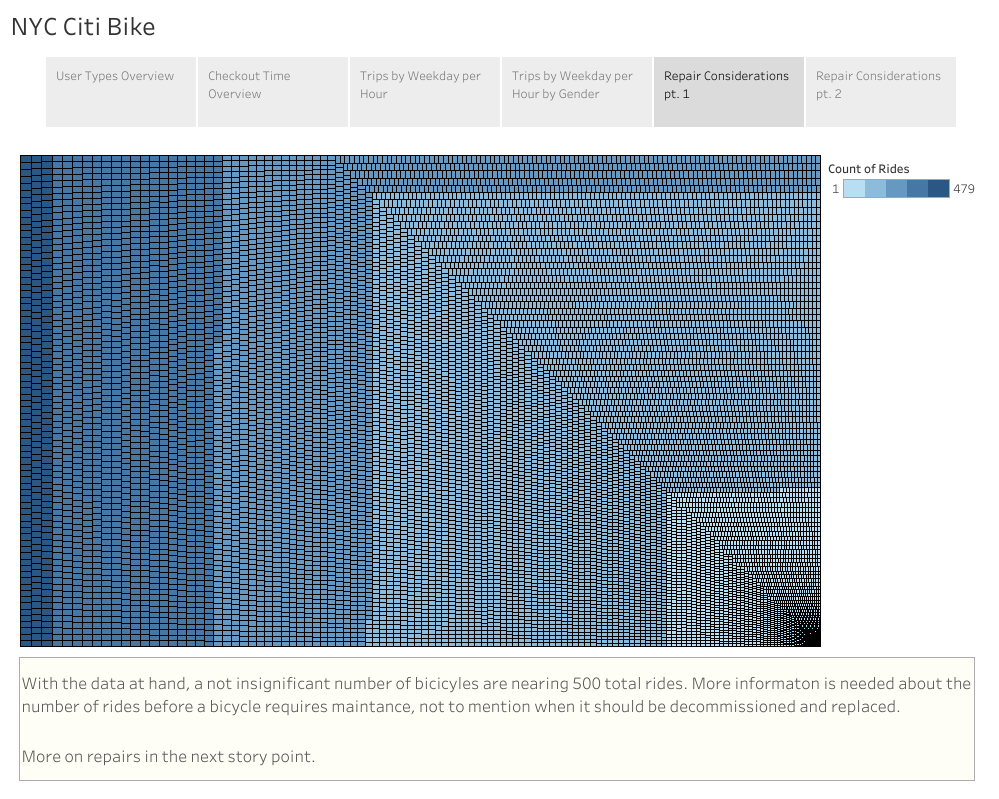
- a number of bicycles in our fleet were approaching nearly 500 rides; more investigation is necessary to outline a comprehensive maintenance and replacement schedule
If we were to examine this dataset further, the following two analyses and visualizations would be helpful:
- examine repeat riders, especially by geographic location; this could help us to determine how to better serve users, placing bicycles in locations where we might garner additional repeat riders
- review user type by birth year; we may wish to streamline payment options or the app UI if we find that there is a trend by birth year leaning toward a particular user type (customer or subscriber)
