the following project will give you a very simple introduction to Kibana.
the following project assumes you have on your machine:
- docker
- linux
for all the install process you will need to be root. Let's start from Elastic search. It's a Java server which uses Lucene for the indexing and the data search.
aurelien@linux:~$ /usr/bin/docker run -d -p 9200:9200 -p 9300:9300 -it -h elasticsearch --name elasticsearch elasticsearch
 aurelien@linux:~$ /usr/bin/curl -v http://localhost:9200
* Rebuilt URL to: http://localhost:9200/
*   Trying 127.0.0.1...
* TCP_NODELAY set
* Connected to localhost (127.0.0.1) port 9200 (#0)
> GET / HTTP/1.1
> Host: localhost:9200
> User-Agent: curl/7.55.1
> Accept: */*
>
< HTTP/1.1 200 OK
< content-type: application/json; charset=UTF-8
< content-length: 327
<
{
  "name" : "rCUAkYx",
  "cluster_name" : "elasticsearch",
  "cluster_uuid" : "paJIM6ykRlC-VgzY0PPCFQ",
  "version" : {
    "number" : "5.6.8",
    "build_hash" : "688ecce",
    "build_date" : "2018-02-16T16:46:30.010Z",
    "build_snapshot" : false,
    "lucene_version" : "6.6.1"
  },
  "tagline" : "You Know, for Search"
}
Now let's install Kibana and link it to our Elastic Search instance.
aurelien@linux:~$ /usr/bin/docker run -d -p 5601:5601 -h kibana --name kibana --link elasticsearch:elasticsearch kibana
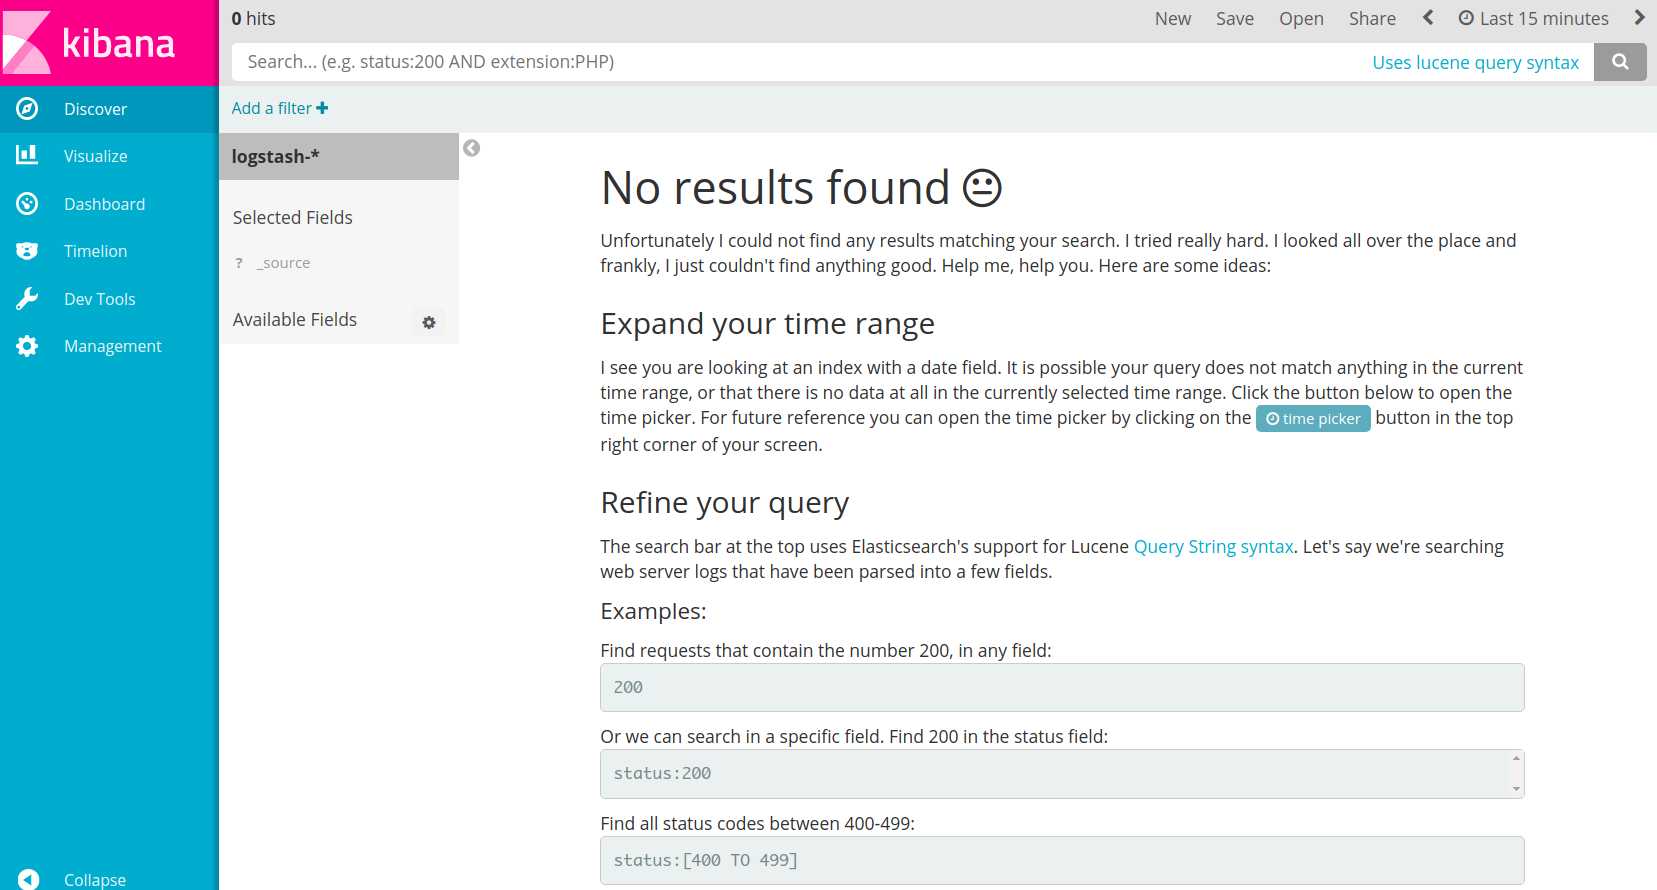
You can check if the project is correctly set up by opening this url from your browser. Here is what you should see:

Now in the project directory let us create a logstash.conf on which we'll define that the inputs will be received from the standard input
aurelien@linux:~$ cd PROJECT_DIR
aurelien@linux:~$ /usr/bin/vim logstash.conf

input {
  stdin {}
}

output {
  elasticsearch { hosts => ["elasticsearch:9200"] }
}
We are ready for running the Log stash instance by specifying the configuration's file.
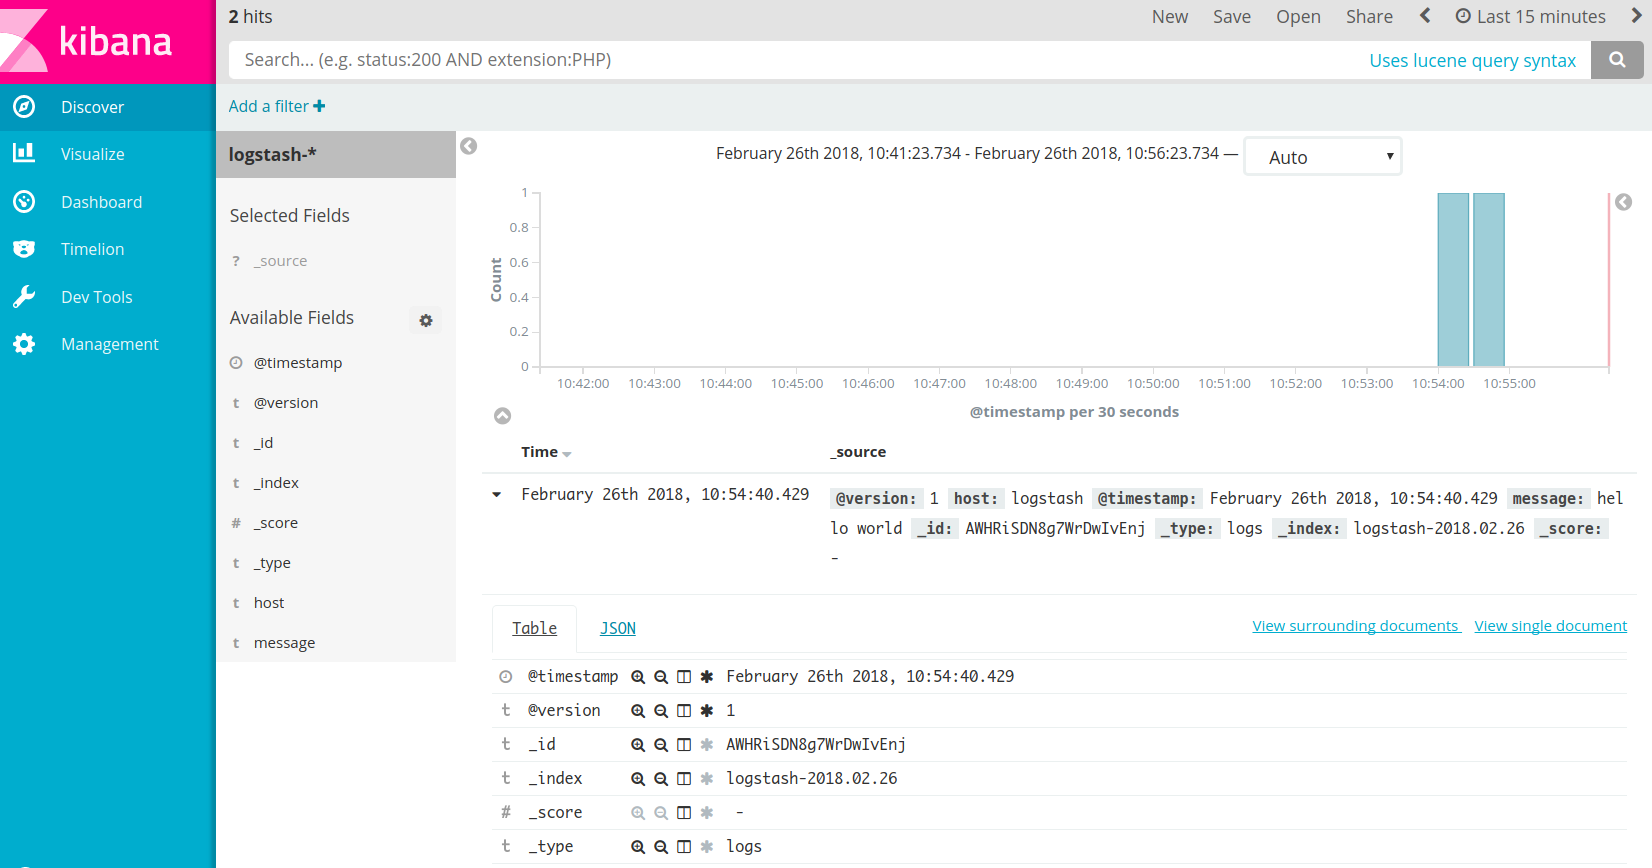
Let's write "hello world" from the shell. Remember to create the index logstash-* in Kibana's dashboard.
aurelien@linux:~$ /usr/bin/docker run -h logstash --name logstash --link elasticsearch:elasticsearch -it --rm -v "$PWD":/config-dir logstash -f /config-dir/logstash.conf

09:49:47.805 [[main]-pipeline-manager] INFO  logstash.outputs.elasticsearch - New Elasticsearch output {:class=>"LogStash::Outputs::ElasticSearch", :hosts=>["//elasticsearch:9200"]}
09:49:47.809 [[main]-pipeline-manager] INFO  logstash.pipeline - Starting pipeline {"id"=>"main", "pipeline.workers"=>8, "pipeline.batch.size"=>125, "pipeline.batch.delay"=>5, "pipeline.max_inflight"=>1000}
09:49:47.845 [[main]-pipeline-manager] INFO  logstash.pipeline - Pipeline main started
The stdin plugin is now waiting for input:
09:49:47.904 [Api Webserver] INFO  logstash.agent - Successfully started Logstash API endpoint {:port=>9600}
hello world
Here is what you can see now on the dashboard:

Now let's kill the logstash instance (ctrl+c)
09:59:09.345 [SIGINT handler] WARN  logstash.runner - SIGINT received. Shutting down the agent.
09:59:09.355 [LogStash::Runner] WARN  logstash.agent - stopping pipeline {:id=>"main"}
Still the project directory let us create a second logstash_tcp.conf on which we'll define that the inputs will be received from a TCP connection on the port 9500.
aurelien@linux:~$ cd PROJECT_DIR
aurelien@linux:~$ /usr/bin/vim logstash_tcp.conf

input {
  tcp {
    port => 9500
  }
}

output {
  elasticsearch { hosts => ["elasticsearch:9200"] }
}
Let's run Log stash's instance:
aurelien@linux:~$ /usr/bin/docker run -h logstash_tcp -p 9500:9500 --name logstash_tcp --link elasticsearch:elasticsearch -it --rm -v "$PWD":/config-dir logstash -f /config-dir/logstash_tcp.conf
And let's write some messages:
aurelien@linux:~$ /usr/bin/telnet localhost 9500
Trying 127.0.0.1...
Connected to localhost.
Escape character is '^]'.
22
+
22
=
42
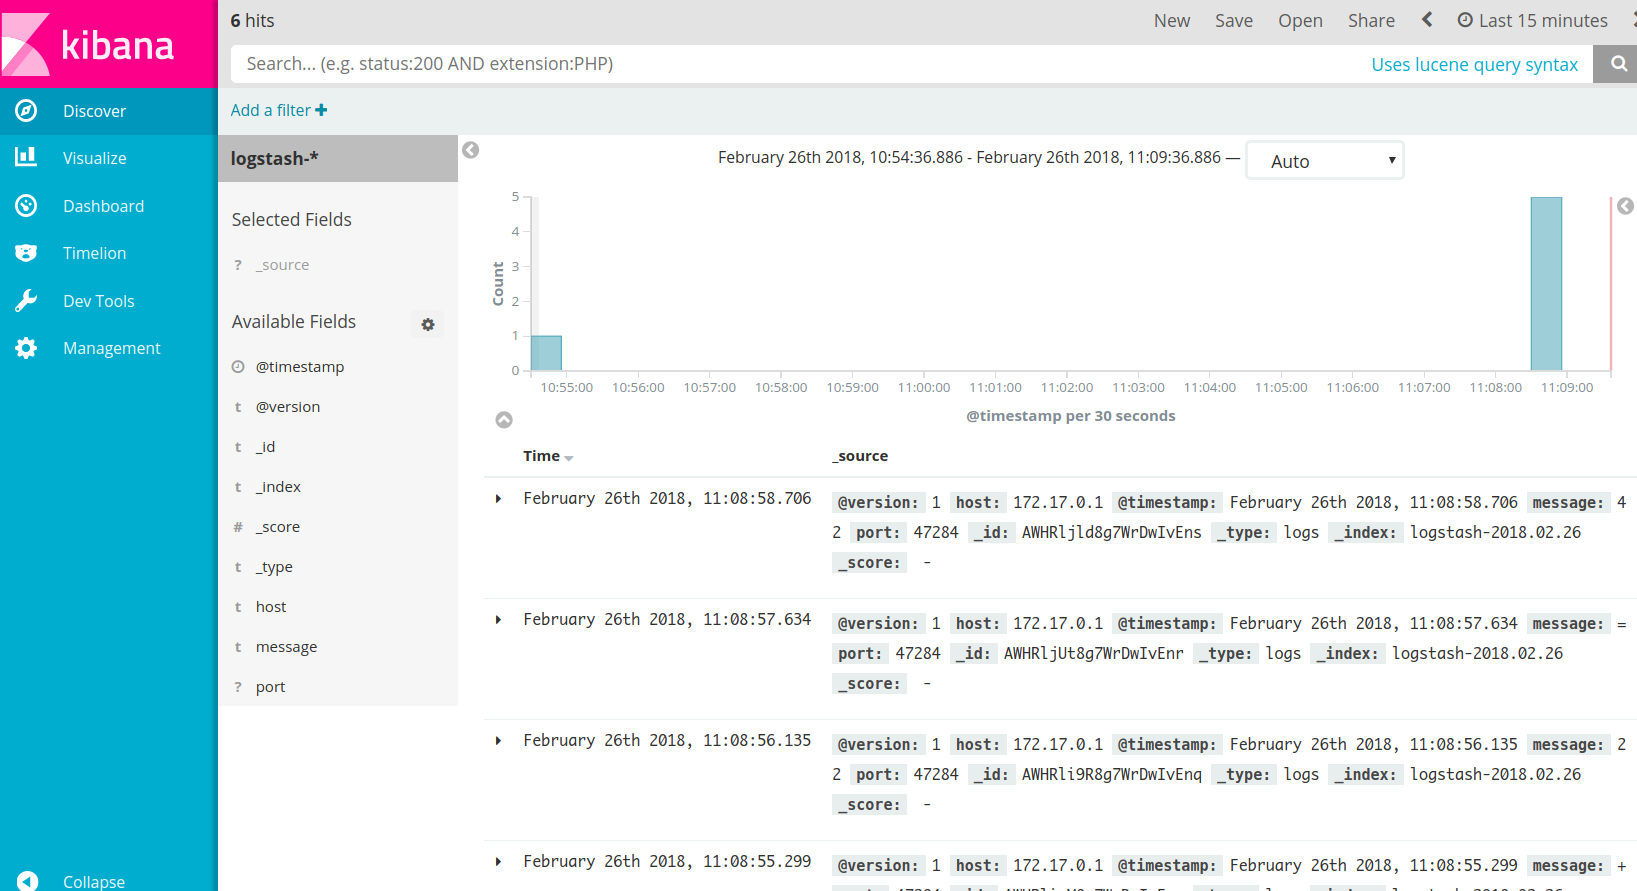
Here is the output on the dashboard:

Some info: In the terminology of Elastic search, "index" means "table", or "collection" while "index pattern" means "schema". Basically when you refresh the index pattern, Kibana looks at the fields within the index and makes them available for research.
Thanks to SLL for his help on Kibana!