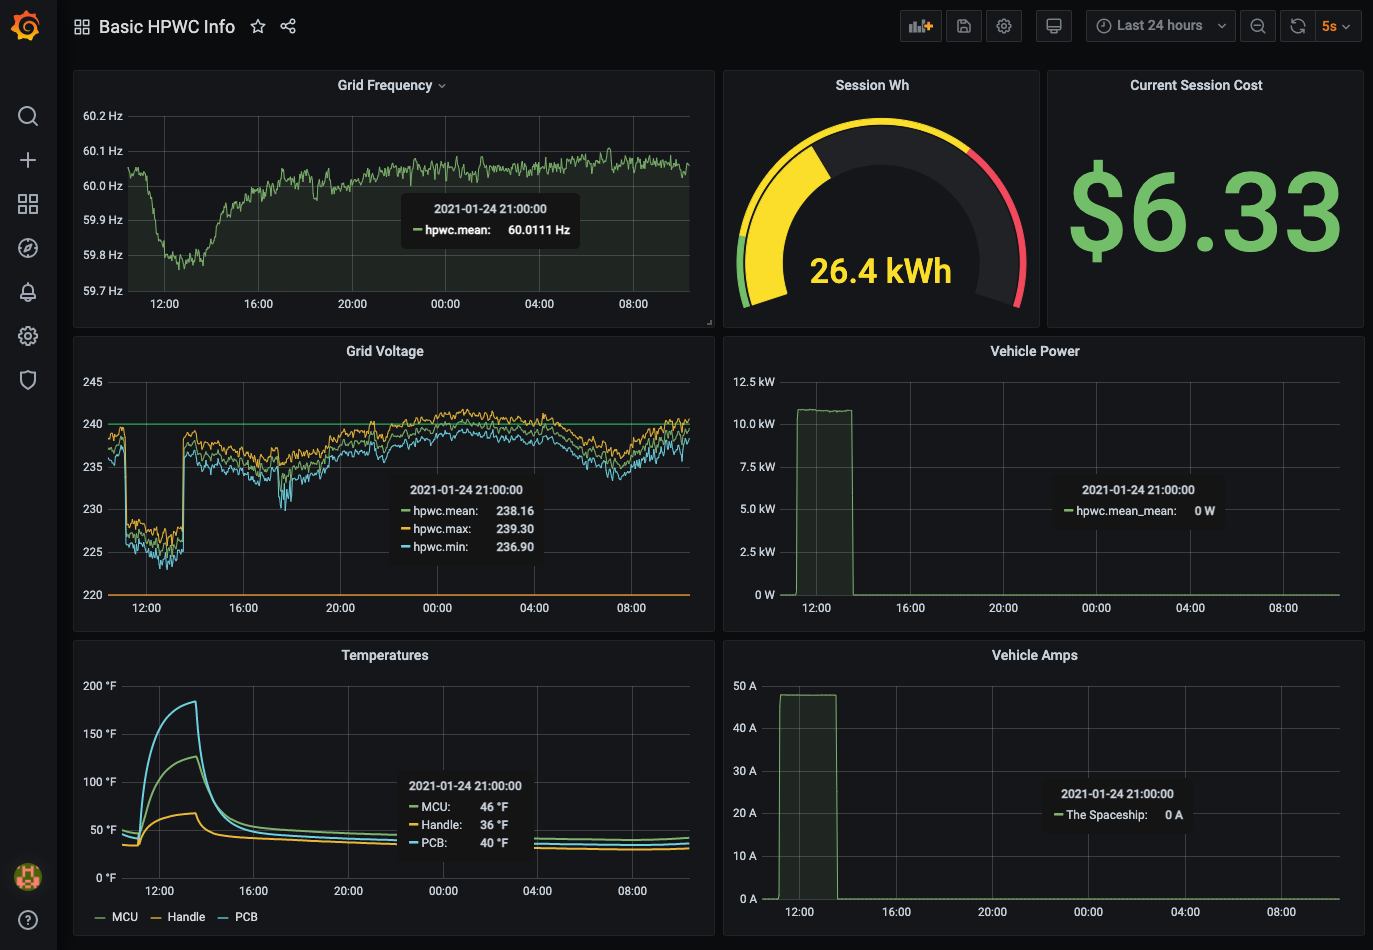
A simple all-in-one stack for tracking detailed metrics from a Tesla Gen 3 Wall Connector (a.k.a. HPWC) and visualizing the data. The real magic is polly, a Go-based API polling tool that converts JSON output from GETs to the HPWC to InfluxDB POSTs. We then visualize the data with Grafana.
A particularly fascinating detail I've learned about the Gen 3 HPWC is that it can deal with at least 10 samples per second, and it measures grid voltage and frequency with incredible accuracy: 4 significant digits for voltage, and 5 significant digits for grid frequency. It's like having a weathervane for your local electrical grid as a combo bonus with charging your car.
- You will need Docker Desktop 3.1+ installed to run containers.
- You will need a Tesla Gen 3 Wall Connector installed, provisioned, and joined to your home (or business) wifi.
- You will need to be able to reach the HPWC from whatever computer you run this stack on.
- If you stop docker desktop, you lose all your collected data.
- If you run
docker-compose down, same deal - you lose your collected data. - This software is very rough and is provided with no warranty.
- I do math in the Grafana dashboard to turn °C into °F. Can't help it, I grew up this way. You can change it back to °C by removing the
math()clause.
Right now, the setup process is manual and requires changing hard-coded values. It isn't pretty, but I hope to make it much simpler and automated in the future.
- Create two Docker volumes, one for each of the containers so they can persist some data:
docker volume create grafana-volume && docker volume create influxdb-volume. I believe you only need to do this once. - Supply the IP address of your Gen 3 Wall Connector as an env var:
export HPWC_IP="<your IP Address>". For example,export HPWC_IP="192.168.1.15". - Run
docker-compose upto pull and start all three containers (influxdb,grafana/grafana, andpolly). - Go to localhost:3000 and log in using the username
adminand passwordadmin. - Navigate to Configuration > Data Sources and click Add Data Source.
- Choose InfluxDB and populate the URL field with
http://<your host's ip>:8086, set Database toteslaand the user toadmin. - Click Save & Test, and you should see a success message in green.
- Navigate to Dashboards > Manage and click Import. Click Upload JSON File and at the dialog, supply
Basic HPWC Info Grafana Dashboard.jsonfrom this repository. - Ét violá!! Go check out your dashboard at http://localhost:3000/d/GqOd0wfGk/basic-hpwc-info
Note: You can accurately represent your local electrical cost by changing line 321 of the dashboard JSON from 0.24 (my cost per kWh) to whatever it is for you.
If you already have InfluxDB running in your environment and just just want to run the Gen 3 Wall Connector monitor in your terminal, it's pretty easy:
- Set both
HPWC_IPandINFLUX_IPas environment variables:export HPWC_IP="<your IP Address>" && export INFLUX_IP="<your IP Address>". For example,export HPWC_IP="192.168.1.5" && export INFLUX_IP="192.168.1.6" - Compile and run the main executable in one simple command:
go run main.go
This process depends on InfluxDB being reachable over http (not https!!) on port 8086 and having a database called tesla.
- Gen 3 WC finder: scans through the active subnet of the host (assuming a home network) and locates the HPWC(s), supplying the IP(s) as target(s) for
pollyto poll. - (deprecated) Setup Script: simple Q-and-A interactive script that does all the work and then spins up the stack.
- polly as Container: use env vars for endpoint addresses and run it in a vanilla container.
