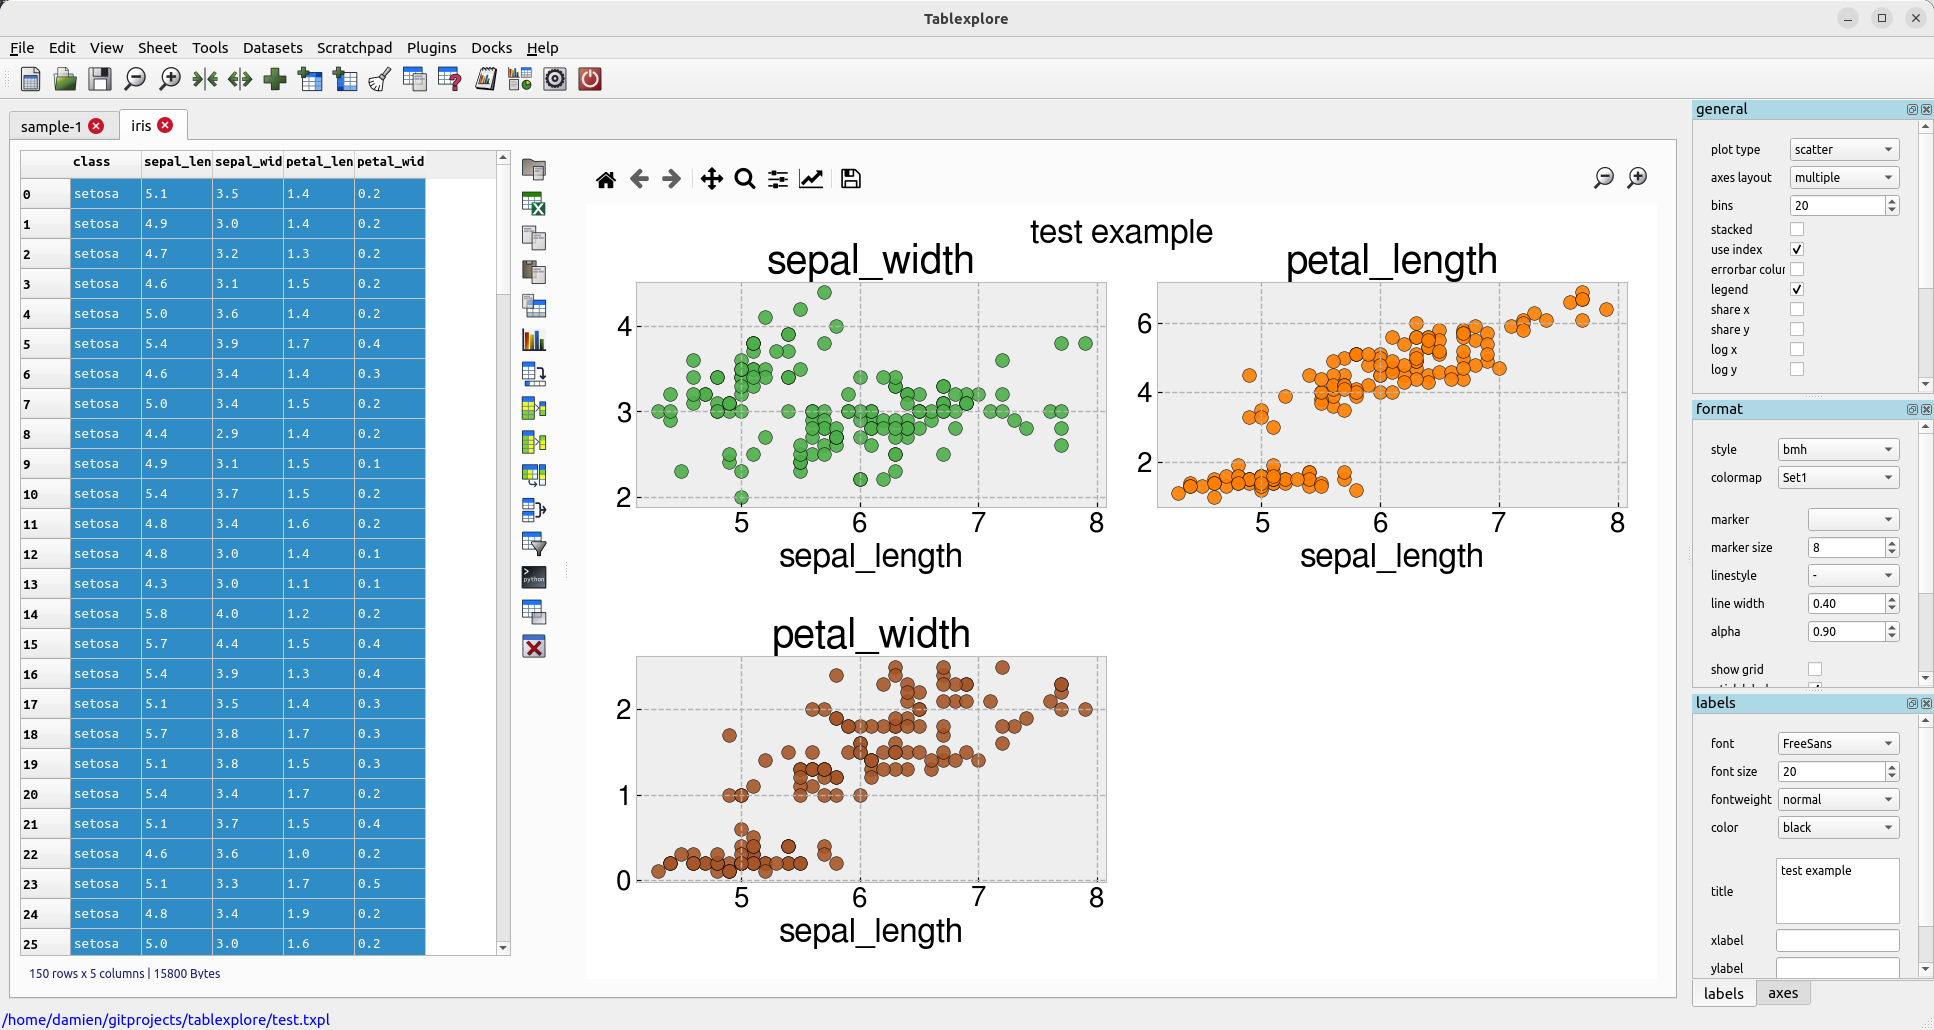
Tablexplore is an application for data analysis and plotting built in Python using the PySide2/Qt toolkit. It uses the pandas DataFrame class to store the table data. Pandas is an open source Python library providing high-performance data structures and data analysis tools.
This application is intended primarily for educational/scientific use and allows quick visualization of data with convenient plotting. The primary goal is to let users explore their tables interactively without any prior programming knowledge and make interesting plots as they do this. One advantage is the ability to load and work with relatively large tables as compared to spreadsheets. The focus is on data manipulation rather than data entry. Though basic cell editing and row/column changes are supported.
Clone the repository and start a virtual environment using Python 3.7
virtualenv venv --python=python3.7.4
venv/Scripts/activate
Install the dependencies. If while running the program you encounter dependency errors, try installing the dependencies manually using pip install <dependency>.
pip install .For all operating systems with Python and pip installed:
pip install -e git+https://github.com/dmnfarrell/tablexplore.git#egg=tablexplore
The pip method above should work fine for most distributions but if you prefer you can also try the AppImage (experimental). Download from the latest release page and run as follows:
chmod +x tablexplore-0.3.0-x86_64.AppImage
./tablexplore-0.3.0-x86_64.AppImage
There is also a snap available, which can be installed using:
snap install tablexplore
A Windows standalone binary can be downloaded here.
- save and load projects
- import csv/hdf/from urls
- delete/add columns
- groupby-aggregate/pivot/transpose/melt operations
- merge tables
- show sub-tables
- plotting mostly works
- apply column functions, resample, transform, string methods and date/time conversion
- python interpreter
See documentation
from PySide2 import QtCore
from PySide2.QtWidgets import *
from PySide2.QtGui import *
import pandas as pd
from tablexplore import data, core, plotting, interpreter

class TestApp(QMainWindow):
    def __init__(self, project_file=None, csv_file=None):

        QMainWindow.__init__(self)
        self.setAttribute(QtCore.Qt.WA_DeleteOnClose)
        self.setWindowTitle("Example")
        self.setGeometry(QtCore.QRect(200, 200, 800, 600))
        self.main = QWidget()
        self.setCentralWidget(self.main)
        layout = QVBoxLayout(self.main)
        df = data.getSampleData()
        t = core.DataFrameWidget(self.main,dataframe=df)
        layout.addWidget(t)
        #show a Python interpreter
        t.showInterpreter()
        return

if __name__ == '__main__':
    import sys
    app = QApplication(sys.argv)
    aw = TestApp()
    aw.show()
    app.exec_()

