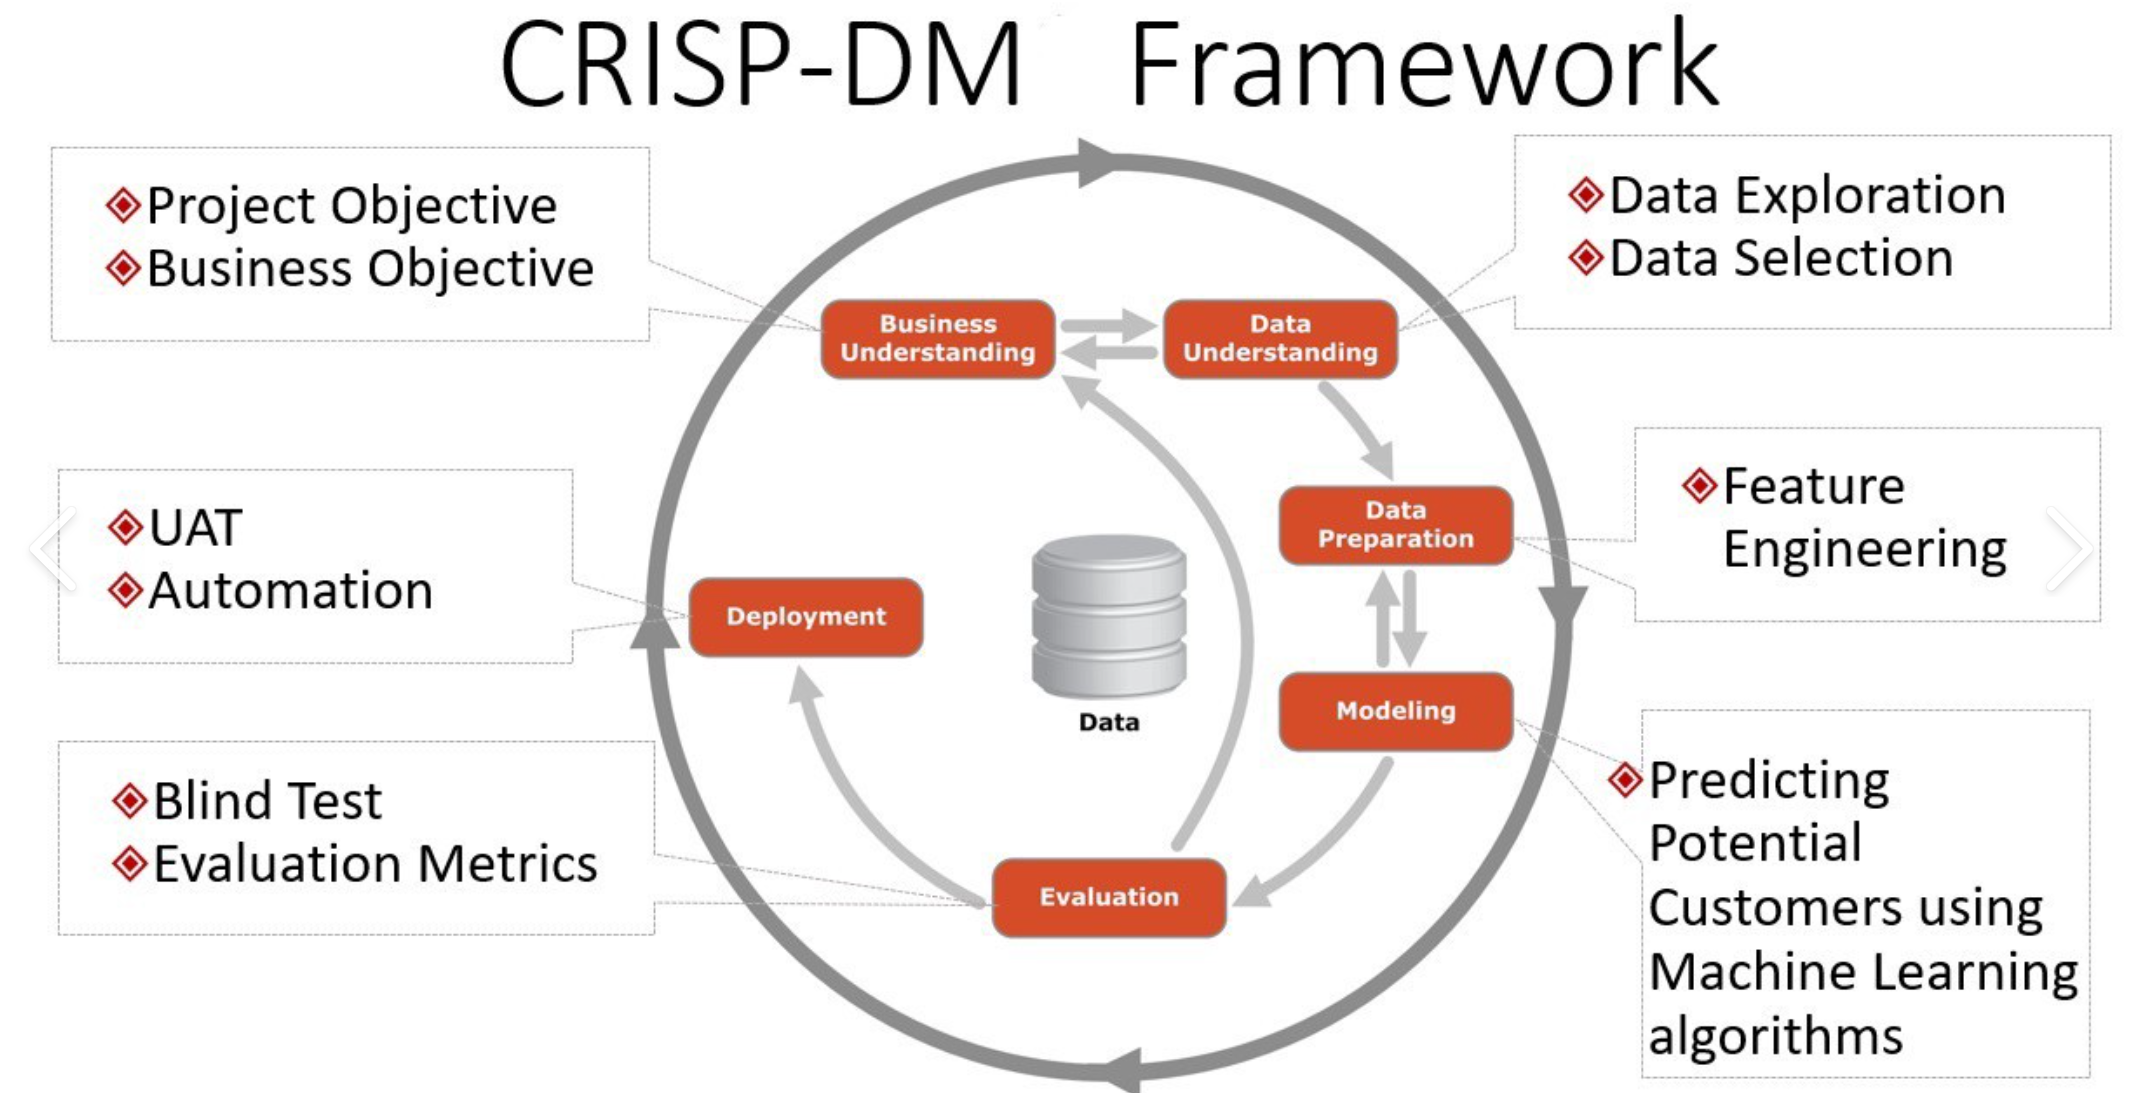
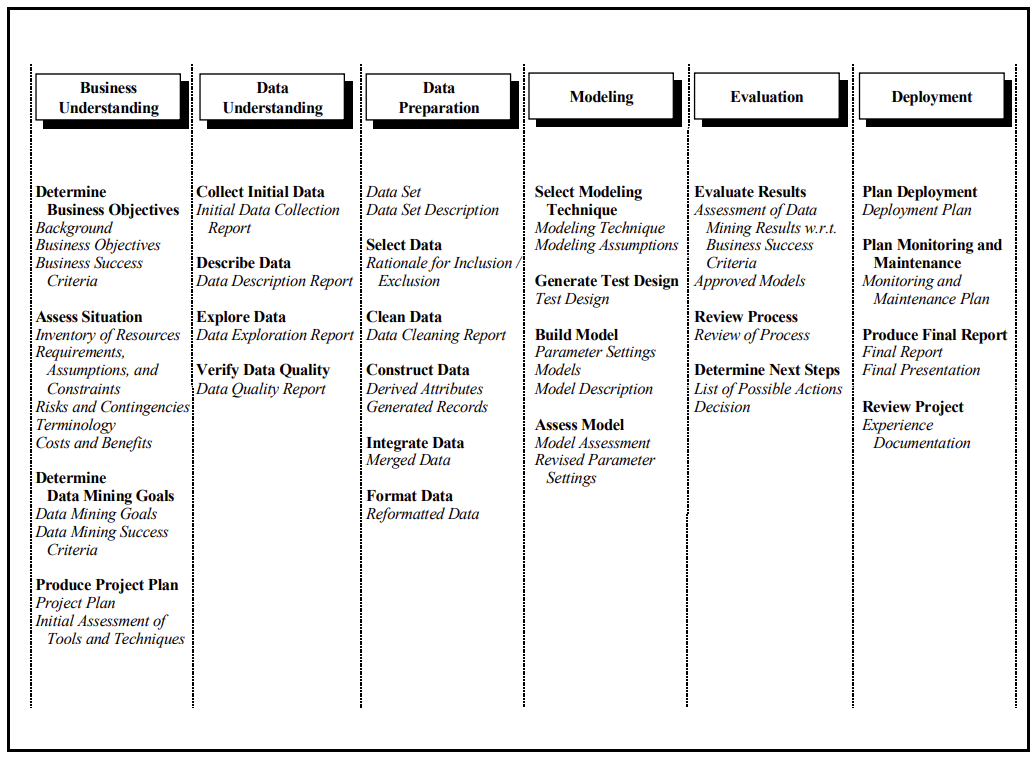
- This application makes use of CRISP-DM framework
- To frame the task, throughout our practical applications we will refer to a standard process in industry for data projects called CRISP-DM.
- This process provides a framework for working through a data problem.
- Our first step in this application will be to read through a brief overview of CRISP-DM here
- In this application, we will explore a dataset that contains information on 426880 used cars.
- Our goal is to understand what factors make a car more or less expensive.
- As a result of this analysis, we should be able to provide clear recommendations to our client -- a used car dealership -- as to what consumers value in a used car.
-
The data spans across ~27-yrs - from 1995 -2022
-
Also, the price range of all the vehicles is approximately bet ~ $8k-$39k with some outlier to be eliminated
-
The data has vehicles from all 51 states (50 states + Washington DC) in the US and 404 distinct regions
-
There are a total of 42 unique manufacturers in the data
-
There are a total of 29629 unique car models in the data
-
The condition of the vehicle is classified in 6 unique categories ('good', 'excellent', 'fair', 'like new', 'new', 'salvage')
-
There are a total of 8 unique cylinder types listed in the data ('8 cylinders', '6 cylinders', '4 cylinders', '5 cylinders', 'other', '3 cylinders', '10 cylinders', '12 cylinders')
-
There are a total of 5 unique fuel attributes listed in the data ('gas', 'other', 'diesel', 'hybrid', 'electric')
-
There are a total of 5 unique title statuses listed in the data ('clean', 'rebuilt', 'lien', 'salvage', 'missing', 'parts only')
-
There are a total of 3 unique types of transmission listed in the data ('other', 'automatic', 'manual')
-
There are a total of 265838 unique VINs (Vehicle Identification Numbers) listed in the data
-
There are a total of 3 unique dive-types are listed in the data ('rwd', '4wd', 'fwd')
-
There are a total of 4 unique vehicle sizes listed in the data ('full-size', 'mid-size', 'compact', 'sub-compact')
-
There are a total of 13 unique vehicle types listed in the data ('pickup', 'truck', 'other', 'coupe', 'SUV', 'hatchback', 'mini-van','sedan', 'offroad', 'bus', 'van', 'convertible', 'wagon')
-
There are a total of 12 unique paint colors listed in the data ('white', 'blue', 'red', 'black', 'silver', 'grey', 'brown', 'yellow', 'orange', 'green', 'custom', 'purple')
-
Majority of the columns except (id, region, price, and state) contained NULL values (NaN in data science terms)
-
The data required significant cleansing as well as inferring the NULL values through Imputation
- id              426880
- region          426880
- price           426880
- year            425675
- manufacturer    409234
- model           421603
- condition       252776
- cylinders       249202
- fuel            423867
- odometer        422480
- title_status    418638
- transmission    424324
- VIN             265838
- drive           296313
- size            120519
- type            334022
- paint_color     296677
- state           426880
- bronze = raw data (accessed by Data Analysts)
- silver = pre-processed data - (accesses by Data Engineers)
- gold = curated data - (accessed by Data Scientists or Statisticians)
- Get the raw data from - here
- Unzip the data into data/bronze folder and rename the file as "vehicles_raw.csv" for the notebooks to execute without any exceptions
- Please run the notebooks in exact sequence (1-4)
- The pre-processing step (data-preprocessing.ipynb) will progressively create two more data files in "data/silver" and "data/gold" folders
- At the end of step 3 (after the execution of model.ipynb), there will be 3 model .pkl files create in "models" folder
- We'll also notice "errors.csv" created in "data/gold" folder which contains the scores produced by the all the models (refer - score table below)
├── data
│    ├── bronze
|    |   ├── vehicles_raw.csv
│    ├── silver
|    |   ├── vehicles_silver.csv
|    ├── gold
|    |   ├── vehicles_gold.csv
|    |   ├── errors.csv
|
├── images
|    ├── all charts and sundry images
|
├── models
|    ├── RFRDeploy.pkl
|    ├── StandardScaler.pkl
|    ├── XGBoostDeploy.pkl
|
├── 1. data-preprocessing.ipynb
│   2. data-visualization.ipynb
|   3. models.ipynb
|   4. deployment.ipynb
|
├── presentation
|   ├── UsedCarDataMLSummary.pptx
Input: vehicles_raw.csv
Output: vehicles_silver.csv
Code Used: Python
Packages: Pandas, Numpy, Matplotlib, Seaborn
Input: vehicles_silver.csv
Output: vehicles_gold.csv

- IterativeImputer
- Estimators (BayesianRidge, DecisionTreeRegressor, ExtraTreesRegressor, KNeighborsRegressor)
- cross_val_score of calculated MSE
- Rationalization of # of rows and column expected

Rationalized Data points

- Shape before process = (426880, 18)
- Shape After process = (364420, 16)
- Total 62460 rows and 2 columns were removed
- Label Encoding of categorical variables to transform into numerical values
- The dataset is not normally distributed
- sklearn library (MinMaxScaler)
- train_test_split (Train = 90% - Test = 10%)
Input: vehicles_gold.csv
Output: Model

- 1) Linear Regression
- 2) Ridge Regression
- 3) Lasso Regression
- 4) K-Neighbors Regression
- 5) Random Forest Regression
- 6) Bagging Regression
- 7) Adaboost Regression
- 8) XGBoost Regression
- Provide the following input variables to - predict the price of the best used vehicle
- paint_color, manufacturer, year, transmission, cylinders, size, fuel, condition, drive, type, odometer
- The resultant model can be deployed as a docker container and orchestrated on Kubernetes cluster
- The advantage of this approach is - we can orchestrate different versions of the models in different Kubernetes PODS
- It also acts as a solutiona accelerator for other used car dealer and hence the solution becomes repeatable
- A Powerpoint presentation is included to explain the entire process in "Presentation" directory.
- By performing different Machine Learning models, we aimed to get a better result or less error with max accuracy.
- Our purpose was to predict the price of the used cars with the help of multiple predictors for 364420 unique samples.
- Initially, data cleaning was performed to remove the null values (NaN) and outliers from the dataset.
- Next, the data visualization features were explored deeply to examine the correlation between the features.
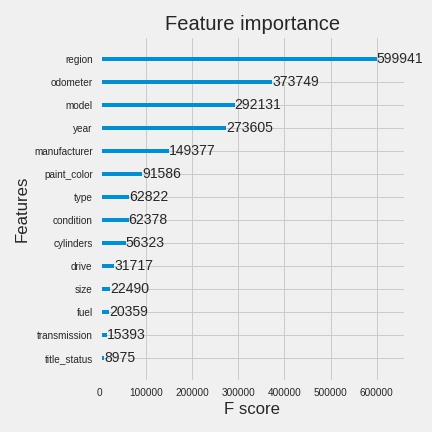
- Subsequently, Machine Learning models were implemented to predict feature importance and the price of car for a given customer preference.
- From the table below, Random Forest, AdaBoost, and XGBoost are the best models for the prediction of the used car prices.
- We chose 2 out of 3 best models and deployed Random Forest and XGBoost in production.
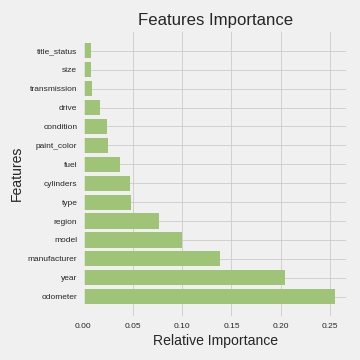
- AdaBoost - Odometer, Year, Manufacturer
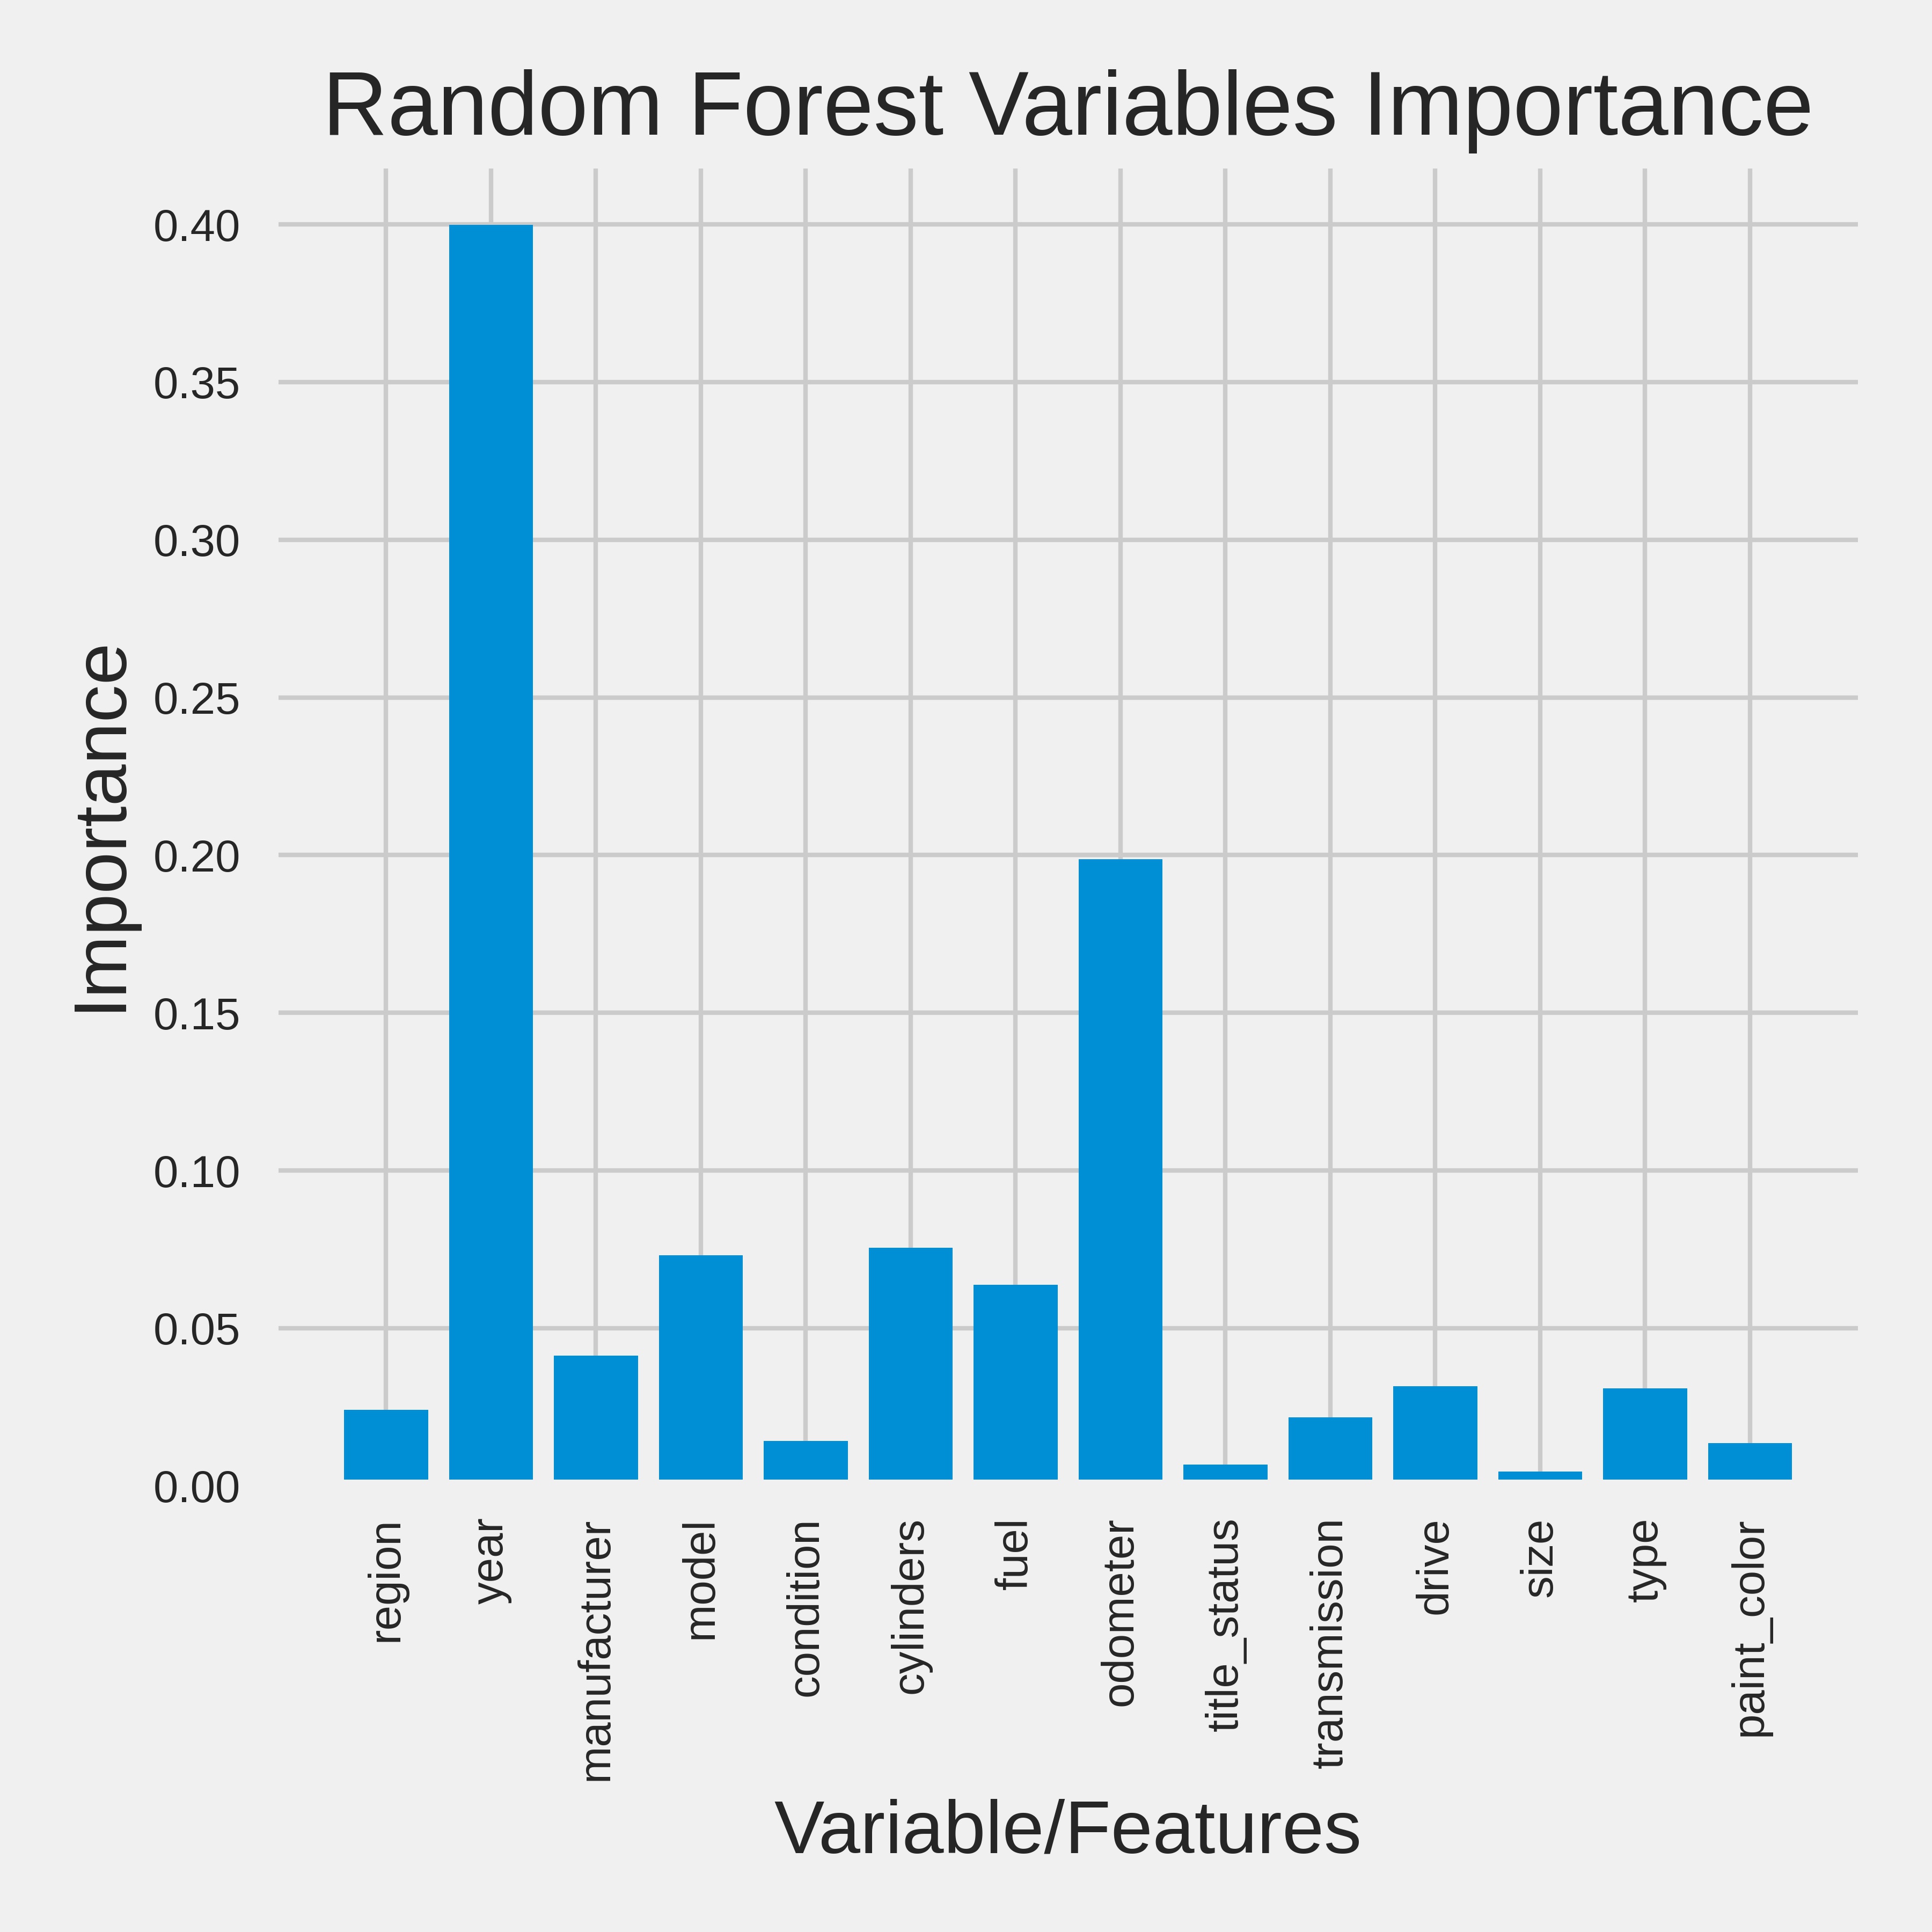
- Random Forest - Year, Cylinder, Odometer
- XGBoot - Odometer, Model, Year
- In this analysis we tried to understand what influences used car's selling price.
- Based on the R2 score - all 3 models suggest "Year" and "Odometer" are the most important features that contributes to the model.
- The dealership should focus on these two features for their marketing campaign to maximize the sell and profit.
- Older cars with low Odometer yield better value for money for the customers.
- Effectively, focusing on these two features is a win-win situation for both - the dealership and the customers.
