Abigail Watson
MSBI 32400 – Final Project
Call variants on Pevsner autism bam (Web Document 9.7 at http://www.bioinfbook.org/php/ then annotate with snpEff + Clinvar and upload to VEP for ExAC population frequencies. Compare variants in the 101 target gene list with ExAC frequencies expected autism frequencies. Use hg19.fa (see below), not Pevsner's WebDocument_9-6_101autism.fa. Use CDC 2016 frequencies: https://www.cdc.gov/ncbddd/autism/
To understand the genetic factors contributing to Autism Spectrum Disorder, we first begin looking at phenotype expression, which we can obtain from the Centers of Disease Control. The difficulty in doing so is that the CDC reports that the prevalence of Autism has been increasing over the past few decades. In the Surveillance Year 2000, it was reported that 1 in 150 children who were born in 1992 were diagnosed with autism (0.6%); whereas in 2012, the numbers had increased to 1 in 68 children who were born in 2004 were diagnosed with autism (1.47%). This presents a few hypotheses:
A. Autism is increasing in the general population.
A1. Environmental factors such as pesticides and plastics are causing an increase in Autism.
A2. Autism is a side effect of some other benefitial process, such as change in diet.
B. The reportng process is including more autisitc children.
B1. The screening process for diagnosing autistic children is becoming better at detecting autism.
B2. The definition of autism has changed and become more general.
We also note that parents who have a child with ASD have a 2%–18% chance of having a second child who is also affected, which suggests a recessive trait since it's a less than 1/4. ASD tends to occur more often in people who have certain genetic or chromosomal conditions, indicating involvement in a gene network (to be expected for behavioral and psychiatric disorders). Children born to older parents are at a higher risk for having ASD, indicating that ASD is a common symptom of mutations in the germ line. ASD commonly co-occurs with other developmental, psychiatric, neurologic, chromosomal, and genetic diagnoses in 83% of the cases; again suggesting ASD is a common symptom of regulatory pathway disfunction.
Note: These instructions are for a Mac. Please adjust use of wget/curl and compiled binaries accordingly.
# Install the twoBitToFa utility
wget http://hgdownload.cse.ucsc.edu/admin/exe/linux.x86_64/twoBitToFa
mv ~/Downloads/twoBitToFa msbi-32400-final-project/bin
cd msbi-32400-final-project/bin
chmod +x twoBitToFa


# Download and install samtools
wget https://github.com/samtools/samtools/releases/download/1.3.1/samtools-1.3.1.tar.bz2
mv ~/Downloads/samtools-1.3.1.tar.bz2  msbi-32400-final-project/src
cd msbi-32400-final-project/src
gunzip samtools-1.3.1.tar.bz2
tar -xzvf samtools-1.3.1.tar
cd samtools-1.3.1
make
make ../../bin/samtools install


# Download and install bcftools
wget https://github.com/samtools/bcftools/releases/download/1.3.1/bcftools-1.3.1.tar.bz2
mv ~/Downloads/bcftools-1.3.1.tar.bz2  msbi-32400-final-project/src
cd msbi-32400-final-project/src
gunzip bcftools-1.3.1.tar.bz2
tar -xzvf bcftools-1.3.1.tar
cd bcftools-1.3.1
make
make ../../bin/bcftools install


# Install the Burrows-Wheeler Aligner tool
wget https://sourceforge.net/projects/bio-bwa/files/bwa-0.7.15.tar.bz2
mv ~/Downloads/bwa-0.7.15.tar.bz2  msbi-32400-final-project/src
cd msbi-32400-final-project/src
gunzip bwa-0.7.15.tar.bz2
tar -xzvf bwa-0.7.15.tar.bz2
cd bwa-0.7.15
make
mv ./bwa ../../bin

# Download and install SnpEff
wget http://sourceforge.net/projects/snpeff/files/snpEff_latest_core.zip
mv ~/Downloads/snpEff_latest_core.zip  msbi-32400-final-project/src
cd msbi-32400-final-project/src
unzip snpEff_latest_core.zip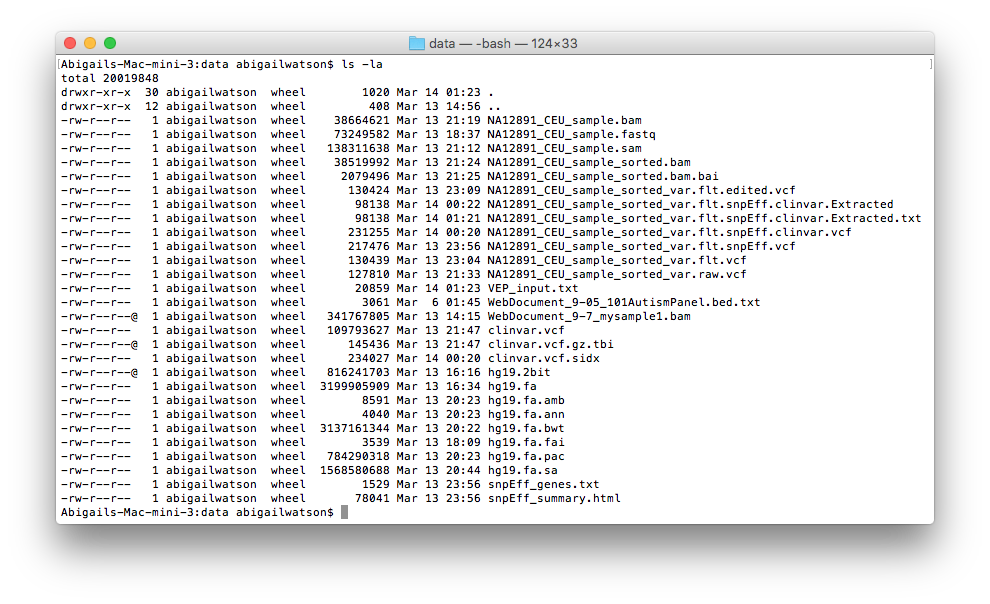
mv snpEff ../bin The following data files were used for this assignment.
# Download the complete hg19 Human Genome in the 2bit format
wget http://hgdownload.soe.ucsc.edu/goldenPath/hg19/bigZips/hg19.2bit
mv ~/Downloads/hg19.2bit msbi-32400-final-project/data

# Download and install gene USH2A from Vince Buffalo Chapter 11
git clone https://github.com/vsbuffalo/bds-files
cp ~/Downloads/bds-files/chapter-11-alignment/NA12891_CEU_sample.bam msbi-32400-final-project/data

# Get the Feb 2017 ClinVar VCF file
wget ftp://ftp.ncbi.nlm.nih.gov/pub/clinvar/vcf_GRCh37/clinvar.vcf.gz
wget ftp://ftp.ncbi.nlm.nih.gov/pub/clinvar/vcf_GRCh37/clinvar.vcf.gz.tbi
mv ~/Downloads/clinvar.vcf.gz* msbi-32400-final-project/data

# Download Autism BAM File
# http://www.bioinfbook.org/php/C9E3k
cd data
wget http://www.bioinfbook.org/wiley/3e/chapter9/WebDocument_9-7_mysample1.bam
mv ~/Downloads/WebDocument_9-7_mysample1.bam msbi-32400-final-project/data The following steps are necessary for all data pipelines (single gene, screening panel, personalized medicine).
# Convert the raw Human Genome data (hg19.2bit) into a .fa file
cd msbi-32400-final-project
./bin/twoBitToFa ./data/hg19.2bit ./data/hg19.fa

# Index the hg19 Human Genome with SAMTools; this will produce our .fai file
cd msbi-32400-final-project
bin/samtools/bin/samtools faidx data/hg19.fa # Create our fastq file
cd msbi-32400-final-project
bin/samtools/bin/samtools fastq data/NA12891_CEU_sample.bam > data/NA12891_CEU_sample.fastq
# Use the Burrows-Wheeler Aligner to generate our SAM file
cd msbi-32400-final-project
bin/bwa index -a bwtsw data/hg19.fa
bin/bwa mem -R '@RG\tID:MSBI32400_Abigail_Watson_final_project\tSM:NA12891_CEU_sample' data/hg19.fa data/NA12891_CEU_sample.fastq > data/NA12891_CEU_sample.sam
# view, sort, and index all the things
bin/samtools/bin/samtools view -bt data/hg19.fai data/NA12891_CEU_sample.sam > data/NA12891_CEU_sample.bam
bin/samtools/bin/samtools sort -o data/NA12891_CEU_sample_sorted.bam data/NA12891_CEU_sample.bam
bin/samtools/bin/samtools index data/NA12891_CEU_sample_sorted.bam
bin/samtools/bin/samtools view -H data/NA12891_CEU_sample_sorted.bam
# Generate mpileup & run bcftools
bin/samtools/bin/samtools mpileup -uf data/hg19.fa data/NA12891_CEU_sample_sorted.bam | bin/bcftools call -mv > data/NA12891_CEU_sample_sorted_var.raw.vcf
bin/bcftools filter -s LowQual -e "%QUAL<20" data/NA12891_CEU_sample_sorted_var.raw.vcf > data/NA12891_CEU_sample_sorted_var.flt.vcf
# Count the lines
more data/NA12891_CEU_sample_sorted_var.flt.vcf | grep 'chr1' | wc -l # 756
more data/NA12891_CEU_sample_sorted_var.flt.vcf | grep 'PASS' | wc -l # 686 - without the "PASS" in the header
# Analyze with snpEff + Clinvar Feb 2017
cd msbi-32400-final-project/data
java -Xmx4g -jar ../bin/snpEff/snpEff.jar eff -v -d -canon -noLog hg19 NA12891_CEU_sample_sorted_var.flt.vcf > NA12891_CEU_sample_sorted_var.flt.snpEff.vcf
java -Xmx2G -jar ../bin/snpEff/SnpSift.jar annotate -noLog clinvar.vcf.gz NA12891_CEU_sample_sorted_var.flt.snpEff.vcf > NA12891_CEU_sample_sorted_var.flt.snpEff.clinvar.vcf
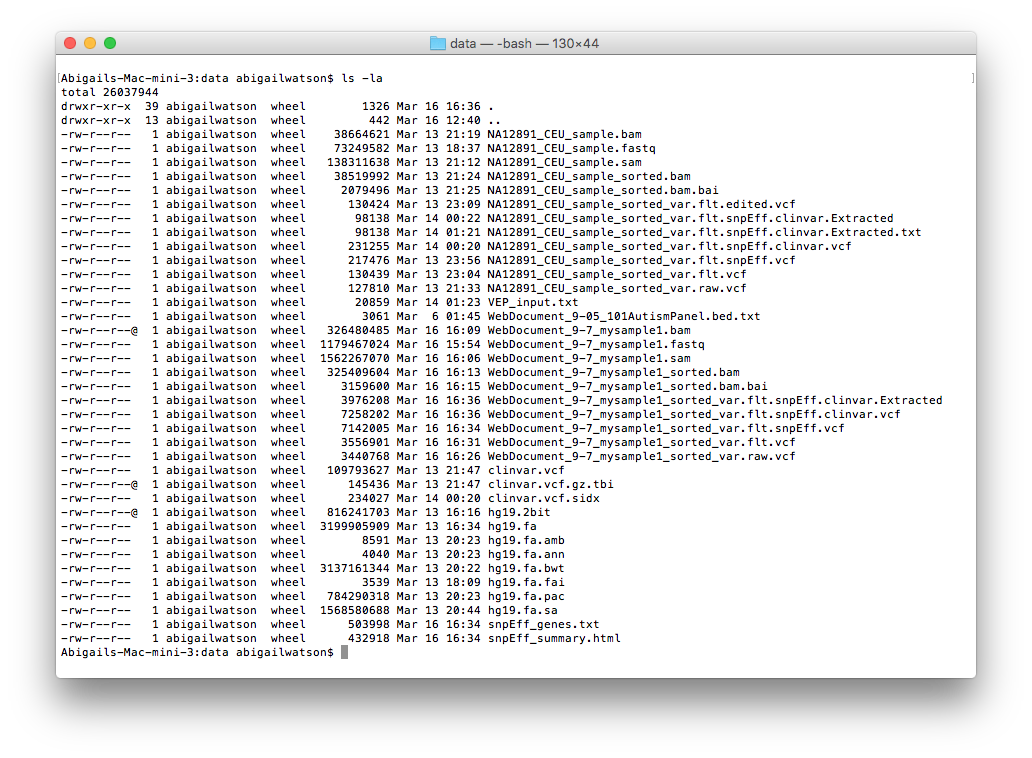
java -Xmx2G -jar ../bin/snpEff/SnpSift.jar extractFields -s ',' -e '.' NA12891_CEU_sample_sorted_var.flt.snpEff.clinvar.vcf CHROM POS REF ALT ID "ANN[*].ALLELE" "ANN[*].EFFECT" "ANN[*].IMPACT" "ANN[*].GENE" "ANN[*].FEATURE" "ANN[*].FEATUREID" "ANN[*].BIOTYPE" "ANN[*].RANK" "ANN[*].HGVS_C" "ANN[*].HGVS_P" CLNHGVS CLNALLE CLNACC CLNSIG CLNREVSTAT CLNDBN > NA12891_CEU_sample_sorted_var.flt.snpEff.clinvar.ExtractedResulting files after the pipeline was completed:
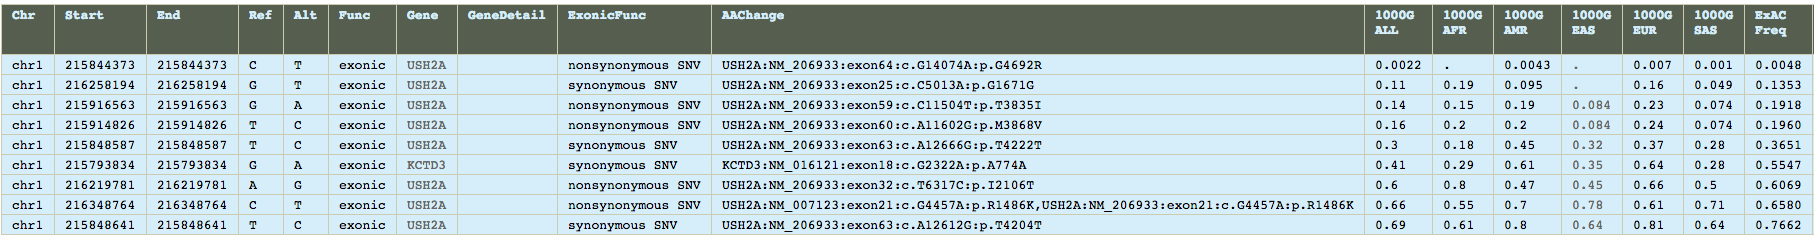
After running the data analysis pipeline, we have have a VCF file that we can upload into ANNOVAR and VEP. Annovar has consistently provided more reliable in my experience, so analysis begun there. Of particular interest is that the exome summary results are narrowed down to only 9 single necleotide polymorphisms. Furthermore, sorting by ExAC Frequency, and we see that 8 of the 9 SNPs are present in 13% or more of the population, with three of them being present in over half the human population. However, one of them, rs45549044, is present in only 0.0043% of the population, which is very close the observed prevelance of 0.006% that the CDC recorded in the year 2000. And while it's noted as being non-pathogenic, it is the only variant that warrents a COSMIC ID, which happens to be COSM1338810.
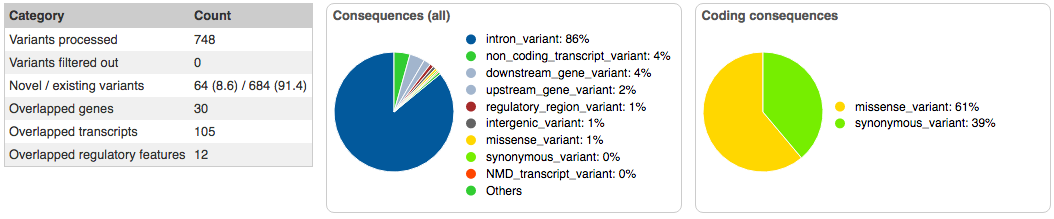
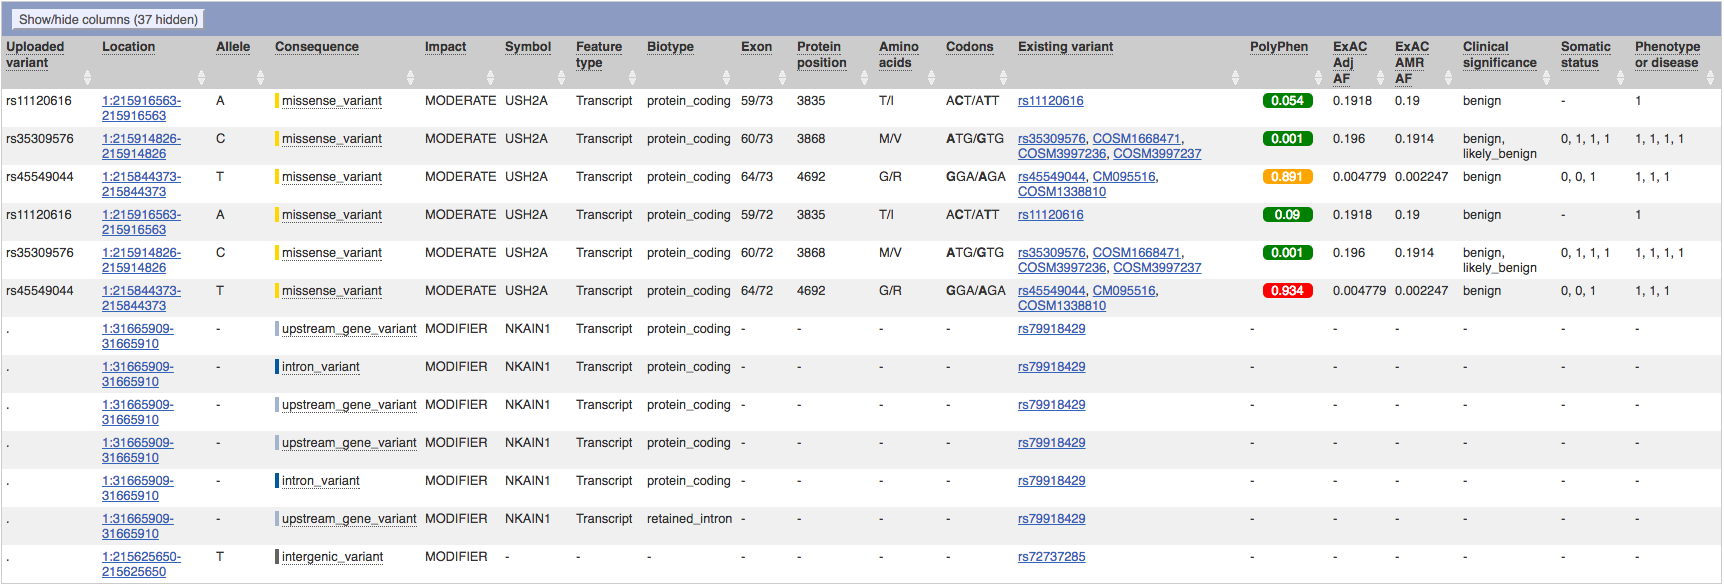
Running the VCF file through the Varient Effect Predictor failed the first half-dozen tries. Eventually, a result was achieved that identified six variants of interest on three SNPs:
rs11120616
rs35309576
rs45549044
Furthermore, not only only did VEP also identify rs45549044 as having moderate impact, it's PolyPhen score was 0.934, indicating that it is a probably damaging varient.
Using the example BAM from chapter 11 of the Vince Buffalo book, we confirm the VEP pipeline identifies genes and SNPs of interest. In this case, we identify USH2A, which is located on Chromsome 1 at 1q41, encodes the protein Usherin, and which is involved in hearing and vision.
GAATCTATAAAAGATGTTGAGCTTC[C/T]GTTATAGATTAGGACTGGATTGGAT
Chromosome: 1:215671031
Gene:USH2A (GeneView)
Functional Consequence: missense
Clinical significance: Benign
Validated: by 1000G,by cluster,by frequency
Global MAF:T=0.0022/11
HGVS: NC_000001.10:g.215844373C>T, NC_000001.11:g.215671031C>T, NG_009497.1:g.757366G>A, NM_206933.2:c.14074G>A, NP_996816.2:p.Gly4692Arg
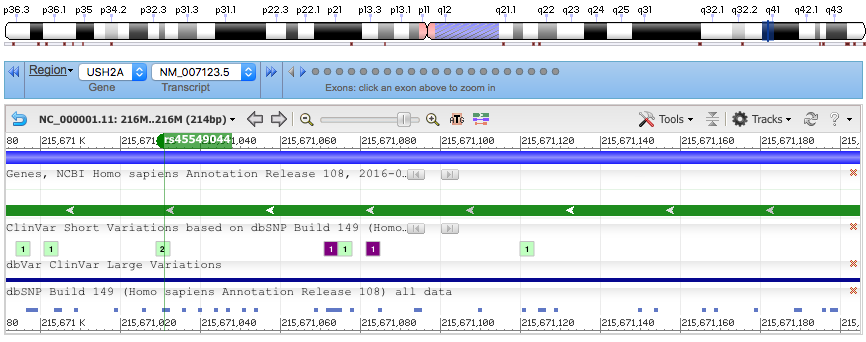
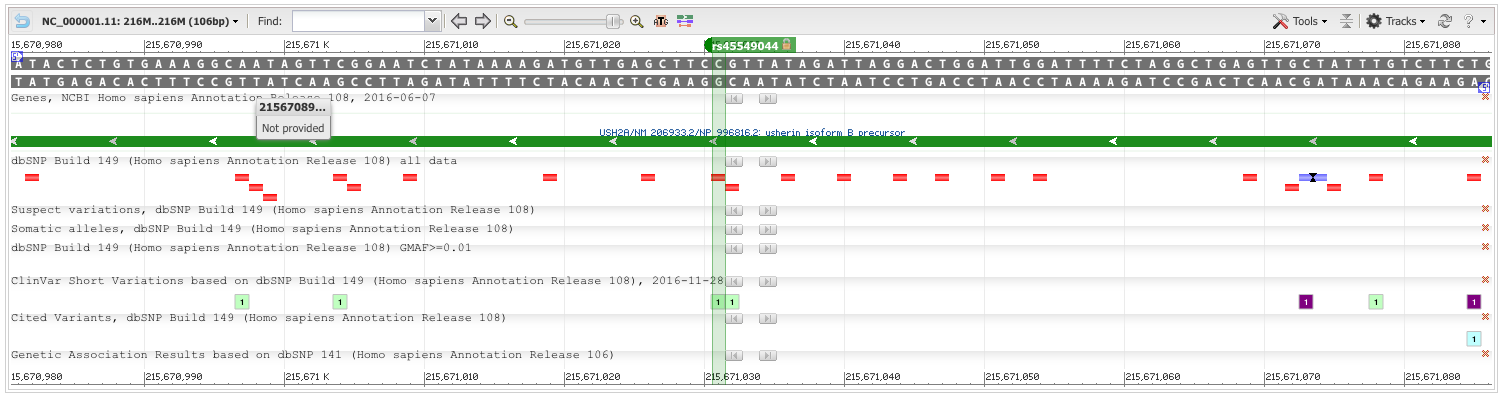
Interestingly, mutations on the rs45549044 SNP associated with USH2A are associated with carcinomas of the large intestine. Which means that people diagnosed with ASD may want to undergo the Autism Screening Panel to screen for colon cancer.
We use Pevsner's Austism Panel and the NCBI Ideogram drawer to visualize the 101 genome markers recommended for an Autism Screening Panel. Such visualizations are important in personalized medicine endeavors, to allow clinicians and patients to navigate the genome and understand how a person's genetic profile compares to known biomarkers for clinical conditions.
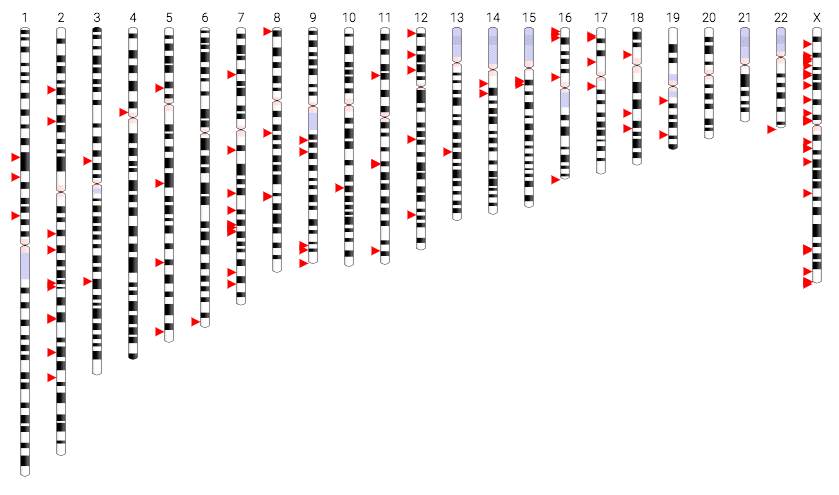
After running through this assignment, an article from Pychology Today entitled Harvard Study Finds Genetic 'Toggle Switch' for Sociability ran across my Facebook feed; which detailed the role of UBE3A in downregulating a glutamate based synapse organizer called CBLN1. I had just ran Pevsner's Autism Panel through the NCBI Ideogram tool; so I took a peek at the screening panel to see if UBE3A was in there. Sure enough, there it was. So then it occurred to me that maybe I should try running the entire Autism Panel against the the hg19 Human Genome. Because that would be pretty cool.
But where to get the BAM file for the entire Autism Panel? And that's when I remembered that I had used the NA12891_CEU_sample file from Chapter 11, but I hadn't used the WebDocument_9-7_mysample1.bam file.
# Create our fastq file
cd msbi-32400-final-project
bin/samtools/bin/samtools fastq data/WebDocument_9-7_mysample1.bam > data/WebDocument_9-7_mysample1.fastq

# Use the Burrows-Wheeler Aligner to generate our SAM file
cd msbi-32400-final-project
bin/bwa index -a bwtsw data/hg19.fa
bin/bwa mem -R '@RG\tID:MSBI32400_Abigail_Watson_final_project\tSM:WebDocument_9-7_mysample1' data/hg19.fa data/WebDocument_9-7_mysample1.fastq > data/WebDocument_9-7_mysample1.sam

# view, sort, and index all the things
bin/samtools/bin/samtools view -bt data/hg19.fai data/WebDocument_9-7_mysample1.sam > data/WebDocument_9-7_mysample1.bam
bin/samtools/bin/samtools sort -o data/WebDocument_9-7_mysample1_sorted.bam data/WebDocument_9-7_mysample1.bam
bin/samtools/bin/samtools index data/WebDocument_9-7_mysample1_sorted.bam
bin/samtools/bin/samtools view -H data/WebDocument_9-7_mysample1_sorted.bam

# Generate mpileup & run bcftools
bin/samtools/bin/samtools mpileup -uf data/hg19.fa data/WebDocument_9-7_mysample1_sorted.bam | bin/bcftools call -mv > data/WebDocument_9-7_mysample1_sorted_var.raw.vcf
bin/bcftools filter -s LowQual -e "%QUAL<20" data/WebDocument_9-7_mysample1_sorted_var.raw.vcf > data/WebDocument_9-7_mysample1_sorted_var.flt.vcf

# Count the lines
more data/WebDocument_9-7_mysample1_sorted_var.flt.vcf | grep 'chr1' | wc -l     # 11179 !
more data/WebDocument_9-7_mysample1_sorted_var.flt.vcf | grep 'PASS' | wc -l     # 14525 !

# Analyze with snpEff + Clinvar Feb 2017
cd msbi-32400-final-project/data
java -Xmx4g -jar ../bin/snpEff/snpEff.jar eff -v -d -canon -noLog hg19 WebDocument_9-7_mysample1_sorted_var.flt.vcf > WebDocument_9-7_mysample1_sorted_var.flt.snpEff.vcf

java -Xmx2G -jar ../bin/snpEff/SnpSift.jar annotate -noLog clinvar.vcf WebDocument_9-7_mysample1_sorted_var.flt.snpEff.vcf > WebDocument_9-7_mysample1_sorted_var.flt.snpEff.clinvar.vcf
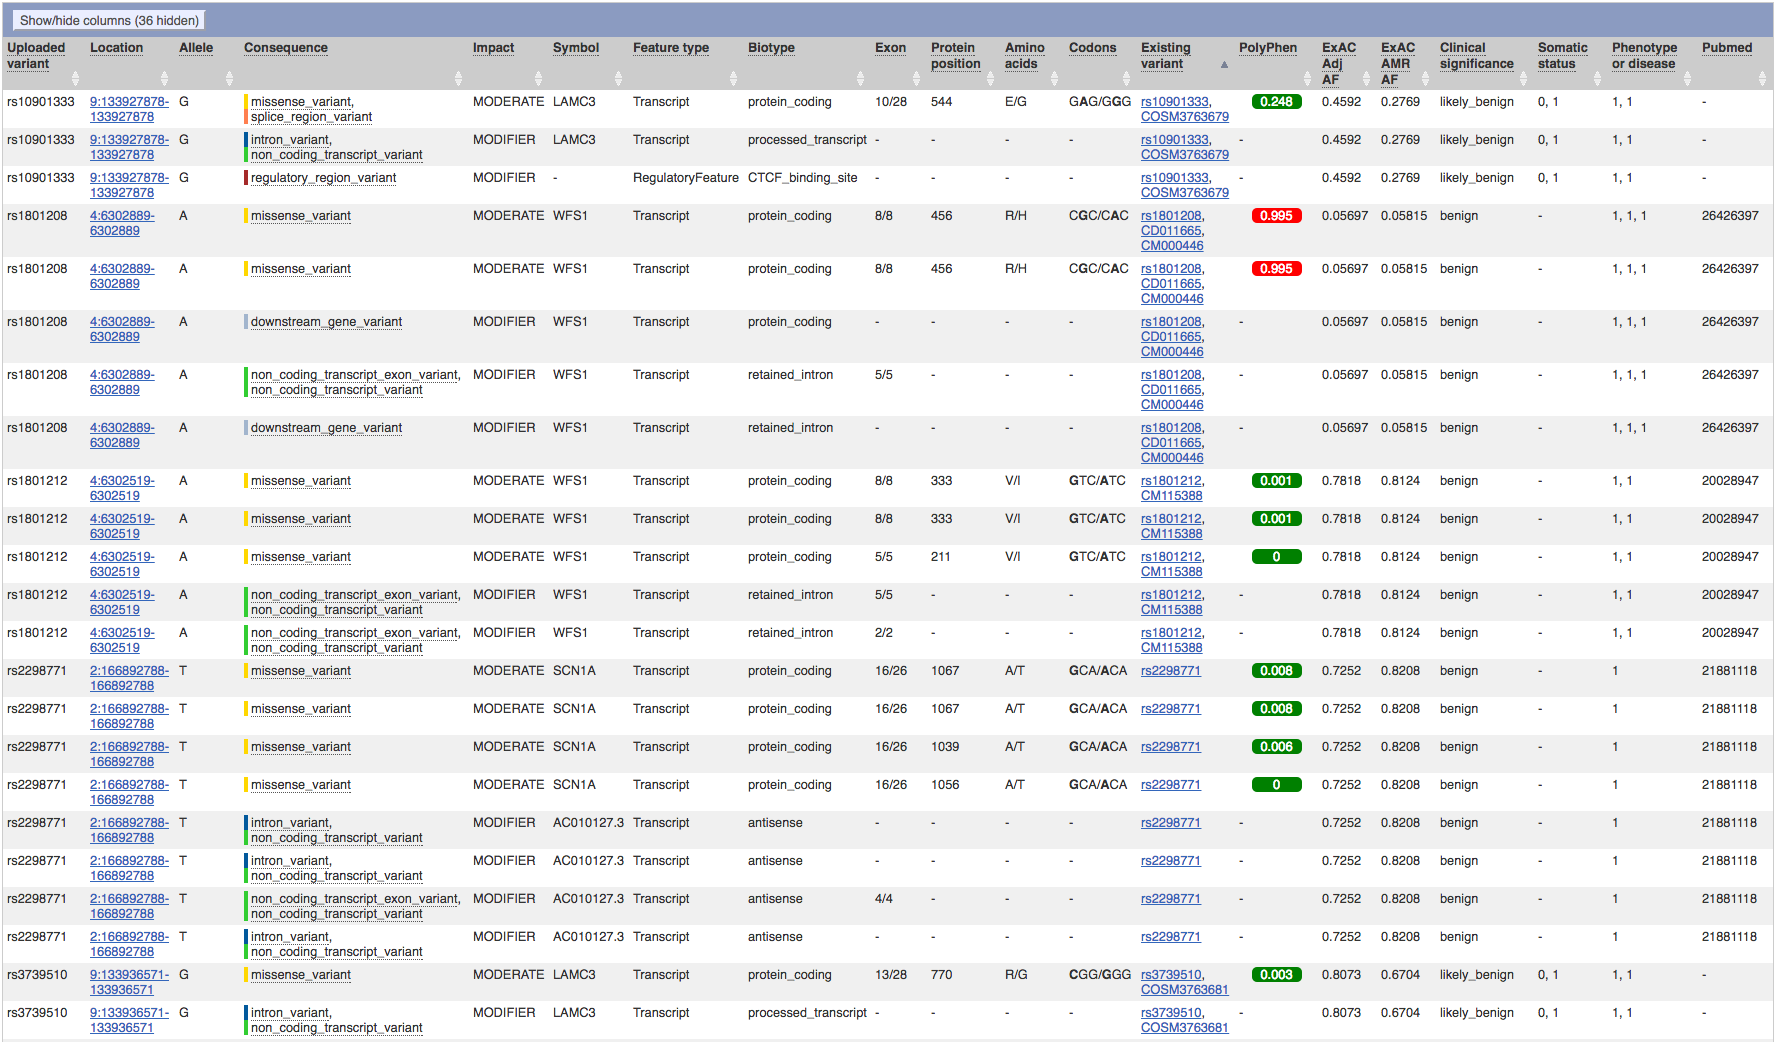
java -Xmx2G -jar ../bin/snpEff/SnpSift.jar extractFields -s ',' -e '.' WebDocument_9-7_mysample1_sorted_var.flt.snpEff.clinvar.vcf CHROM POS REF ALT ID "ANN[*].ALLELE" "ANN[*].EFFECT" "ANN[*].IMPACT" "ANN[*].GENE" "ANN[*].FEATURE" "ANN[*].FEATUREID" "ANN[*].BIOTYPE" "ANN[*].RANK" "ANN[*].HGVS_C" "ANN[*].HGVS_P" CLNHGVS CLNALLE CLNACC CLNSIG CLNREVSTAT CLNDBN > WebDocument_9-7_mysample1_sorted_var.flt.snpEff.clinvar.ExtractedFor the second run, we now have the the AutismPanel aligned, indexed, sorted, piledup, and analyzed.
After numerous runs, the best result I could get had two dozen results, covering only 3 genes from the original list of 101 Autism Screening Panel.
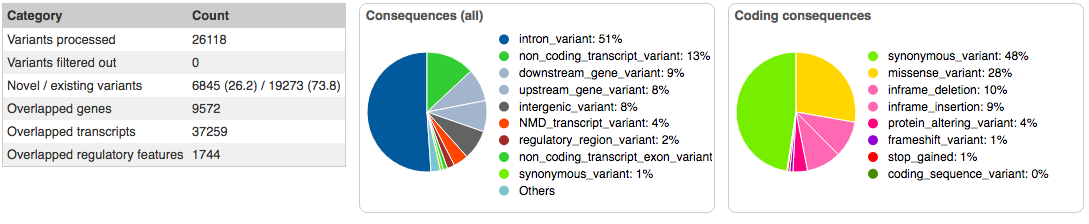
These genes were LAMC3, WFS1, and SCN1A, which are associated with the following proteins and macromolecules:
- WFS1 - wolframin ER transmembrane glycoprotein
- LAMC3 - laminin subunit gamma 3
- SCN1A - sodium voltage-gated channel alpha subunit 1
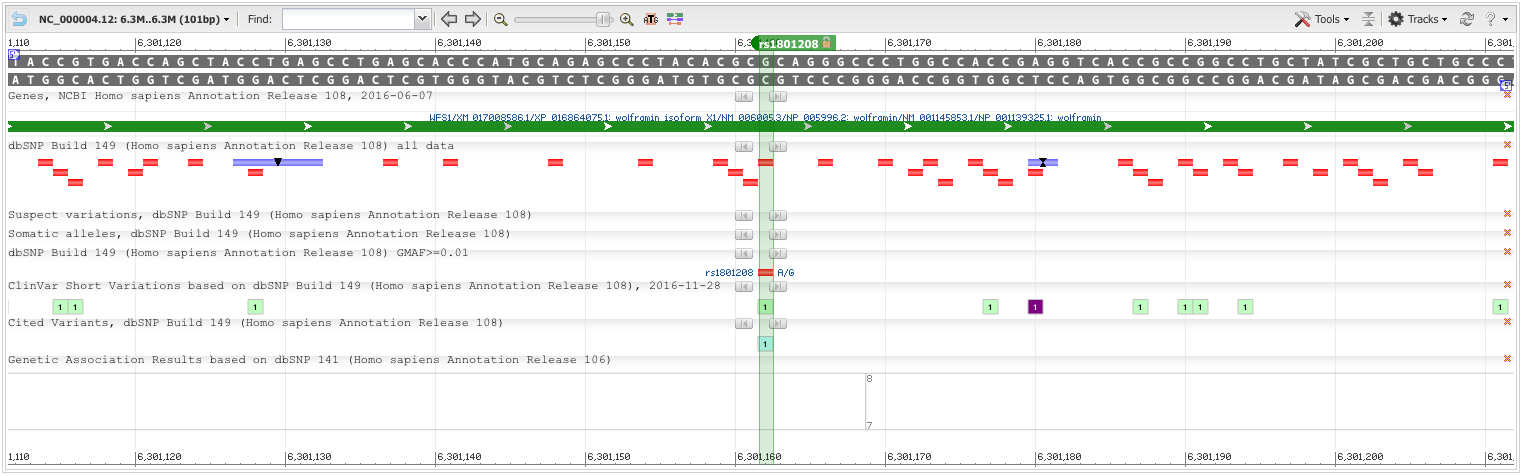
Most of the listed SNPs are benign; although rs1801208 has a high PolyPhen score, indicative of a known change in phenotypic expression.
AGCACCCATGCAGAGCCCTACACGC[A/G]CAGGGCCCTGGCCACCGAGGTCACC
Chromosome: 4:6301162
Gene:WFS1 (GeneView)
Functional Consequence: missense
Clinical significance: Likely benign
Validated: by 1000G,by cluster,by frequency,by hapmap
Global MAF:A=0.0603/302
HGVS: NC_000004.11:g.6302889G>A, NC_000004.12:g.6301162G>A, NG_011700.1:g.36313G>A, NM_001145853.1:c.1367G>A, NM_006005.2:c.1367G>A, NM_006005.3:c.1367G>A, NP_001139325.1:p.Arg456His, NP_005996.1:p.Arg456His, NP_005996.2:p.Arg456His, XM_017008586.1:c.1376G>A, XP_016864075.1:p.Arg459His
During analysis, we set the threshold of ExAC allele observations at the CDC's observed rate of prevelence of Autism. The general thinking is that there are a large number of SNPs that we can rule out; because they're present in larger portions of the population than the disease under study. Of the SNPs that have frequencies less than the prevelence of Autism, some of them are known to be autosomnal recessive; and to have mild forms when a person is a carrier, but not doubly recessive.
In interpreting these results, we have to think about what the GRCh37/hg19 Genome Assembly represents. Unlike the 1000 Genome Projects, which provides the possibility of averaged data; the GRCh37 and GRCh38 assemblies represent a normalized reference genome. That is, it was assmbled piecemeal from thirteen anonymous volunteers from Buffalo, New York. As such, if the genome was evenly divided between the 13 people (in actuality, it wasn't), and there is a 1/68 chance of having autism, then would be a 19% chance of the reference genome having genes from somebody having autism.
So, what these three genes from our Autism Screening Panel actually represent is this: of the thirteen anonymous volunteers who contributed to the GRCh37 reference genome, they collectively had 3 of the 101 genes from Pevsner's Autism Screening Panel.
Broadly speaking, the genes identified by the screening panel are responsible for producing the proteins that form the sodium-calcium ion pumps in laminin and transmembrane glycoproteins don't function properly. And laminin and transmembrane glycoproteins are involved in the development and maintenance of the occular lens, and management of diabetes.
If we had been running a 23andMe genome through this pipeline, at this point we might calculate a risk score based on the percentage of people with those genes who are later diagnosed with autism. Niavely, having variant markers on only 3/101 genes in the panel would indicate a 3% risk of having autism. In reality, the gene effects are likely distributed on a logarithmic or power distribution; and the results would either be a smoking gun, or somewhere on a long tail.
Additionally, we might run the genomes from the 1000 Genome Project through the Autism Screening Panel, to determine the specificity and sensitivity of the screening panel.
While it's unlikely that any of the thirteen anonymous volunteers involved in the GRCh37 assembly had autism themselves; it appears that they may be carrying a few recessive genes for autism. If they had children with somebody else who had variants on LAMC3, WFS1, and SCN1A, their children may be at risk of having Ushers Syndrome, Wolfram Syndrom, Diabetes, and vision/hearing loss.
Without running the 1000 Human Genome data through the screening panel; it's difficult to say whether autism rates are rising in the general population based on genetic evidence. It does appears that the definition of Autism has changed over time. Based on review of the literature and analysis of the data during this assignment, my theory is this:
At one point in time, Autism was a diagnostic description of a set of behaviors that was generally associated with a recessive trait, such as Usher's Syndrome or Wolfram Syndrome. These syndromes involve breakdown of the regulatory pathways that control the communication organs (speach, hearing, sight), and are highly correlated with an underlying recessive gene. Hence the historical prevelence rates which are correlated with recessive conditions such as Usher's Syndrome, and are known autosomal recessive syndromes.
Here's the thing though: the definition of Autism has been shifting away from an underlying genetic determinant that's correlated with a regulatory pathway that controls communication and cognition. Instead, it's shifting towards a metabolic or neurological mechanism that describes that regulatory pathway; and it's now including any genetic determinants that may cause a chance in that metabolic or neurological mechanism.
That is to say, nowdays Autism Spectrum Disorder is more of a discription of the failure of usherin, wolfarin, laminin, transmembrane glycoproteins, neurodevelopmental regulators, and other macromolecules to successfully assemble a functioning optic and auditory system that successfully interfaces with other humans according to socially constructed protocols.
However, the initial hypotheses are not mutually exclusive. It's possible that the definition of Autism has changed over time AND it's prevelence is rising in the general population. And while we have some data to make a tentative positive affirmation that the definition has changed, we simply don't have enough information to rule out rising rates in the general population. For that, we would need to run the entire 1000 Human Genome dataset through the autism panel. I would welcome the opportunity to do such work and further explore that problem.
Human Genome Browser - hg19 assembly
National Center for Biotechnology Information - GRCh37
DSM5 - Diagnostic Criteria - Autism Spectrum Disorder
Centers for Disease Control and Prevention: Autism Spectrum Disorder
The Supplementary Material Repository for Bioinformatics Data Skills
High Throughput Sequencing Libraries
1000 Genomes Browser
UCSC Genome Bioinformatics: Sequnce and Annotation Downloads
Chromosome Visualization with D3.js
HUGO Gene Nomenclature Committee
Burrows-Wheeler Alignment Tool
Varient Effect Predictor Results - USH2A
Varient Effect Predictor Results - Autism Panel
Micro-RNA Binding Site Polymorphisms in the WFS1 Gene Are Risk Factors of Diabetes Mellitus
Children with Usher syndrome: mental and behavioral disorders
An eQTL mapping approach reveals that rare variants in the SEMA5A regulatory network impact autism risk
Mutations in both gene copies more common in autism
Detailed investiation of the role of common and low-frequency WFS1 variants in type 2 diabetes risk
Genetic variants and susceptibility to neurological complications following West Nile virus infection
Characterization and expression of the laminin gamma3 chain: a novel, non-basement membrane-associated, laminin chain.
Linkage of the gene for Wolfram syndrome to markers on the short arm of chromosome 4.
A gene encoding a transmembrane protein is mutated in patients with diabetes mellitus and optic atrophy (Wolfram syndrome).
Localization of a putative human brain sodium channel gene (SCN1A) to chromosome band 2q24.
Autosomal dominant epilepsy with febrile seizures plus with missense mutations of the (Na+)-channel alpha 1 subunit gene, SCN1A.
International Union of Pharmacology. XLVII. Nomenclature and structure-function relationships of voltage-gated sodium channels.