- Clone this repo
yarnyarn start- open
localhost:3000 - open Chrome DevTools and start profiling
- Start clicking the button really fast a bunch of times. Maybe for 5-10 seconds.
- Stop the profiler quickly after the last button press.
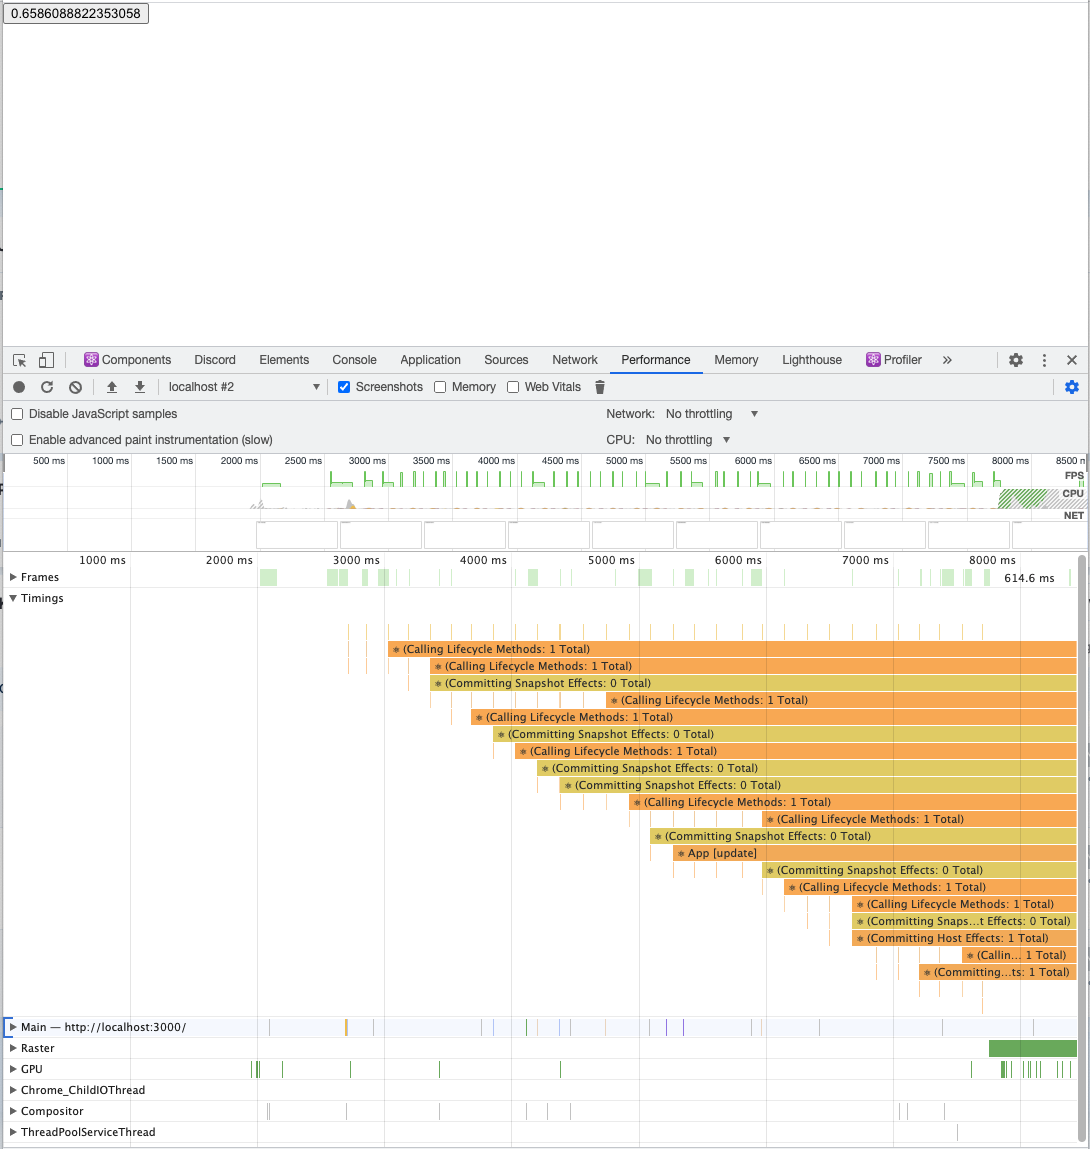
- Check the Timings tab
It doesn't happen consistently so you may have to do steps 5-8 a few times to reproduce the issue
You can see the Calling Lifecycle Methods timing block spans almost the entire width of the profile and is some absurd duration like 5.4s. You will likely see more accurate timing blocks interspersed that have more accurate timings (<1ms)
