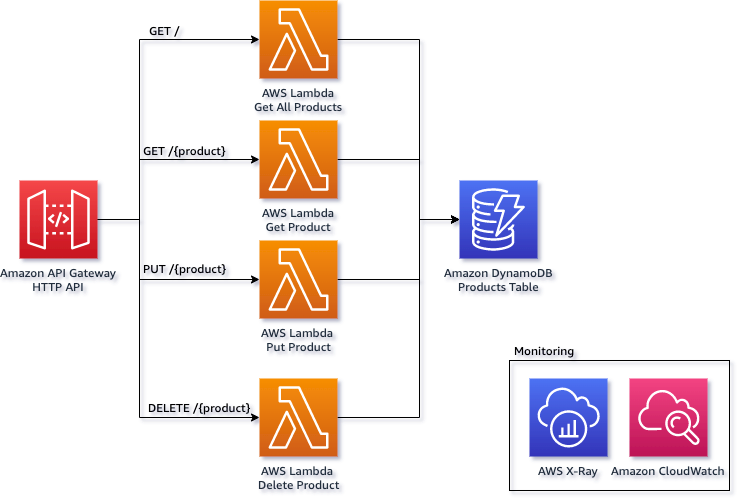
This is a simple serverless application built in Java and uses the GraalVM native-image tool. It consists of an Amazon API Gateway backed by four AWS Lambda functions and an Amazon DynamoDB table for storage.
Within the software folder is the products maven project. This single maven project contains all the code for all four Lambda functions. It uses the hexagonal architecture pattern to decouple the entry points, from the main domain logic and the storage logic.
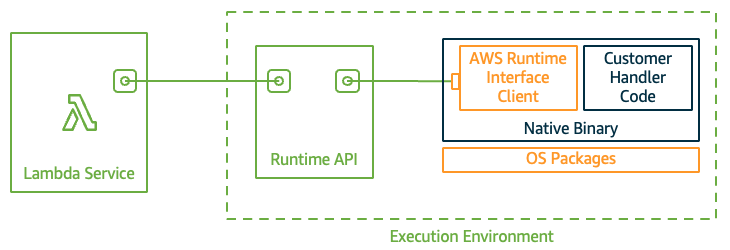
The GraalVM native-image tool will produce a stand-alone executable binary. This does not require the JVM to run. To run
our application on Lambda we must make
a custom runtime
and implement the Lambda Runtime API. This is done by
including the aws-lambda-java-runtime-interface-client dependency in our project.
The maven assembly build plugin
is used to create a zip file which includes the executable binary as well as the entry
point bootstrap
file.
Deploy the demo to your AWS account using AWS CDK.
cdk deploy --allThe command cdk deploy will first build the products maven project using a docker build image with all the required
GraalVM tools. Then it will use AWS CloudFormation to deploy the resources to your account.
CDK will create an output of the API Gateway endpoint URL for future use in our load tests.
Artillery is used to make 300 requests / second for 10 minutes to our API endpoints. You can run this with the following command.
cd load-test
./run-load-test.sh
This is a demanding load test, to change the rate alter the arrivalRate value in load-test.yml.
Using this CloudWatch Logs Insights query you can analyse the latency of the requests made to the Lambda functions.
The query separates cold starts from other requests and then gives you p50, p90 and p99 percentiles.
filter @type="REPORT"
| fields greatest(@initDuration, 0) + @duration as duration, ispresent(@initDuration) as coldStart
| stats count(*) as count, pct(duration, 50) as p50, pct(duration, 90) as p90, pct(duration, 99) as p99, max(duration) as max by coldStart
You can add additional detail to your X-Ray tracing by adding a TracingInterceptor to your AWS SDK clients. Here is the code for my DynamoDbClient from the DynamoDbProductStore class.
private final DynamoDbClient dynamoDbClient=DynamoDbClient.builder()
        .credentialsProvider(EnvironmentVariableCredentialsProvider.create())
        .region(Region.of(System.getenv(SdkSystemSetting.AWS_REGION.environmentVariable())))
        .overrideConfiguration(ClientOverrideConfiguration.builder()
        .addExecutionInterceptor(new TracingInterceptor())
        .build())
        .build();
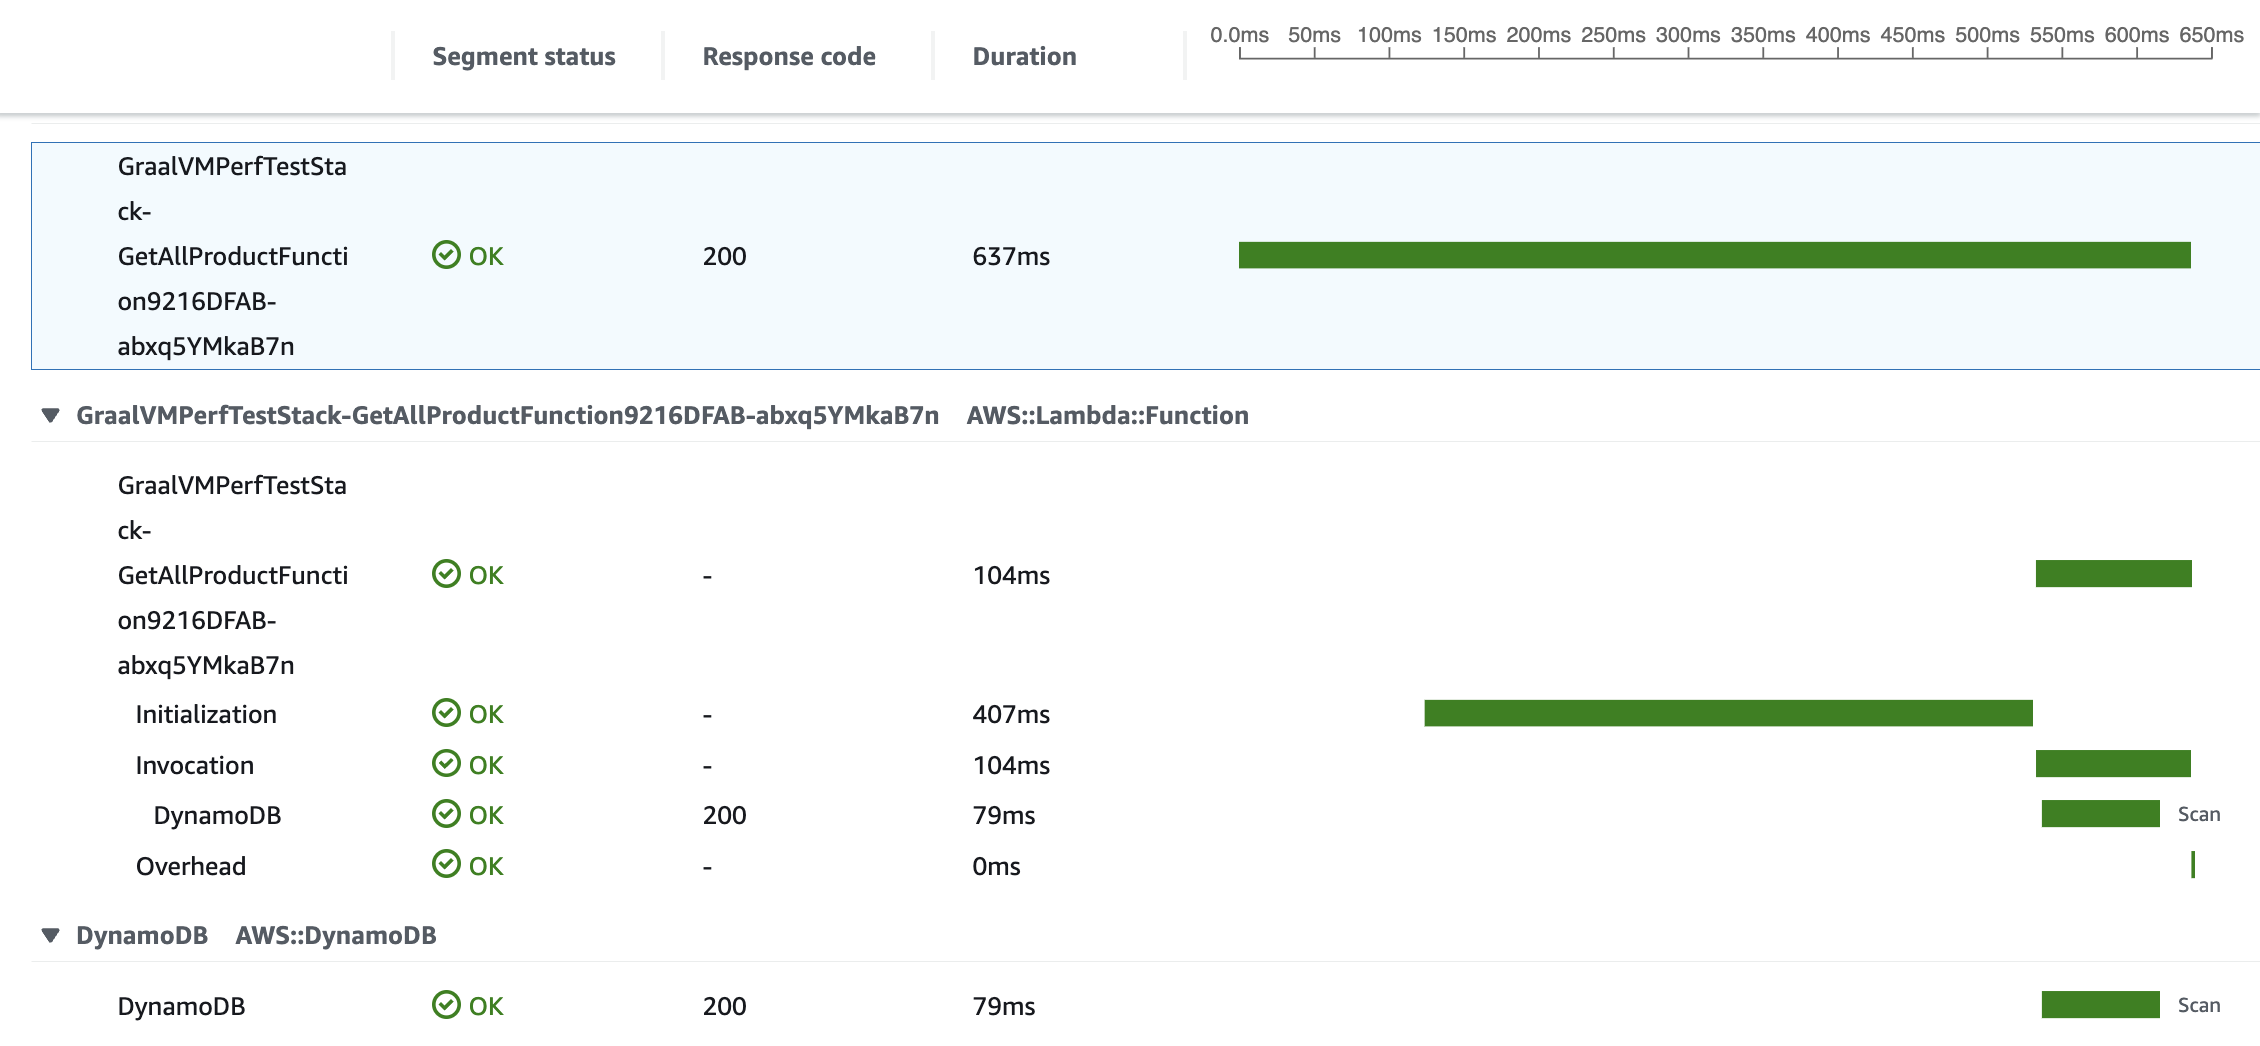
Example cold start trace
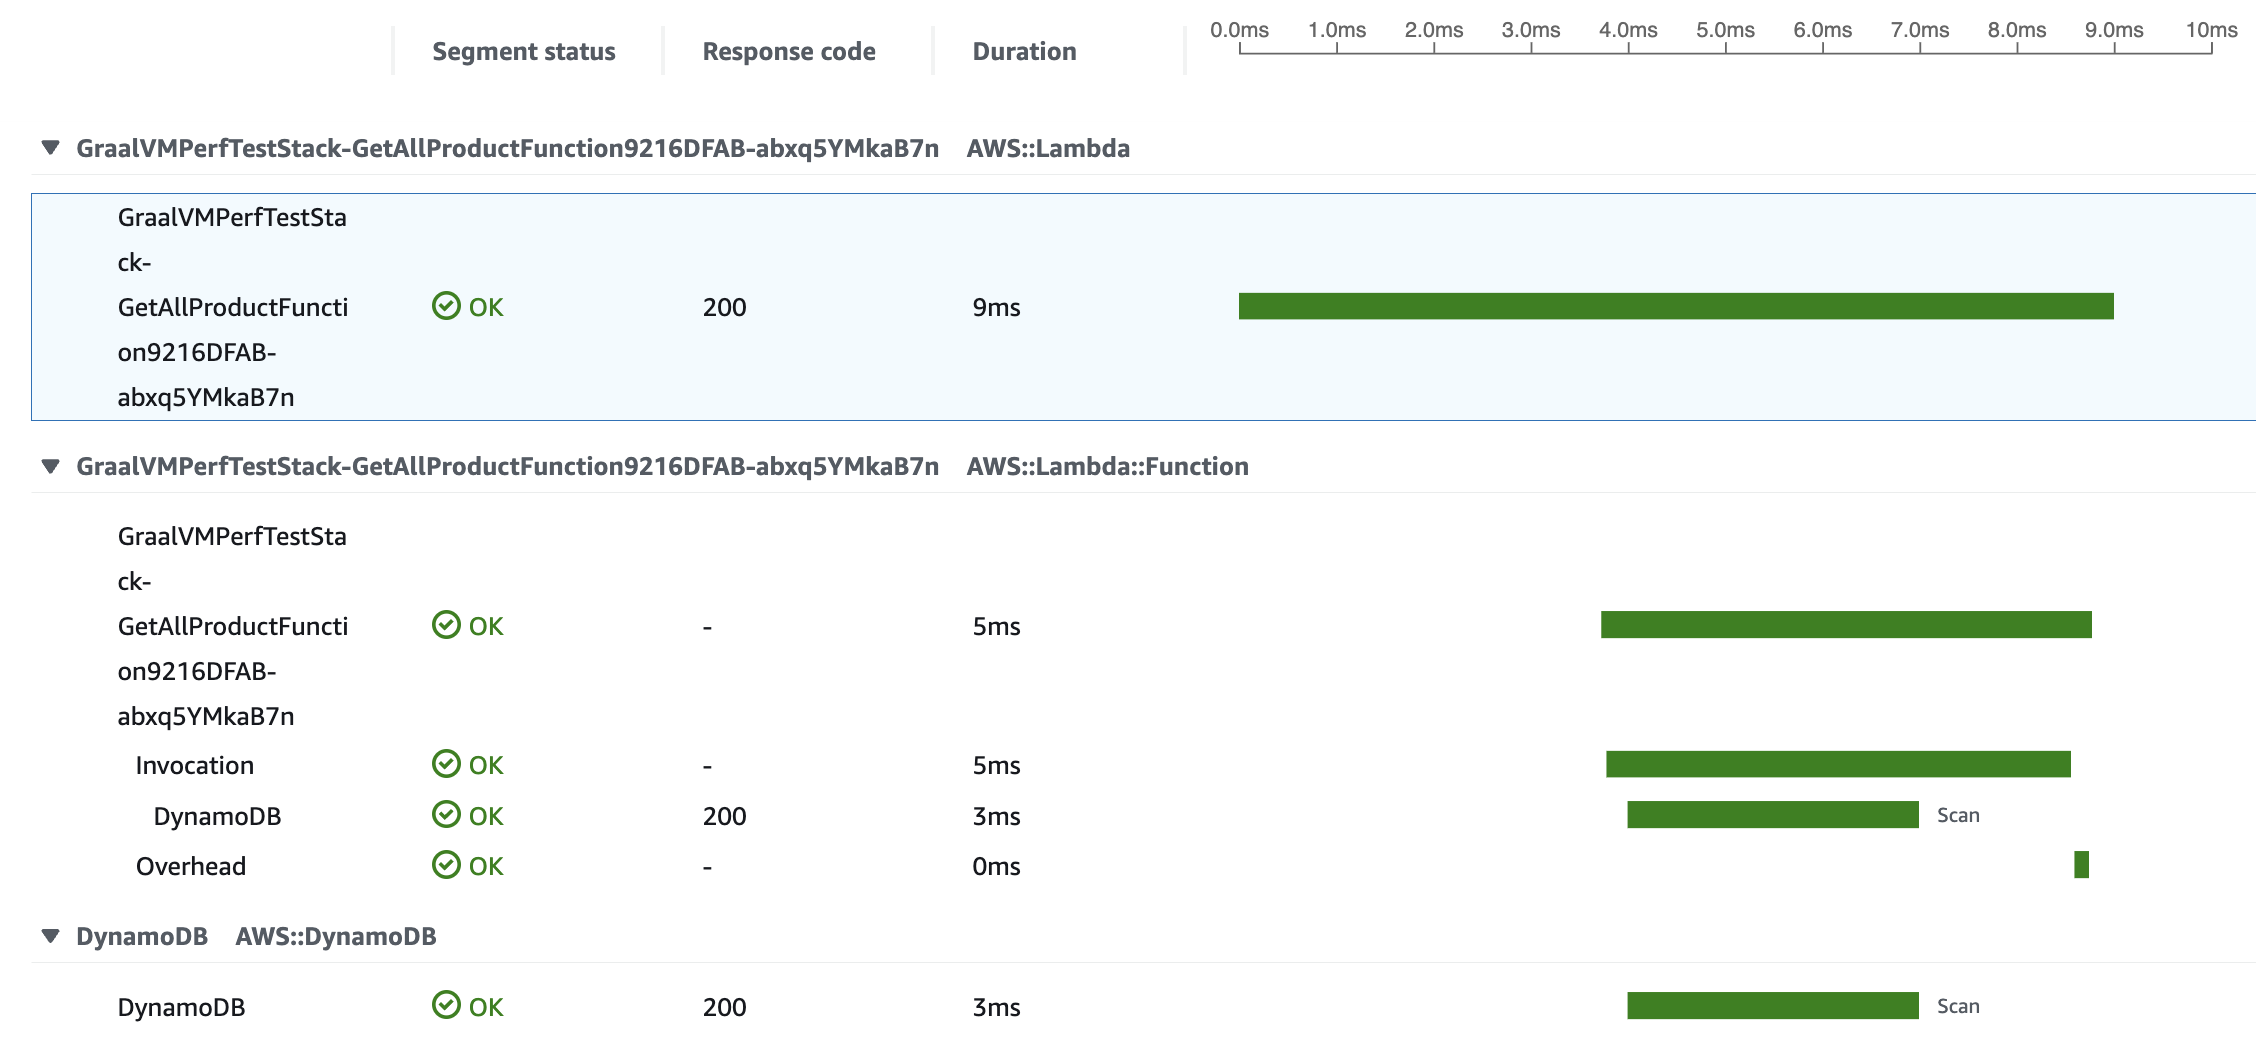
Example warm start trace
You can find implementations of this project in other languages here:
See CONTRIBUTING for more information.
This library is licensed under the MIT-0 License. See the LICENSE file.


