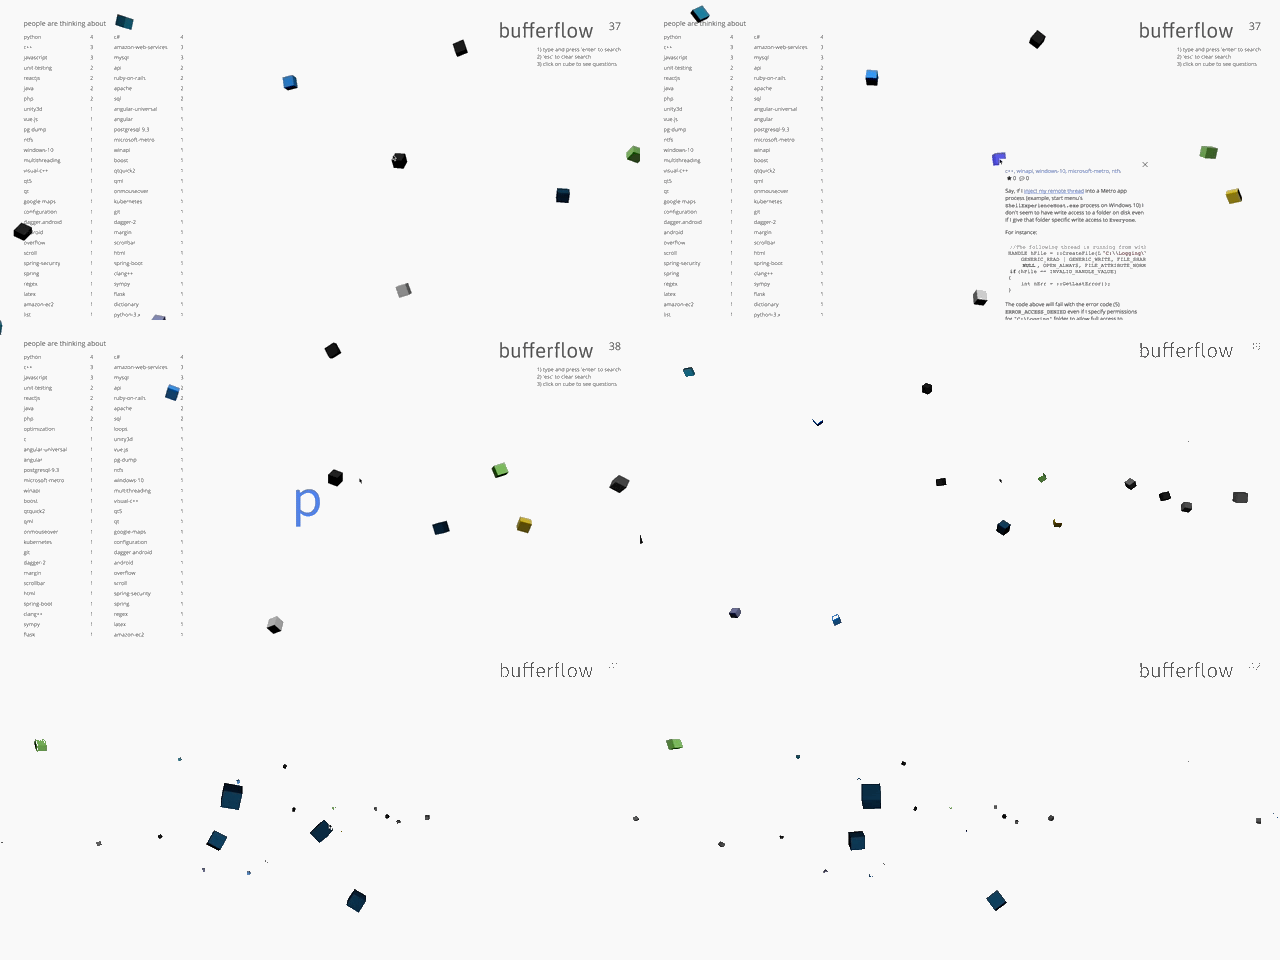
Bufferflow is a 3D visualization of Stackoverflow questions and data. Prompted by my curiosity in which technologies others are interested in and a desire to play with three.js, a WebGL library written in JavaScript, this project seemed like a good opportunity to combine the two. Bufferflow tries to present data such as question topic, comments, and upvotes intuitively and interactively.
Start development server. (Default port 8000)
npm run dev
Build production assets with webpack.
npm run build
This project will be implemented with the following technologies:
JavaScriptfor general application logic.three.jsfor 3D rendering.TweenMaxfor assisting in transitions between some of the cube movements.axiosfor fetching data from Stackexchange's API.webpackto bundle js files and set up a local dev server.
In the entry point main.js, the Visualization object is insantiated and provided a callback to fetch data. In hindsight, this callback more appropriately belongs with the rest of the HTTP utility functions in SEUtils.js.
Below is the callback responsible for fetching data. The methods prefixed with "fetch" are simple AJAX requests made to StackExchange's API. The requests are made sequentially with promises since we need a question's ID before we're able to get information associated to it. A resData object is built up and passed to the visualization instance via vz.load(data).
  const fetchData = () => {
    const resData = {};
    SEUtils.fetchQuestions()
    .then( res => { // questions
      resData.questions = res.data.items;
      return SEUtils.fetchQuestionDetailsFromItems(res.data.items);
    })
    .then( res => { // question details
      resData.questionDetails = res.data.items;
      return SEUtils.fetchAcceptedAnswersFromItems(res.data.items);
    })
    .then( res => { // accepted answers
      resData.acceptedAnswers = res.data.items;
      const seData = SEUtils.packageData(resData);
      vz.load(seData);
      window.quotaRemaining = res.data.quota_remaining;
    });
  };
The load method destructures data provided by fetchData and creates custom SEObjects (which stand for stack exchange object). Basically, this is the code representing each cube you see. SEObjects are described in more detail later.
  load({ questions, questionDetails, acceptedAnswers }) {
    const qids = Object.keys(questions);
    qids.map( qid => {
      const question = questions[qid];
      question.tags = arrayToObj(question.tags);
      const questionDetail = questionDetails[qid];
      const acceptedAnswer = acceptedAnswers[questionDetail.accepted_answer_id];
      const SEData = {
        question,
        questionDetail,
        acceptedAnswer,
      };
      const SEObj = new SEObject(SEData, this);
      this.SEObjBuffer.push(SEObj);
    });
}This class encapsulates the entire visualization on a high level. In this class, you will find:
- references to three.js components required to render the screen
- data structures (buffers and hash maps) to contain information needing to be rendered
- and event handlers for mouse and keyboard interaction.
SEObject encapsulates all the relevant stack exchange data together with the three.js components (mesh, shaders) necessary to visualize it. The size of a cube (and mesh) is scaled by how many responses/comments a question has, and the movement/velocity is in turn determined by the cube's size.
class SEObject {

  constructor(SEData, viz) {
    this.SEData = SEData;
    this.viz = viz;
    this.mesh = createMesh.call(this);
    this.id = this.mesh.uuid;
    this.movement_0 = calcDefaultMovement.call(this);
    this.movement_c = Object.assign({}, this.movement_0);
    this.moving = true;
    this.displayInfo = false;
  }
  ...

}