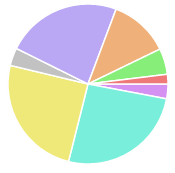
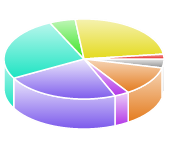
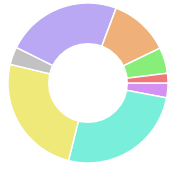
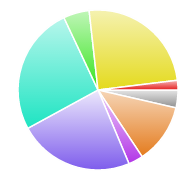
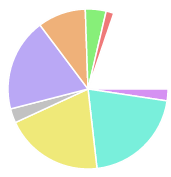
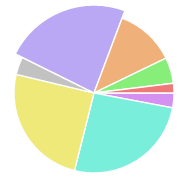
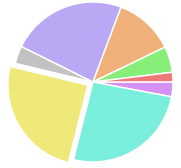
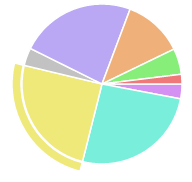
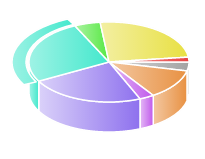
Based on Raphaël JS (cross-browser JavaScript library that draws scalable vector graphics) by Dmitry Baranovskiy (https://dmitrybaranovskiy.github.io/raphael/). The library can generate 2D & 3D pure SVG pie & donut charts. Chart legend also generated using SVG, without any HTML. Comprehensive configuration options available for a better user experience.
Paper.pielicious(cx, cy, r, opts)
- cx (integer) x coordinate of the pie
- cy (integer) y coordinate of the pie
- r (integer) radius of the pie
- opts (object) pie options
Object of Raphaël elements: {slices: [array], markers: [array], descriptions: [array]}
slices: array ofPaper.pathrepresenting pie slicemarkers: array ofPaper.pathrepresenting pie legend markerdescriptions: array ofPaper.textrepresenting pie legend item
var paper = new Raphael("canvas", 500, 500);
var pie = paper.pielicious(150, 150, 100, {
    data: [23, 56, 78],
    colors: ['red', '#edf234', 'rgb(233, 145, 68)'],
    titles: ['apples', 'oranges', 'pear'],
    handles: ['apple_slice', 'orange_slice', 'pear_slice'],
    hrefs: ['http://google.com', 'http://apple.com', 'http://yahoo.com'],
    gradient: {darkness: 12, lightness: 9, degrees: 180},
    cursor: "pointer",
    marker: "rect",
    threeD: {height: 10, tilt: 0.8},
    donut: {diameter: 0.4, tilt: 0.6},
    legend: {labels: labels, x: 290, y: 90, fontSize: 14, fontFamily: "Verdana", events: true},
    evolution: true,
    orientation: 130,
    animation: "elastic"
});
data(array): values used to plotcolors(array): array of string colors used to fill each pie/donut slice- If not provided or empty, random colors will be generated for each slice
titles(array): array of tooltips for each slice when mouse hovers [default:[]]handles(array): array of strings assigned to Raphaël elements of the chart [default:[]]hrefs(array): string urls to set up clicks on pie slices [default:[]]cursor(string): cursor type displayed when mouse hovers the slice [default:normal]marker(string): legend marker symbol. Options:rect,circle&ellipse[default:circle]evolution(boolean): whether or not to animate rendering slice by slice [default:false]orientation(integer): between 1 - 360. Pie slices render starting from this angle [default:0]gradient(object literal): use color gradient to fill each slice [default: none]gradient.darkness(integer):colordarkness level between (incl.) 0-100 [default:0]gradient.lightness(integer):colorlightness level between (incl.) 0-100 [default:0]gradient.degrees(integer): gradient direction angle [default:180]
threeD(object literal): generate 3D pie chart. Not available for donut [default: 2D chart]threeD.height(integer): between 1 - 100. The height of 3D pie (Z dimension) [default:25]threeD.tilt(float): between 0.1 - 0.9. Determines the 3D pie tilt angle [default:0.5]
legend(object literal): generate chart legend [default: none]legend.labels(array): array of strings that will be used in a pie legendlegend.x(integer): x origin coordinate of the legend [default:chart X + radius + 30]legend.y(integer): y origin coordinate of the legend [default:chart Y - radius]legend.fontFamily(string): legend font type [default:Arial]legend.fontSize(string): legend font size [default:14]legend.events(boolean): marker or text hover triggers slice hover effect [default:false]animationmust be set iflegend.eventsis set totrue
donut(object literal): turn pie into donut chart. Not available in 3D [default: pie chart]donut.diameter(float): between 0.1 - 0.9. Determines the donut thickness [default:0.5]donut.tilt(float): between 0.1 - 0.9. Determines the donut tilt angle [default: no tilt]
animation(string): slice hover effect. Disabled in whole, no-slice pie/donut [default: none]shift-fast: pie slice shifts away from the pie center see Screenshotsshift-slow: same asshift-fast, but slowershift-bounce: same asshift-fast. When mouse exits, the slice bounces backscale: pie slice scales up see Screenshotsscale-bounce: same as above. When mouse exits, it bounces back to original sizeelastic: pie slice shifts in & out in elastic fashionoutline: 2D outline appears near the outer slice edge see Screenshots
- Export functionality
Raphaël v2.1.2
Raphaël JS ONLY. There is no need for g.Raphaël JS library
v2.1
- Renamed to 'pielicious'
v2.0
- Added 3D support
- Minor cosmetic changes, overall code cleanup
v1.0
- Initial version
