
![]()
![]()
![]()
![]()

This Docker container implements a Nagios Monitor, Nagvis and Nagiosgraph. Originally based on hpchud/nagios.
| Program | Version |
|---|---|
| Nagios | 4.1.1 |
| Nagios-plugins | 2.1.1 |
| Nagiosgraph | 1.5.2 |
| NRPE | 2.15 |
| NDO Utils | 1.5.2 |
| Livestatus | 1.2.6p16 |
| Nagvis | 1.8.5 |
| Nuvola Theme | 1.0.3 |
- Raspbian base image: resin/rpi-raspbian.
Installation from Docker registry hub.
You can download the image with the following command:
docker pull paperinik/rpi-nagiosMonitors your entire IT infrastructure to ensure systems, applications, services, and business processes are functioning properly. In the event of a failure, Nagios can alert technical staff of the problem, allowing them to begin remediation processes before outages affect business processes, end-users, or customers. With Nagios you’ll never be left having to explain why an unseen infrastructure outage hurt your organization’s bottom line. This container also includes: live status, nagios plugins, ndo utils, nagvis, nagios graph and nrpe.
Plugins that allow you to monitor hosts, devices, services, protocols, and applications with Nagios.
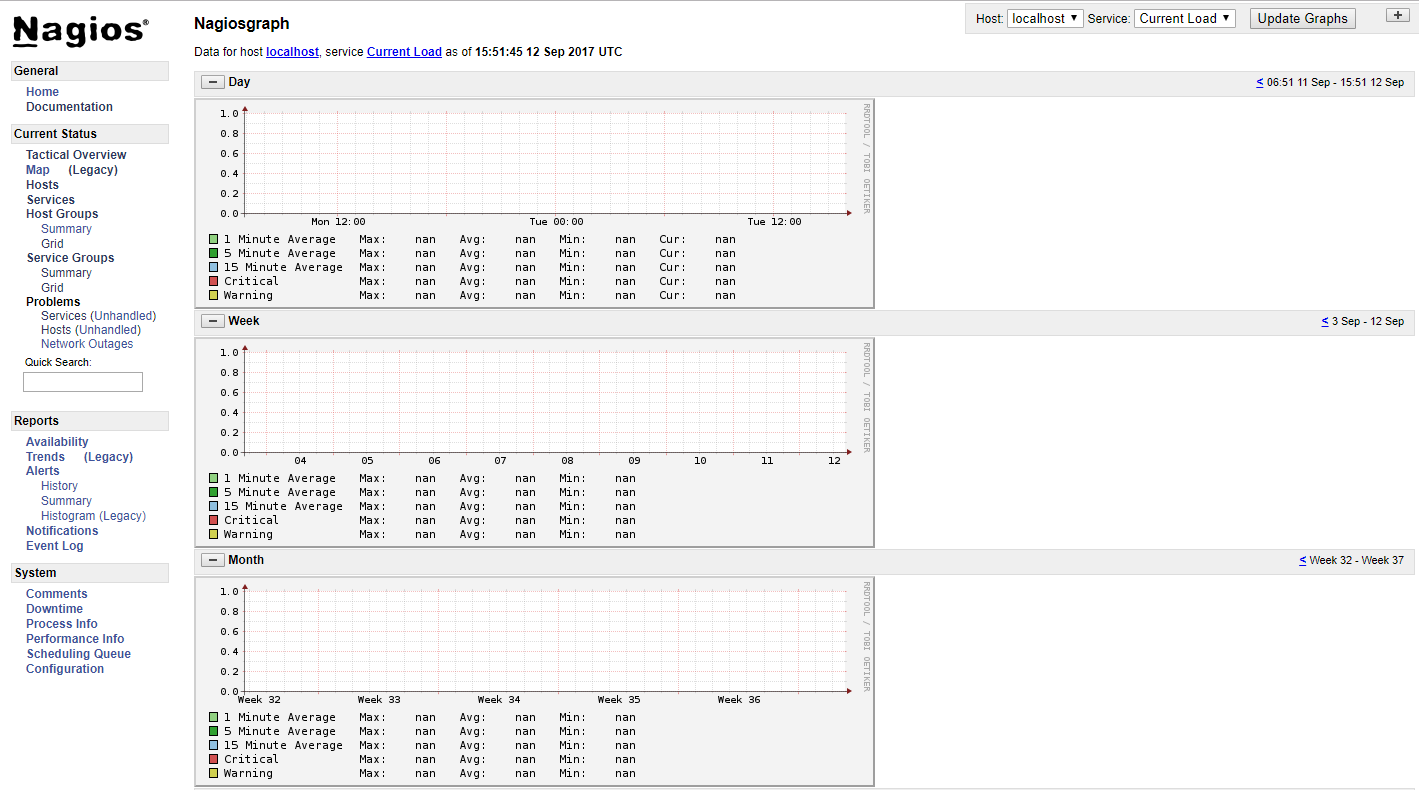
Parses output and performance data from Nagios plugins, and stores the data in RRD files. Nagiosgraph displays data in Nagios trends, as popups for hosts and services, or in separate reports. Easy to set up but eminently customizable.
It´s a monitoring agent and a protocol used for monitoring on Linux and Unix machines. NRPE consists of two parts:
- A client (Plugin check_nrpe), which runs on Nagios Server.
- A daemon that runs on remote Linux, which returns status information. ps.: NRPE supports Microsoft machine as well.
Allows you to export current and historical data from one or more Nagios instances to a MySQL database. Several community addons use this as one of their data sources. NDOUtils consists of a standalone daemon, a Nagios event broker, and several helper utilities.
NDO2DB user: nagios NDO2DB group: nagios
Is a tool to access the host and service status of your Nagios server.
Is a visualization addon for the well known network managment system Nagios. NagVis can be used to visualize Nagios Data, e.g. to display IT processes like a mail system or a network infrastructure.
The nagios instance starts listening on the default port of 80 on the container.
http://your_server_ip/nagios
- username : nagiosadmin
- password : admin
http://your_server_ip/nagiosgraph/cgi-bin/show.cgi

http://your_server_ip/nagvis
- username : admin
- password : admin
Nagios Configuration lives in /usr/local/nagios/etc NagiosGraph configuration lives in /usr/local/nagiosgraph/etc
Run with the example configuration with the following:
docker run --name nagios -p 9404:80 9505:5666 paperinik/rpi-nagiosalternatively you can use external Nagios configuration & log data with the following:
docker run -d --name nagios  \
  -v /home/pi/docker_path/nagios/nagios:/usr/local/nagios \
  -v /home/pi/docker_path/nagios/nagiosgraph:/usr/local/nagiosgraph \
  -v /home/pi/docker_path/nagios/nagvis:/usr/local/nagvis \
  -e portainerpage=0.0.0.0:9400 \
  -e centreonpage=0.0.0.0:9401 \
  -e mantisbtpage=0.0.0.0:9402 \
  -e sonarpage=0.0.0.0:9403 \
  -e svnpage=0.0.0.0:9404 \
  -e ftppage=0.0.0.0:9405 \
  -e jenkinspage=0.0.0.0:9406 \
  -e nexuspage=0.0.0.0:9407 \
  -e utilspage=0.0.0.0:9408 \
  -e dokuwikipage=0.0.0.0:9409 \
  -e portainerlogin=admin \
  -e portainerpassword=admin \
  -e centreonlogin=admin \
  -e centreonpassword=admin \
  -e mantisbtlogin=admin \
  -e mantisbtpassword=admin \
  -e sonarlogin=admin \
  -e sonarpassword=admin \
  -e svnlogin=admin \
  -e svnpassword=admin \
  -e ftplogin=admin \
  -e ftppassword=admin \
  -e jenkinslogin=admin \
  -e jenkinspassword=admin \
  -e nexuslogin=admin \
  -e nexuspassword=admin \
  -e utilslogin=admin \
  -e utilspassword=admin \
  -e dokuwikilogin=admin \
  -e dokuwikipassword=admin \
  -e nagioslogin=nagiosadmin \
  -e nagiospassword=admin \
  -e nagvislogin=admin \
  -e nagvispassword=admin \
  -p 80:80 \
  -p 9411:5666 \
  paperinik/rpi-nagios
For best results your Nagios image should have access to both IPv4 & IPv6 networks
The default credentials for the web interface is nagiosadmin / nagios
sudo docker exec -it paperinik/rpi-nagios bashCopy Nagios files from docker container (folder: /path-to-nagios-folder MUST BE root:root BEFORE COPY!!!!!)
docker cp nagios:/usr/local/nagios/ /path-to-nagios-folder
docker cp nagios:/usr/local/nagiosgraph/ /path-to-nagios-folder
docker cp nagios:/usr/local/nagvis/ /path-to-nagios-folder
docker cp nagios:/usr/share/snmp/mibs /path-to-nagios-folder- Nagios nrpe [http://exchange.nagios.org/directory/Addons/Monitoring-Agents/NRPE--2D-Nagios-Remote-Plugin-Executor/details]
- Nagiosgraph [http://exchange.nagios.org/directory/Addons/Graphing-and-Trending/nagiosgraph/details]
- JR-Nagios-Plugins - custom plugins I've created [https://github.com/JasonRivers/nagios-plugins]
- WL-Nagios-Plugins - custom plugins from William Leibzon [https://github.com/willixix/WL-NagiosPlugins]
- JE-Nagios-Plugins - custom plugins from Justin Ellison [https://github.com/justintime/nagios-plugins]
- Nagios-Nuvola Theme - custom theme
- [https://exchange.nagios.org/directory/Addons/Frontends-%28GUIs-and-CLIs%29/Web-Interfaces/Themes-and-Skins/Nuvola-Style/details]
- [ftp://ftp.vim.org/vol/4/smeserver/contribs/michaelw/sme7/Nagios3/packages/nagios-nuvola-1.0.3.tar.gz]