Diabetes is a disease that occurs when your blood glucose, also called blood sugar, is too high. Blood glucose is your main source of energy and comes from the food you eat. Insulin, a hormone made by the pancreas, helps glucose from food get into your cells to be used for energy
- Has Diabetes % Increased in the US
- Has Obesity % Increaed in the US
- What are the top 5 states with Diabetes/Obesity
- What are the bottom 5 states with Diabetes/Obesity
- Do States with higher Diabetes Rates also have Higher Obesity Rates
- Anaconda
- Jupyter NoteBook
- Python/Pandas
- Tableau
For Obesity dataset I used 6 difffent csv files from 2011-2016 downloaded from the CDC website
For Diabetes dataset I used 6 diffrent csv files files from 2011-2016 downloaded from the CDC website
I used Jupyter Notebook to concate the difffent csv files into one csv file and data cleaning
# Dependencies
import pandas as pd
from glob import glob

# use glob() to list all files that match a pattern
obesity_files = sorted(glob('Resources/*-Obesity.csv'))
obesity_files
# Concat all files by using pd.concat() and asssign() methods
obesity_2011_to_2016 = pd.concat((pd.read_csv(file).assign(filename = file)
for file in obesity_files), ignore_index = True)
obesity_2011_to_2016.head()I used Tableau to visualize my findings
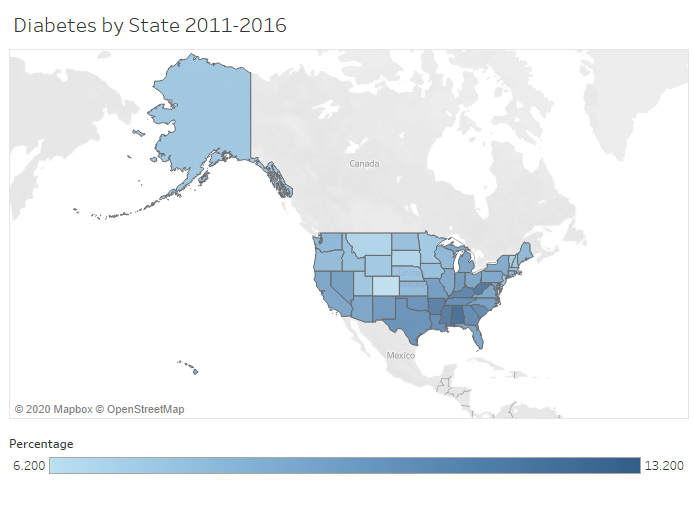
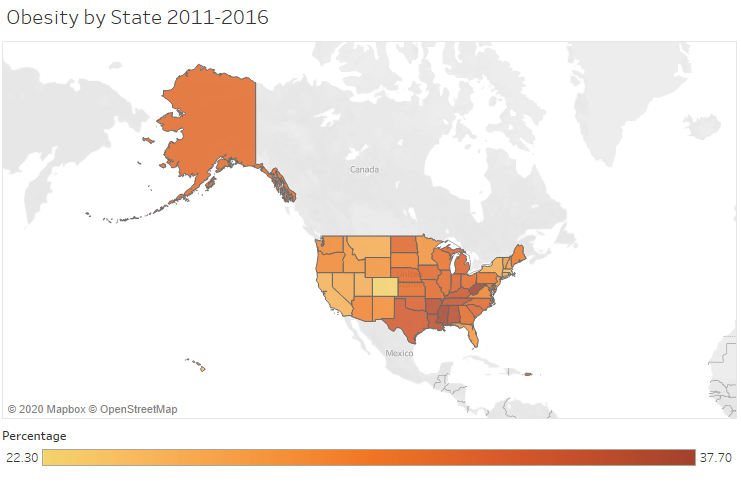
Map of Diabetes & Obesity in 2016
-
Has Diabetes % Increased in the US
From 2011-2016 Diabetes has increase from 8.4% to 8.5%
-
Has Obesity % Increaed in the US
From 2011-2016 Obesity has increased from 27.4% to 29.6%
-
What are the top 5 states with Diabetes/Obesity
In 2016 the top 5 states
Diabetes:- Alabama 13.2%
- West Virginia 12.7%
- Mississippi 12.14%
- Arkansas 12.1%
- Kentucky 11.8%
Obesity:
1. West Virginia 37.7%
2. Mississippi 37.3%
3. Arkansas 35.7%
4. Alabama 35.7%
5. Lousisian 34.8%
- Alabama 13.2%
-
What are the bottom 5 states with Diabetes/Obesity
In 2016 the bottom 5 states
Diabetes:- Colorado 6.2%
- Montana 6.9%
- South Dakota 6.9%
- Vermont 7.3%
- Minnesota 7.6%
Obesity:
1. Colorado 22.3%
2. Massachusetts 23.6%
3. Hawaii 23.8%
4. California 25.0%
5. Utah 25.40%
- Colorado 6.2%
-
Do States with higher Diabetes Rates also have Higher Obesity Rates
Overal there dose some to be a correaltion between states that have high rates of Diabetes, also have higher obesity rates


