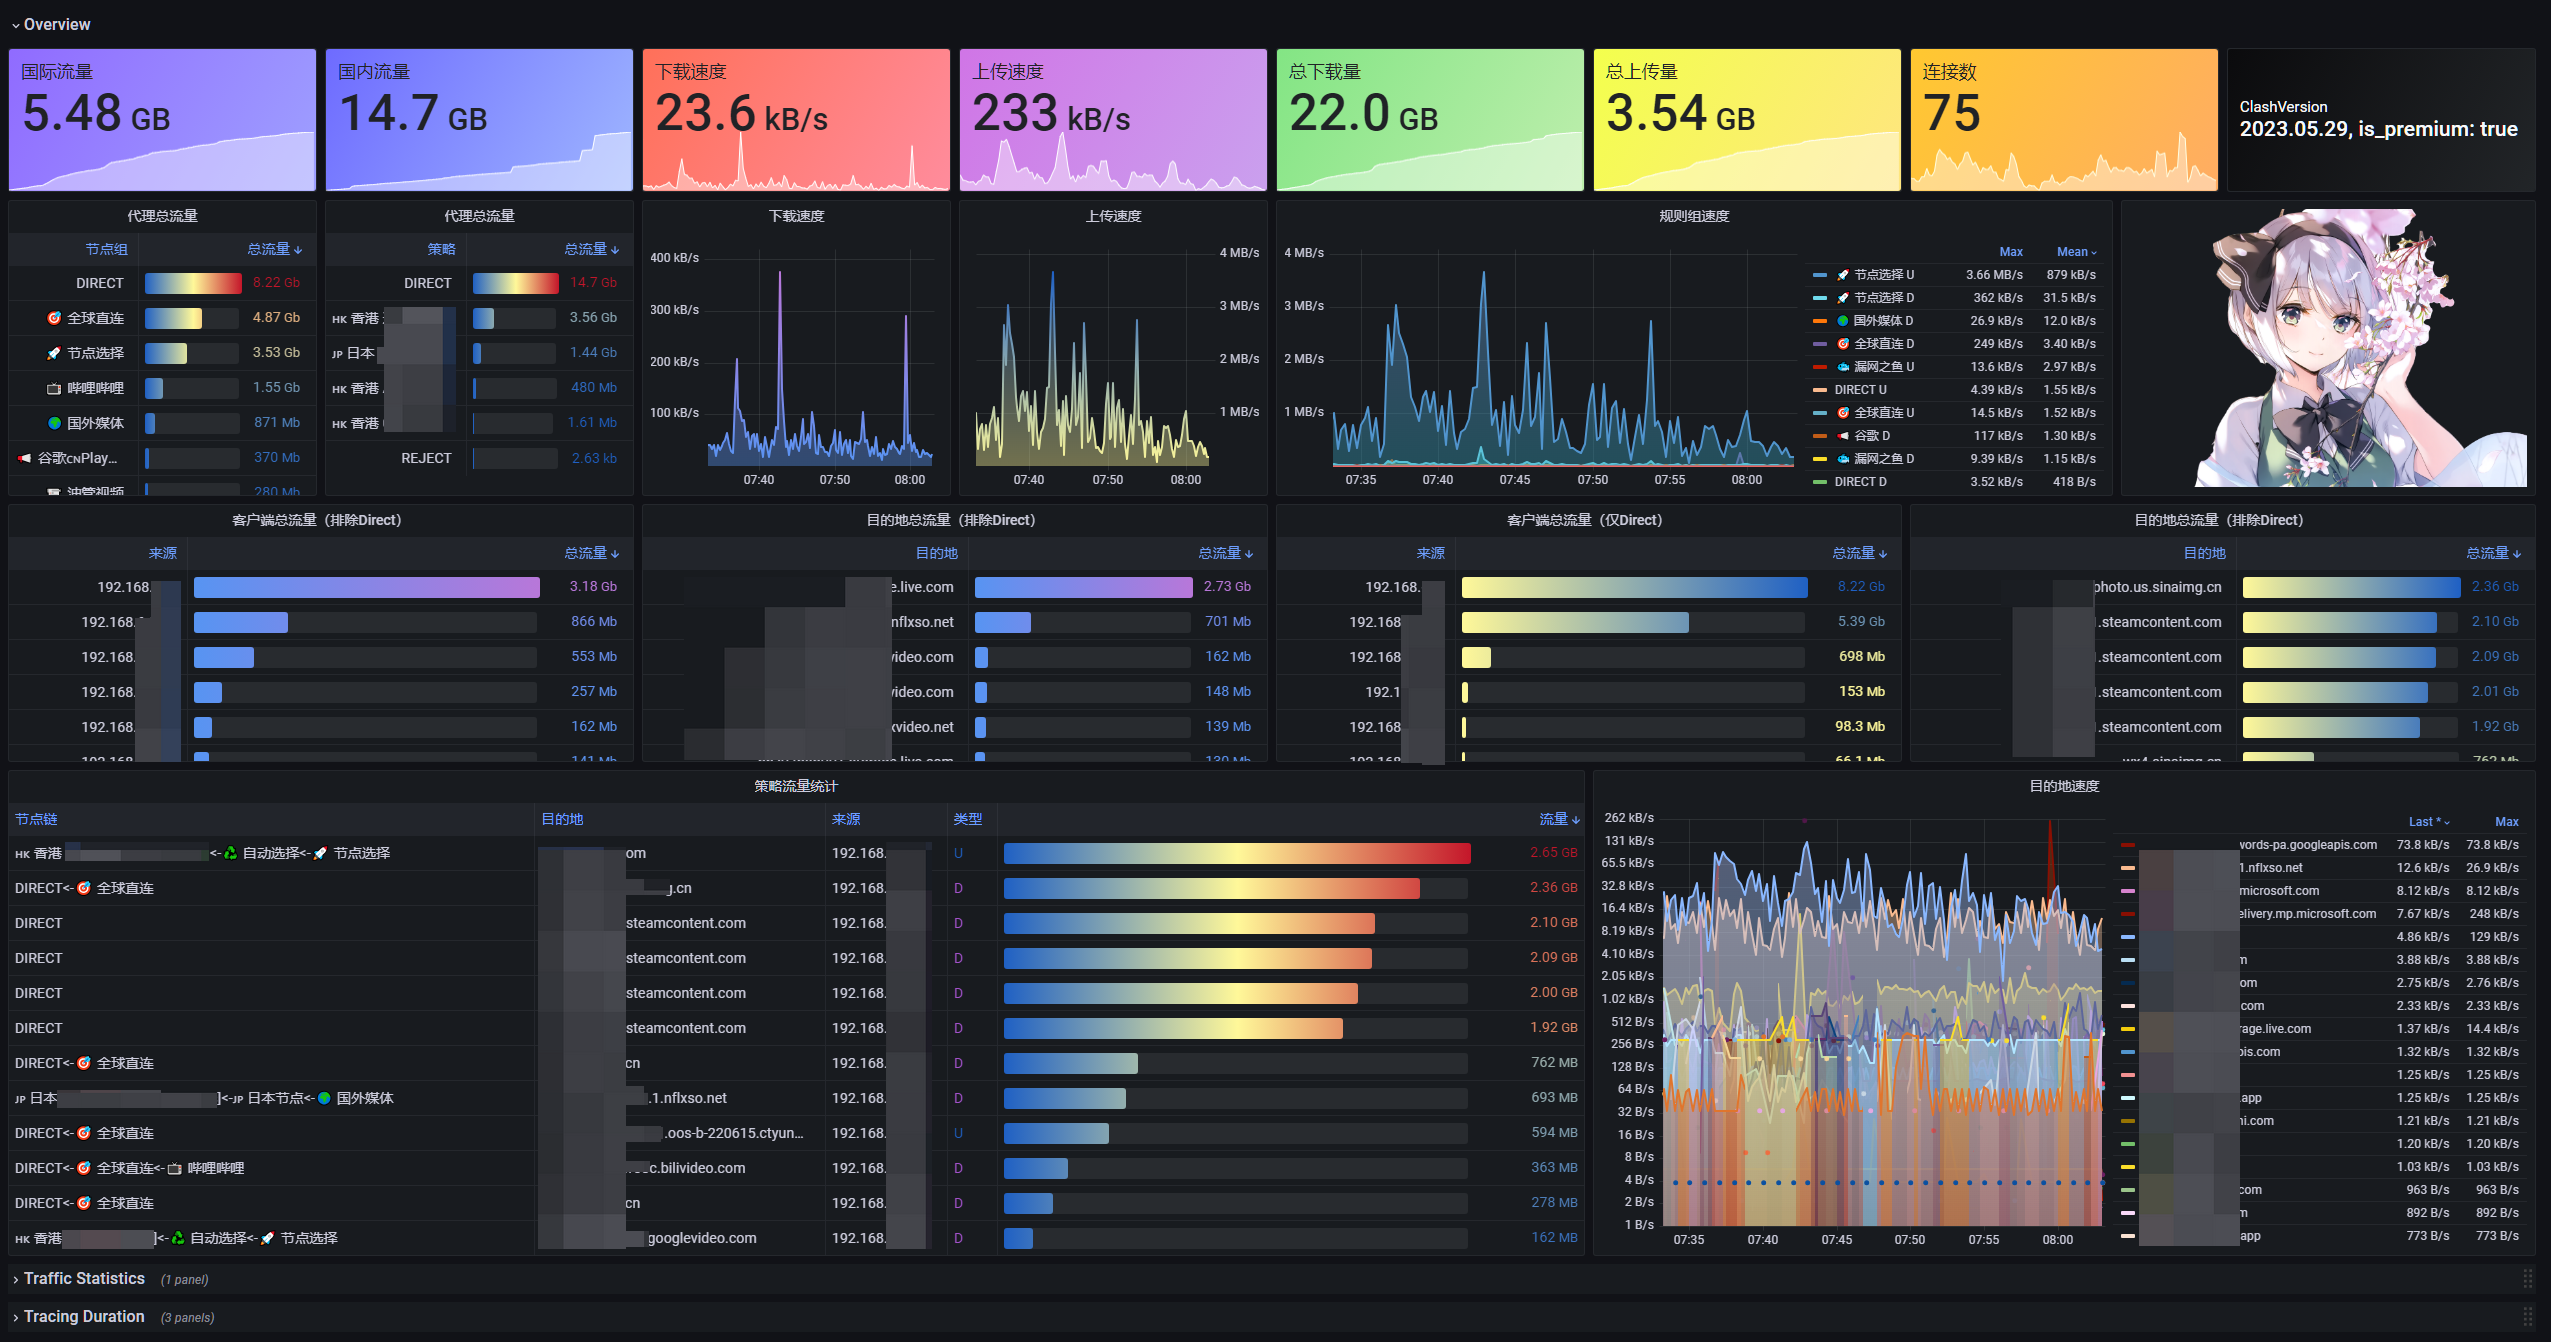
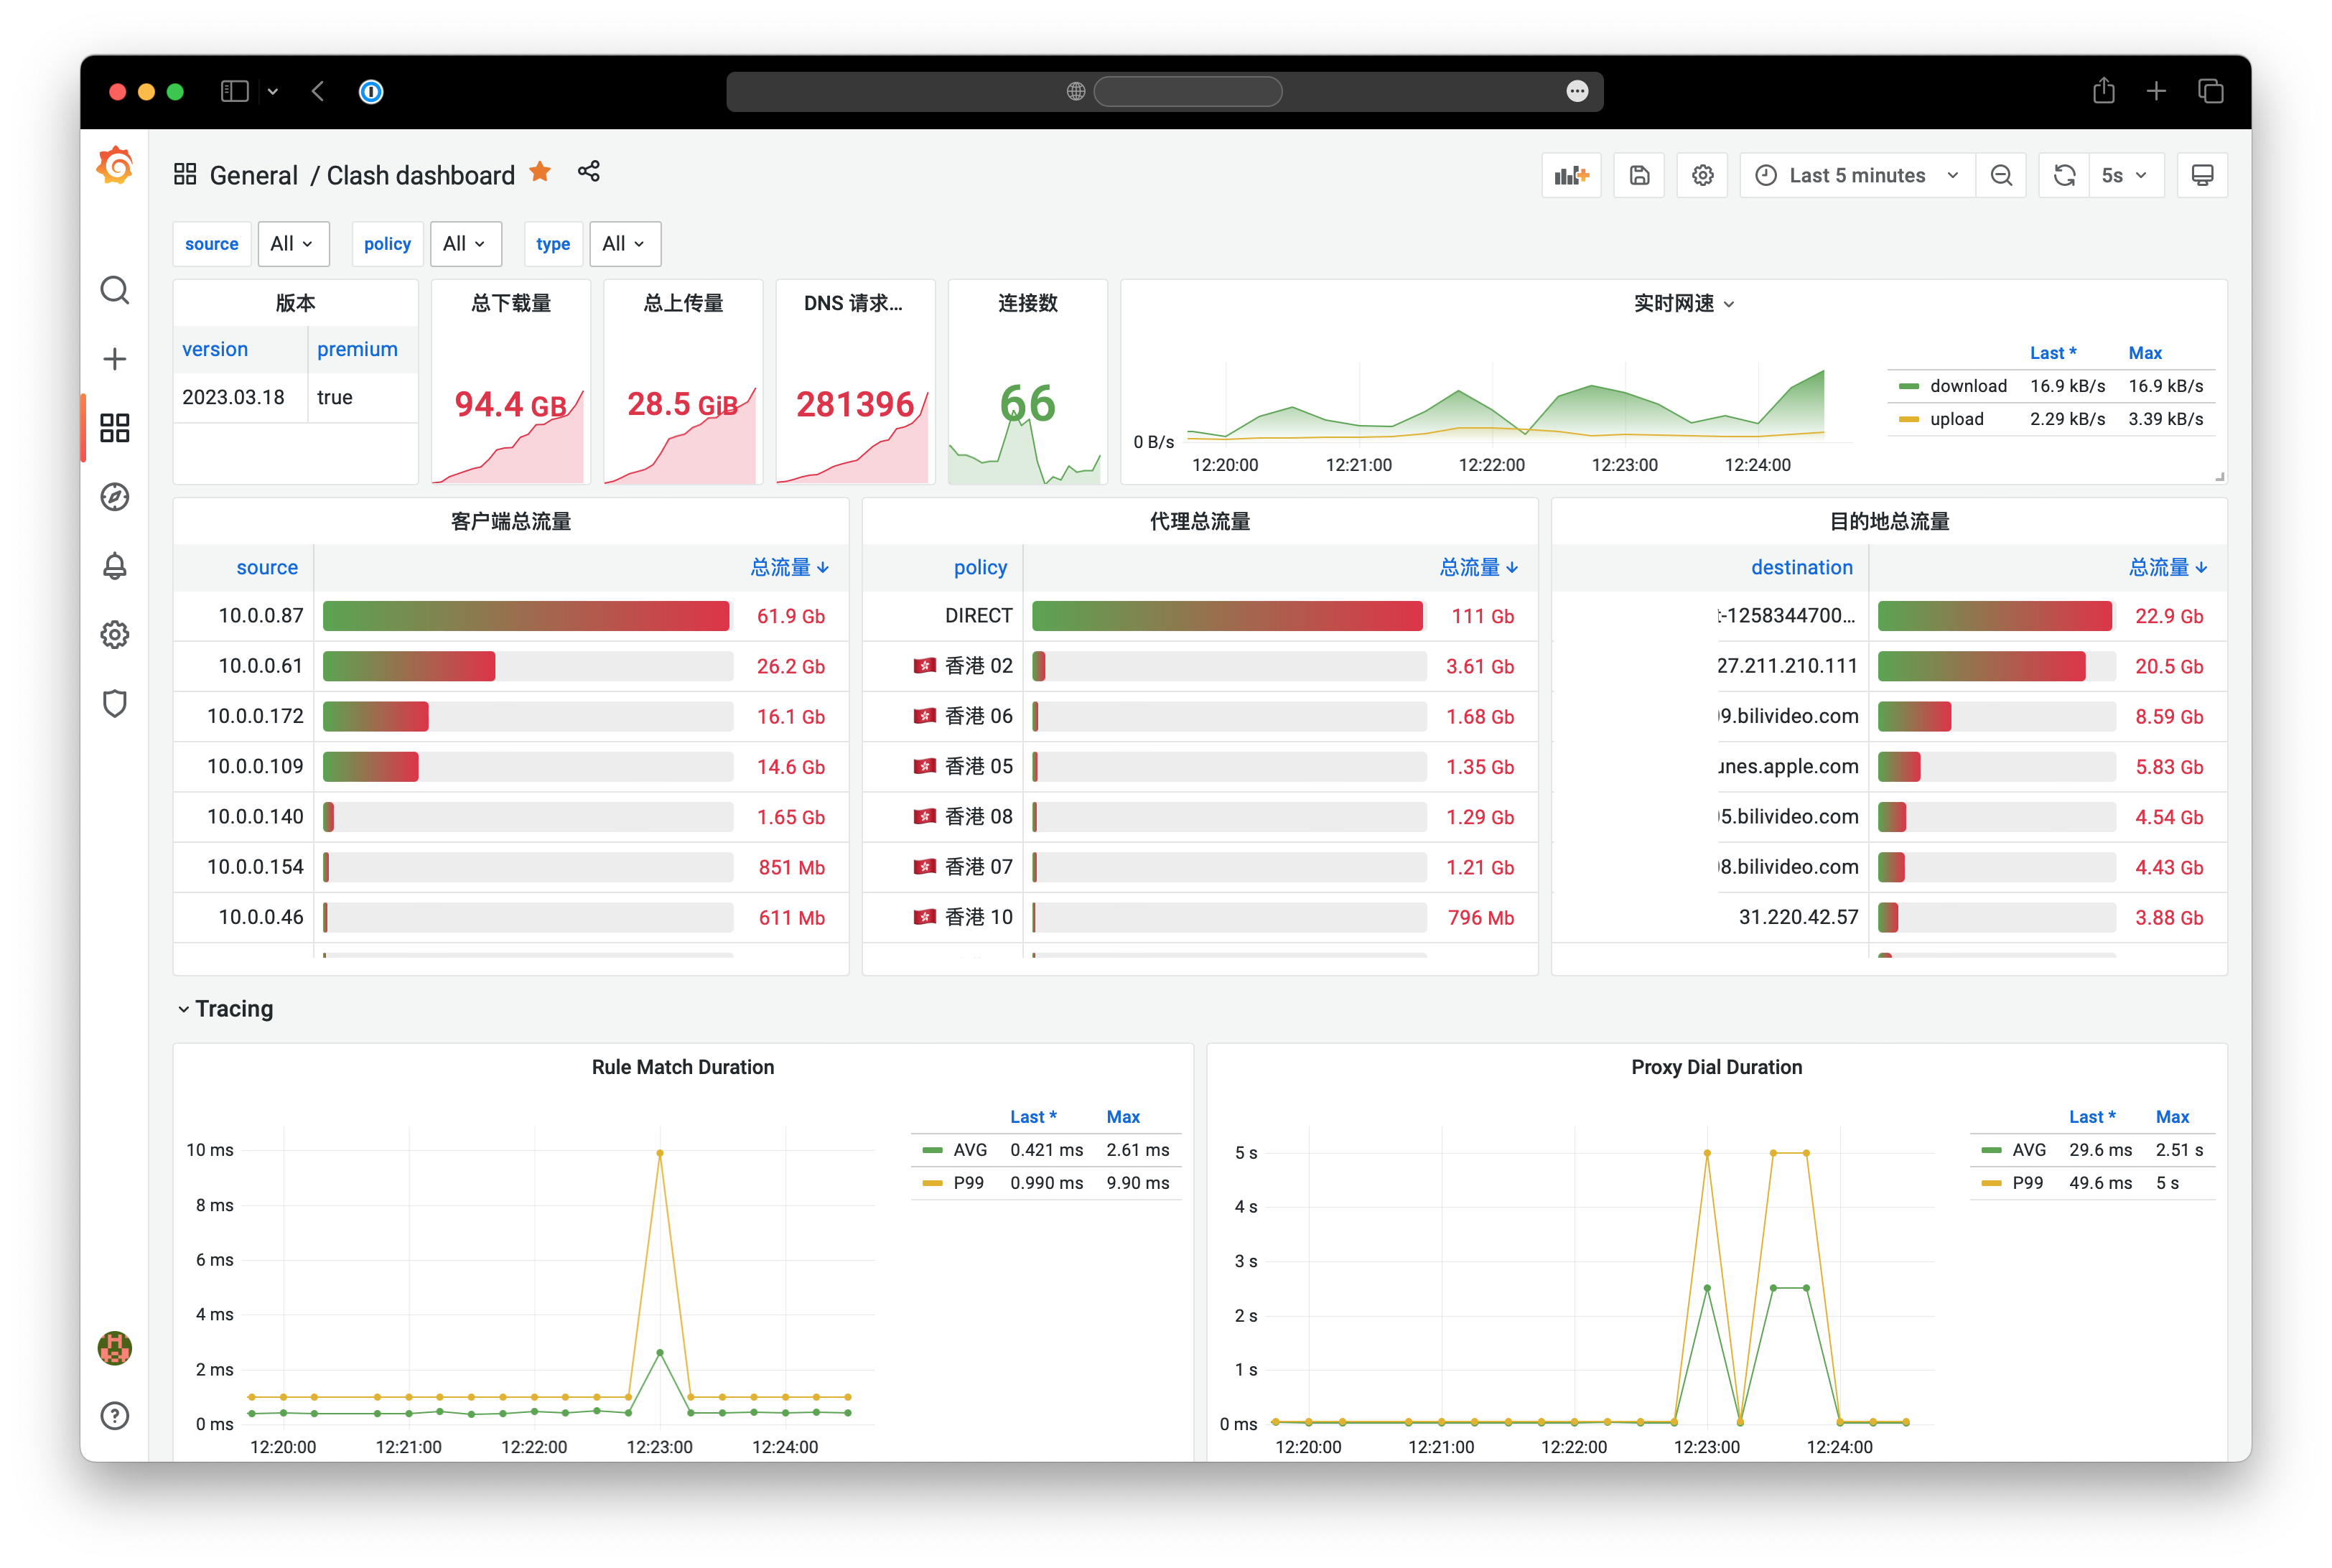
This is an exporter for Clash, for used by the Prometheus to monitor clash network traffic.
- Alternative Panel
dashboard-alternative.json

➜  ./clash-exporter -h
Usage of ./clash-exporter:
  -collectDest
        enable collector dest
        Warning: if collector destination enabled, will generate a large number of metrics, which may put a lot of pressure on Prometheus. (default true)
  -collectTracing
        enable collector tracing.
        It must be the Clash premium version, and the profile.tracing must be enabled in the Clash configuration file. (default false)
  -port int
        port to listen on (default 2112)
CLASH_HOST=127.0.0.1:9090
CLASH_TOKEN=pass
docker run -d --name clash-exporter -p 2112:2112 -e CLASH_HOST="${CLASH_HOST}" -e CLASH_TOKEN="$CLASH_TOKEN" zzde/clash-exporter:latest
visit http://localhost:2112/metrics and configure prometheus to scrape this endpoint.
- job_name: "clash"
  metrics_path: /metrics
  scrape_interval: 1s
  static_configs:
- targets: ["127.0.0.1:2112"]-
You can import clash-dashboard.json to obtain the example effect, or you can create one yourself based on the following metrics introduction.
-
or Import via grafana.com with id
18530
| Metric name | Metric type | Labels |
|---|---|---|
| clash_info | Gauge | version, premium |
| clash_download_bytes_total | Gauge | |
| clash_upload_bytes_total | Gauge | |
| clash_active_connections | Gauge | |
| clash_network_traffic_bytes_total | Counter | source,destination(if enabled),policy,type(download,upload) |
| clash_tracing_rule_match_duration_milliseconds | Histogram | |
| clash_tracing_dns_request_duration_milliseconds | Histogram | type(dnsType) |
| clash_tracing_proxy_dial_duration_milliseconds | Histogram | policy |
-
tracing metrics is empty
- Required clash premium version
- Follow clash profile docs enable profile tracing
- Add
-collectTracing=trueflag in clash-exporter start script
-
high Prometheus Memory
This may be caused by the default enable of collector destination traffic, which can generate a large number of metrics. Try use
-collectDest=falsedisable it.
- dns query metrics
- proxy dial metrics
