This Demo highlights the Analysis capabilities of Keptn. The demo includes a sample app containing a simple service (simple-go-service),
which is to be deployed into two different stages (dev and production).
During the deployment of the app, several post deployment tasks will be executed:
- The pre-deployment check of the
Applicationwill ensure that the monitoring service (Prometheus) is up and running. - The post deployment task of the
Workloadwill make sure the prometheus target of the deployed service is available before proceeding with the app post deployment tasks. - The post deployment task of the
Applicationwill generate some load on the deployed app, to get some monitoring data we can analyse afterwards. - The promotion task of the
Applicationin thedevstage will create a pull request on this repository to promote the deployed version into the next stage (production).
In addition to the app deployment (which can be done either via argo or directly via helm), the demo includes an AnalysisDefintion for analysing the response time and error rate of
the workload within the application. The analysis can be demonstrated either via the kubectl CLI or via the web UI included in this demo.
The following prerequisites are required and will not be installed automatically by the setup scripts of this demo:
- Kubernetes Cluster: This demo has been tested with Kind (v0.20.0) on a v1.27.3 Kubernetes cluster.
- ArgoCD CLI: Follow the installation instructions here
- Github API Token: To demonstrate the promotion task, you need a GitHub API Token with the permission to read and trigger actions. It is recommended to use a fine grained token with access to only this repository.
Once all requirements mentioned above are met, the cluster can be prepared for the demo using the following command:
make installThis will install Prometheus, Grafana, Jaeger and the Demo UI. Those Services can then be accessed using the make port-forward-... commands in the Makefile.
The most interesting services to access for this demo are:
- Argo: Can be accessed using
make port-forward-argo. The UI will ask for credentials, which can be retrieved withmake argo-login. - Demo UI: This UI serves as a convenient tool to showcase the Analysis features after the the demo app has been deployed. Can be accessed with
make port-forward-demo-ui.
If Argo should be used for this demo, make sure the target repository for the app is correct one. This will not be the case, if the upstream repository for this demo will be forked from this demo. If required, the upstream git repo for the sample application can be modified in ./support/argo/config/app.yaml.
Once that is set up, the Argo app can be deployed using the following command:
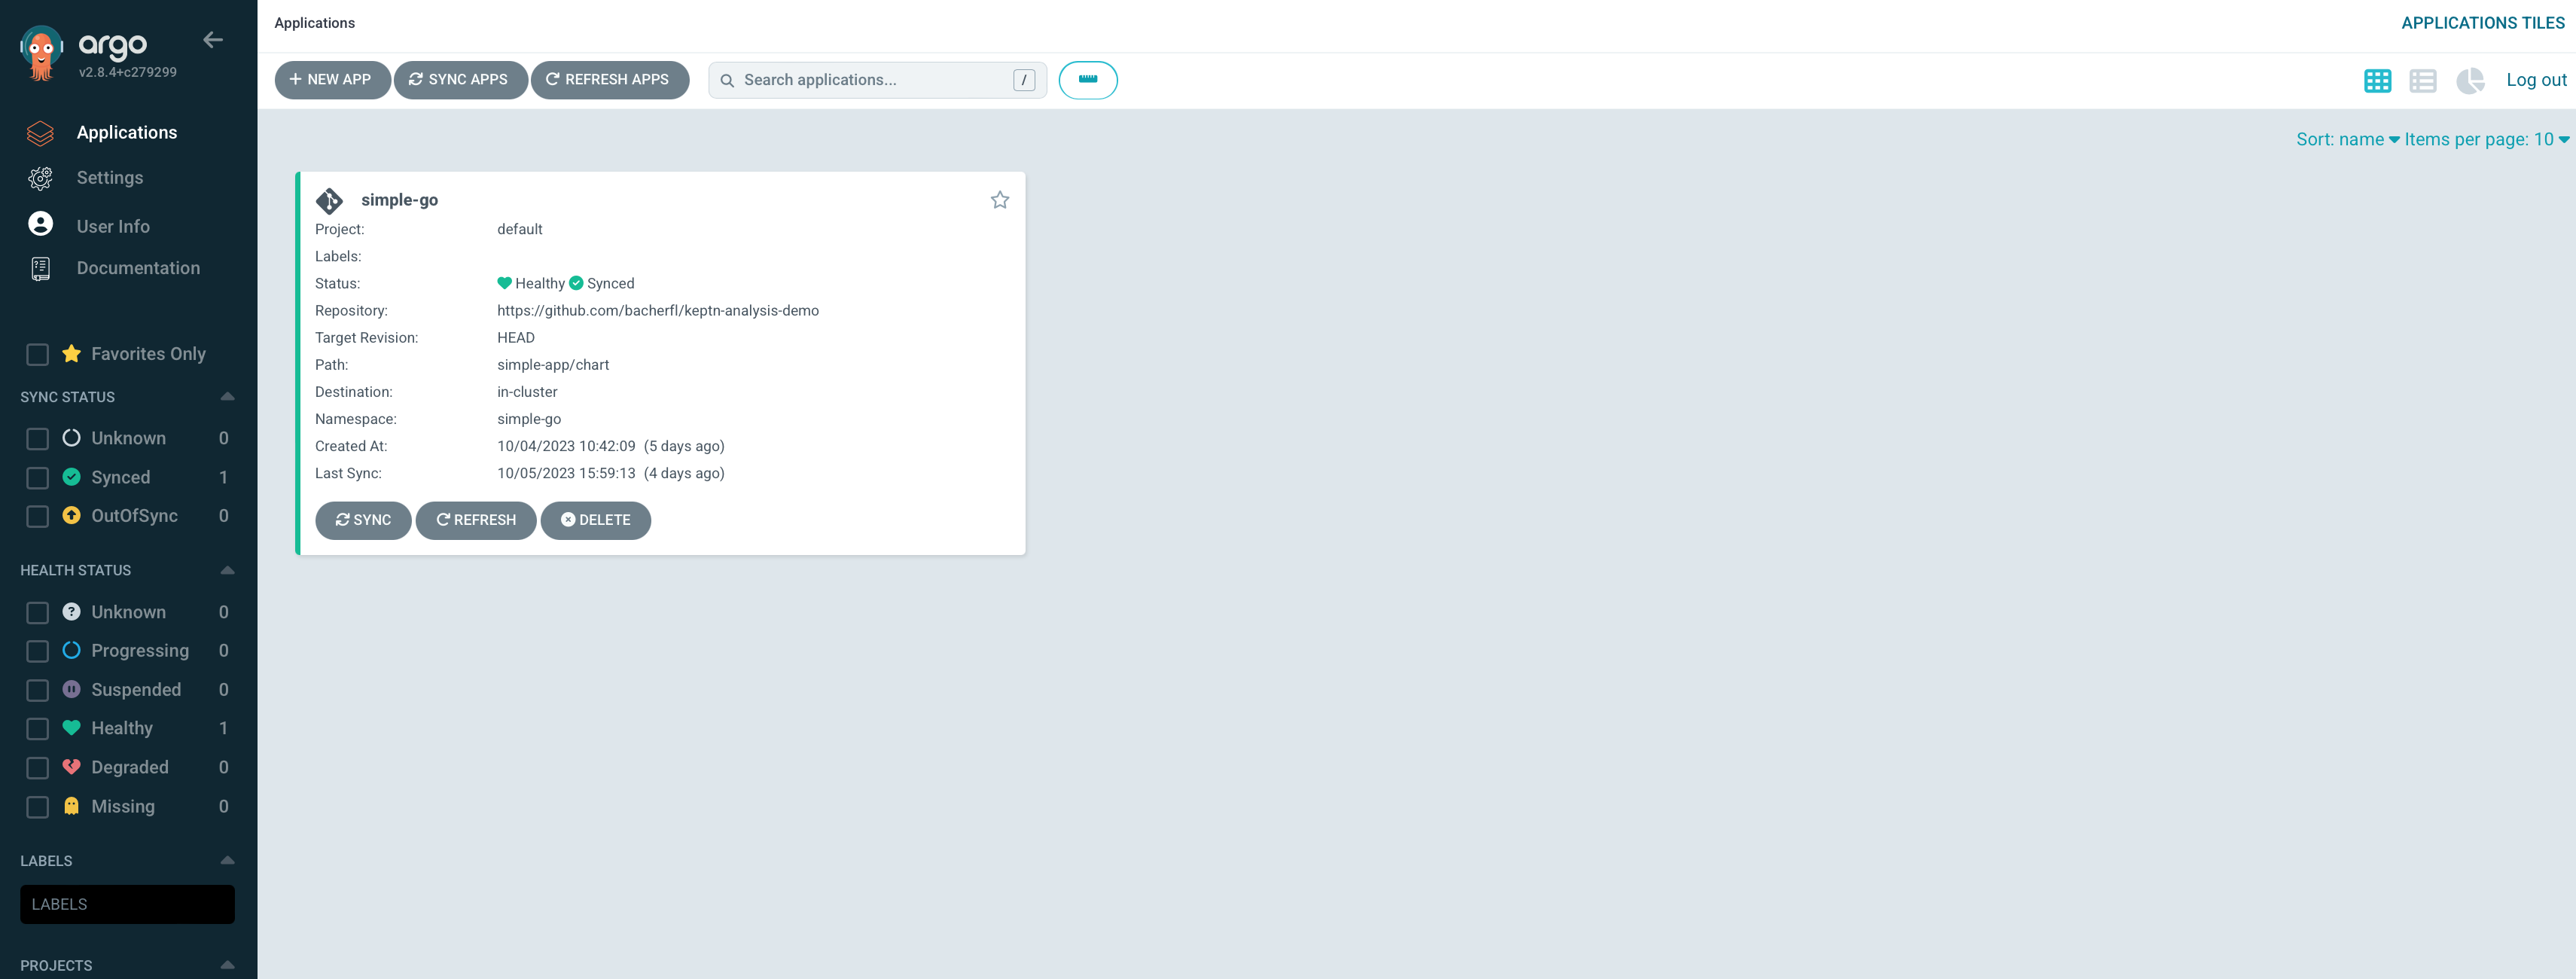
make argo-install-simple-goEventually, the app will be visible on the argo UI
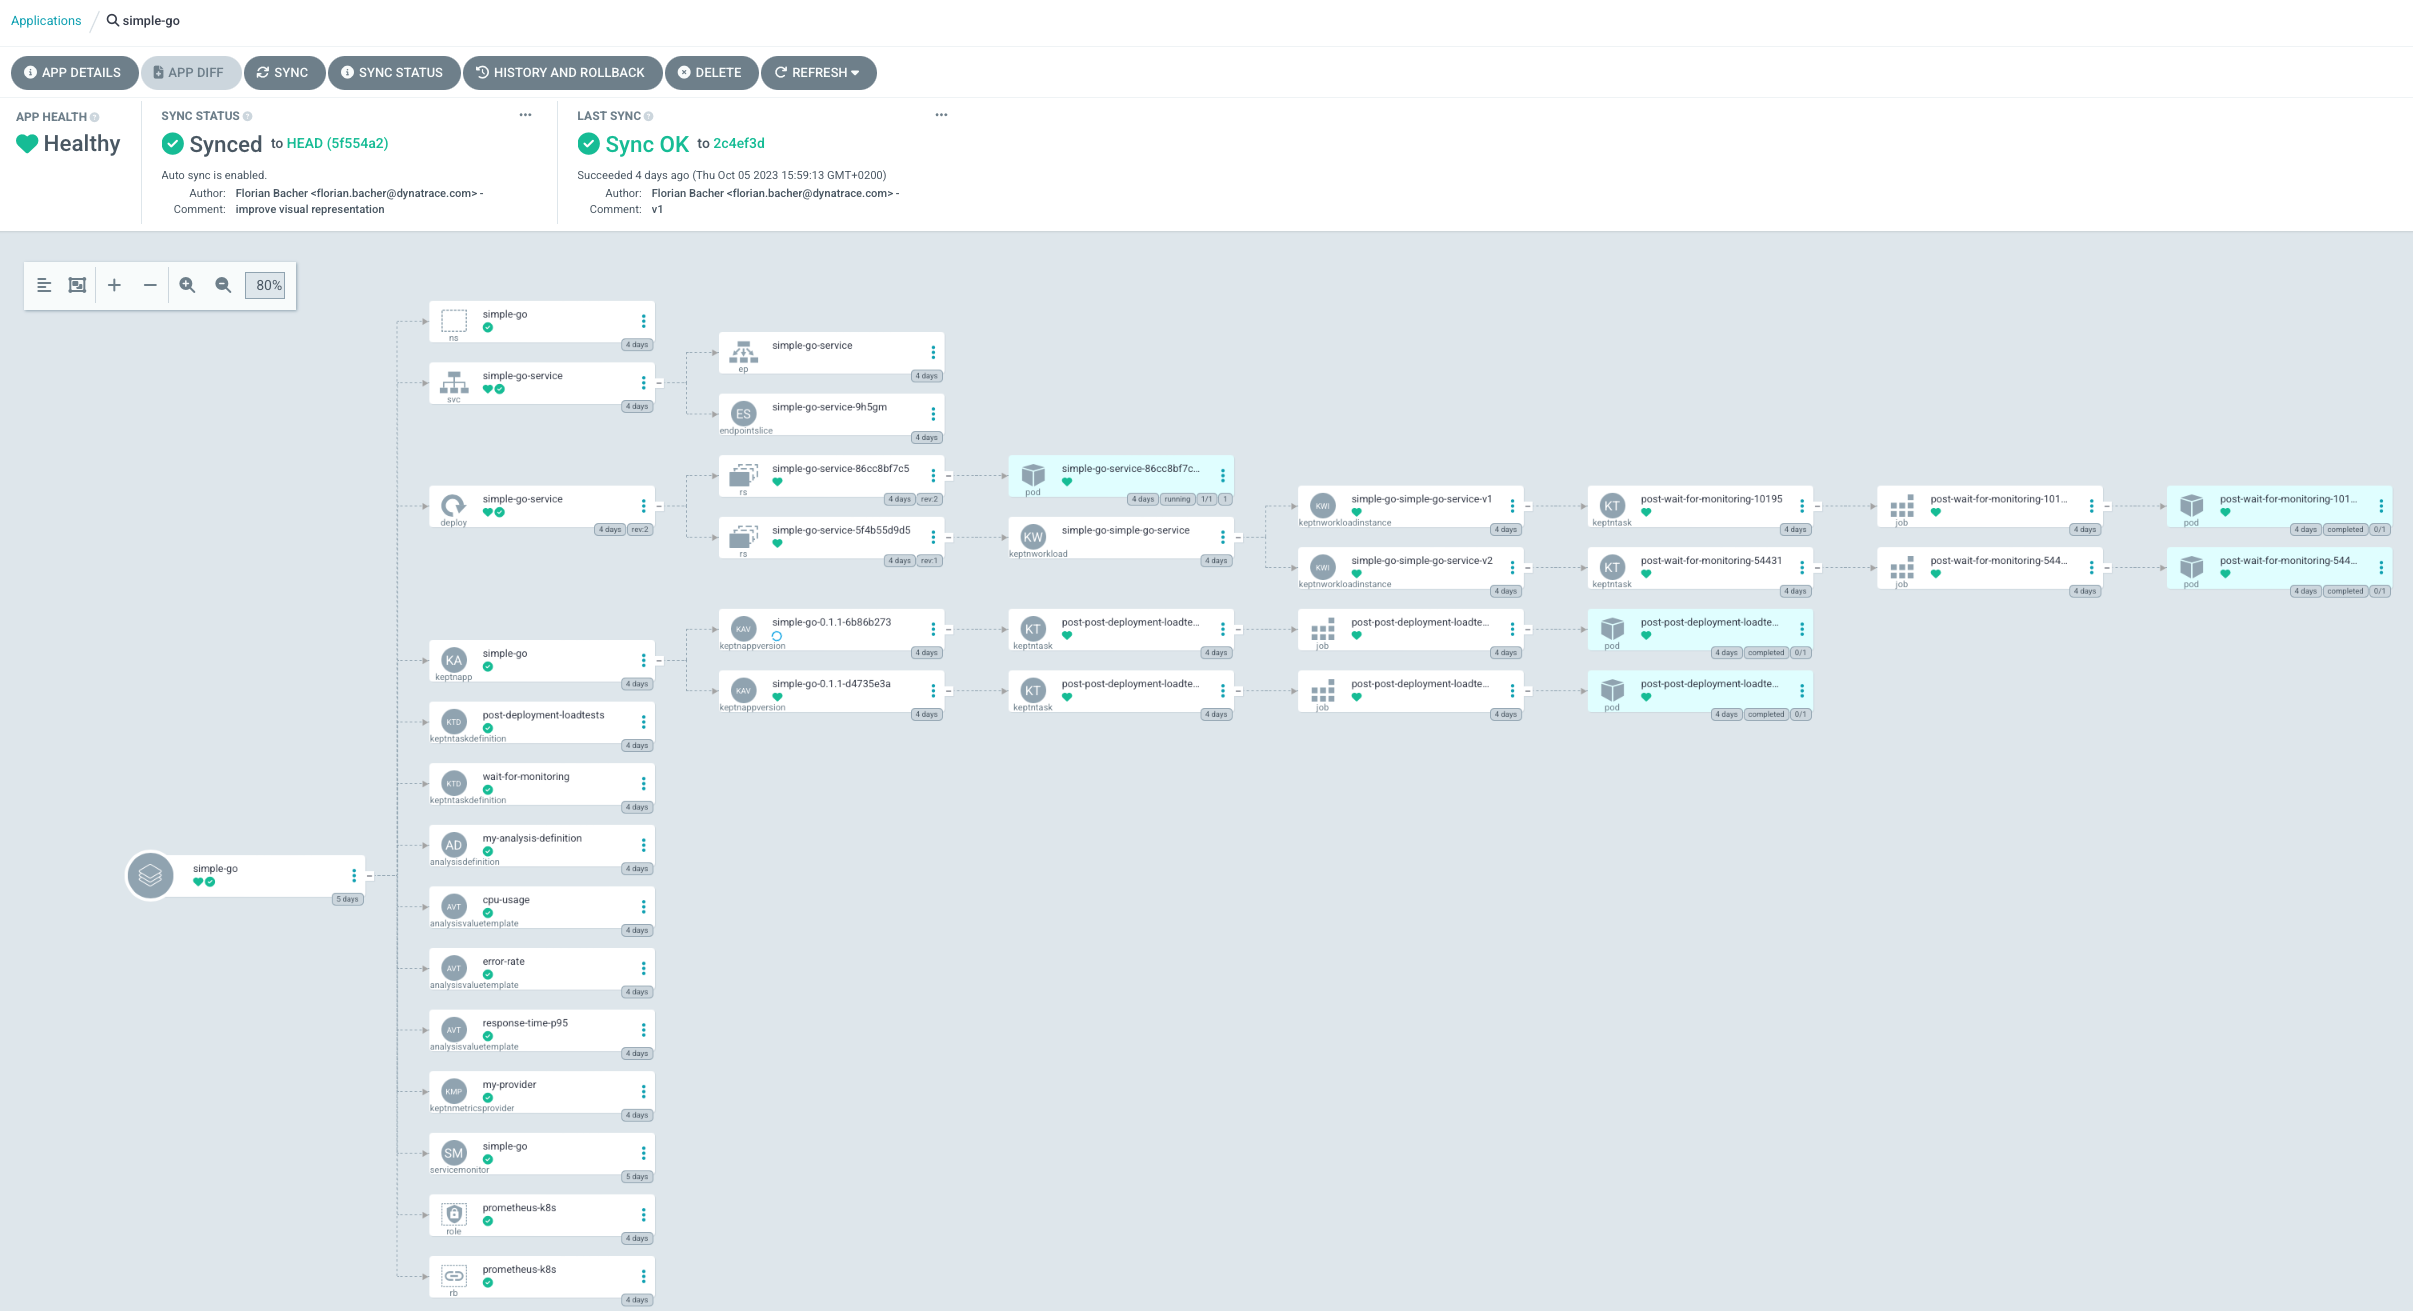
When selecting that application in the UI, the current state of the deployment will be displayed:
Here you will find an overview of how the deployment is coming along. The most interesting aspects here are the post deployment tasks for the workload and application.
NOTE: In the initial deployment, the promotion task running in the dev stage will fail, to to the secret containing the GitHub API token not being available in the namespace that has just been created.
For any further deployments, i.e. after updating the helm value for the service version, you can create the required secret using the following make command:
make create-github-token-secret GH_API_TOKEN="<insert token here>" GH_REPO_OWNER="<your git user or organization | default=bacherfl>" GH_REPO="<name of the repo used as GitOps upstream | default=keptn-analysis-demo>" If you are not using a fork of this repository, you do not need to provide the GH_REPO_OWNER and GH_REPO parameters.
Argo will also keep observing the upstream repo for any changes in the application configuration.
For example, the values.yaml file in ./simple-app/chart-dev/values.yaml contains a parameter called serviceVersion, which can be set to the following values:
v1to deploy a normally working version of the demo service.v2to deploy a slow version of the demo service.
After making the changes in the chart for the dev-stage, the deployment of the updated application will begin,
and all the pre/post-deployment tasks will be executed again.
If everything has been successful, the promotion task will create a PR to this repository, in which it will
update the serviceVersion value in the production
helm chart (./simple-app/chart/prod/values.yaml) to the same version that has just been deployed into dev.
Merging the PR will then cause ArgoCD to apply those changes in the simple-go-prod namespace and deploy the updated
application.
Once everything is deployed, it is time to show the Analysis feature.
To trigger an Analysis, you can either apply the manifest found in ./simple-app/analysis-instance (which is a good
way of showcasing the emphasis on controlling everything with custom resources), or with the demo UI included in this demo.
The UI can be accessed as follows:
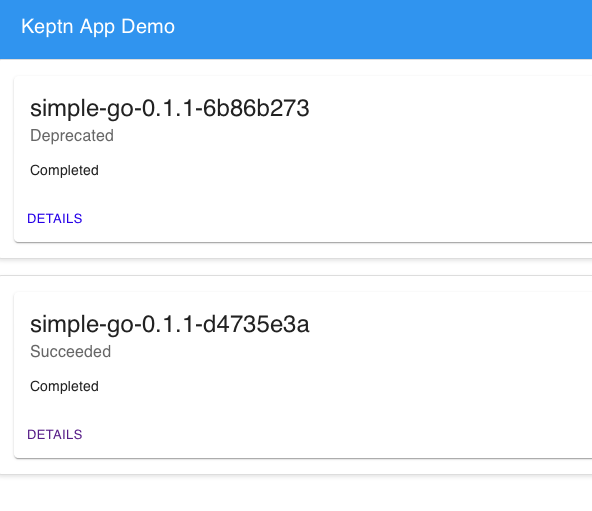
make port-forward-uiWHen navigating to the UI, you will be greeted with a list of KeptnAppVersions within the simple-go namespace, including some general info on their current state. Please note that there is no auto-reload implemented currently,
so manual refresh is required if the AppVersions are currently being deployed.
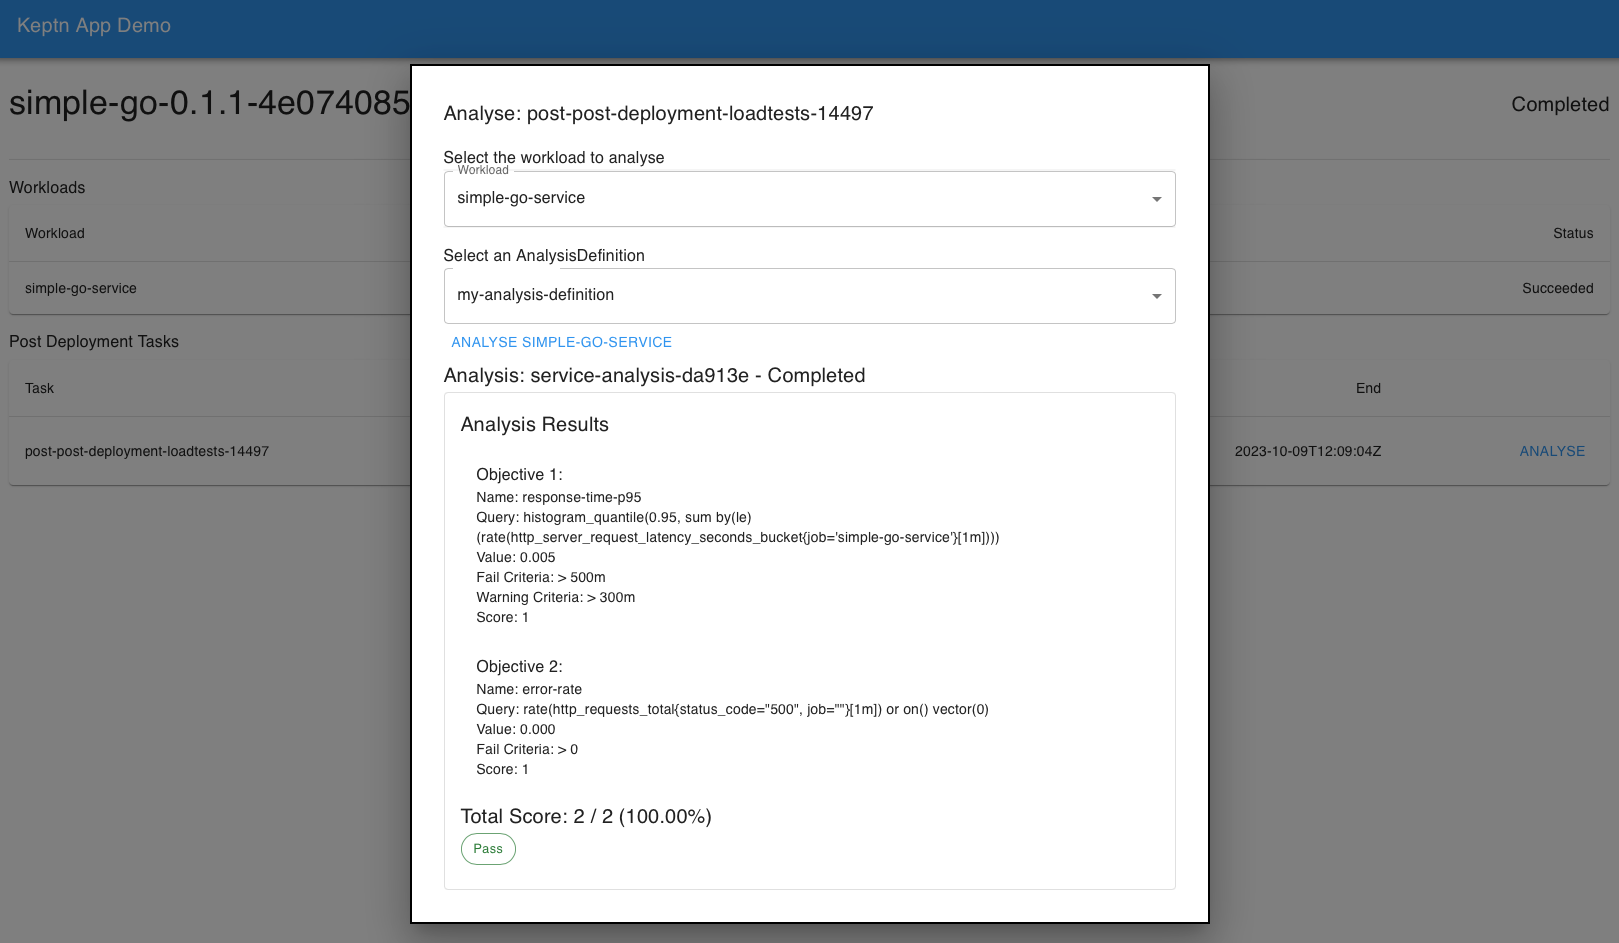
When clicking on one of those, you will be redirected to the details of that KeptnAppVersions, where you will also see the workloads that are part of the app, as well as post-deployment tasks that have been executed. Note: Currently only post-deployment tasks will be displayed, as onle those are defined in the demo, and the UI is tailored to this.
Next to the post deployment task (the load tests) you will find an Analyse button, which will guide you through
the process of triggering an Analysis. For this, you will need to select the workload and the AnalysisDefinition
to be used for the analysis. An AnalysisDefinition for evaluating the response time and error rate of the deployed service is included in this demo, but can be extended as desired.
Once the created Analysis is finished, the UI will display its results, containing the actual queries used for the retrieval of values, and the values themselves:


