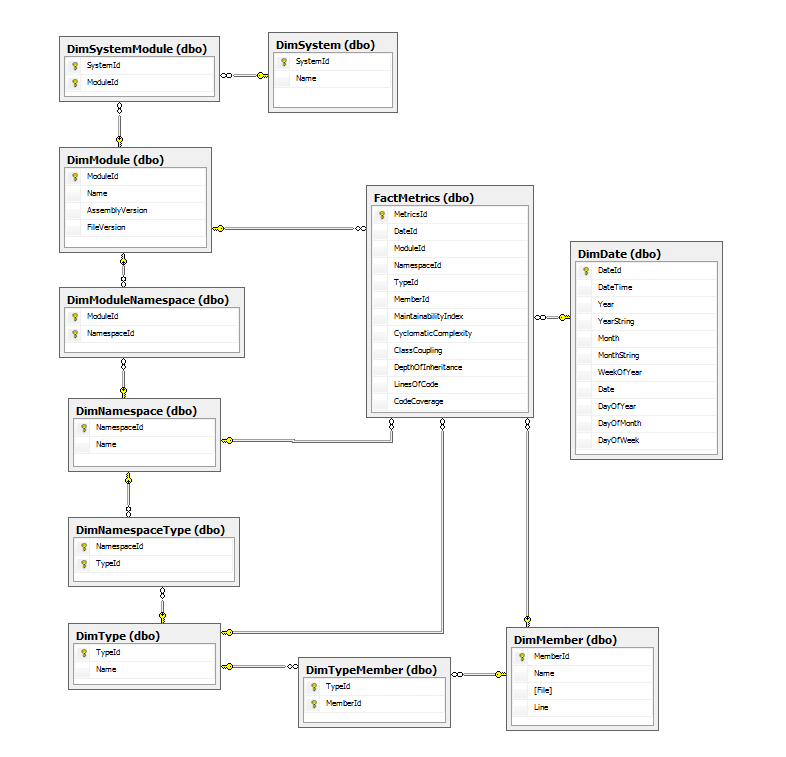
#Static Code Analysis Metrics Visual Studio provides maintainability index, cyclomatic complexity, class coupling, depth of inheritance and lines of code metrics. These metrics can be exported to Excel, but often there is a need for a deeper analysis such as indientifing the worst methods accross the large number of targets, analyze code metrics trends or share the metrics accross multiple teams.
Microsoft provides command line power tool which generates metrics XML file for the given target. Code metrics loader utility parses this file and loads it into code metrics warehousing where the metrics can be queried or drive SSAS cube which in turn can be analyzed by variety of different clients.
#Code Coverage Another important code quality metrics is code coverage which is ratio of lines of code executed during unit test run to total lines of code number. Code coverage is typically groupped by module, namespace, type and member.
Since code coverage is provided in higher SKUs of Visual Studio and TFS, popular alternative is OpenCover. Open Cover is an open source code coverage tool for .Net which is often integrated into Jenkins (CI integratino tool). Just like static code analysis Microsoft power tool, Open Cover reports results in XML file. This utility merges these two groups of metrics and loads them into database.
#Database If you have database create permissions the new database will be initialized during first code run, otherwise database tables should be created manually. The best way to get the latest database schema is to install EF Power Tool. Then right-click on LoaderContext file, View Entity Model SQL.
#How to use it First grab Microsoft Metrics Power Tool and install it.
Then generate metrics xml for some dll with
metrics.exe /f:myfile.dll /o:metrics.xml
Run code metrics loader utility with
CodeMetricsLoader.exe --m metrics.xml --t myrepo-master
You can pass connection string in --c parameter. If you don't then LocalDb will be used (LocalDb)\v11.0
If you have code coverage results generated by Open Cover, specify this file during load:
CodeMetricsLoader.exe --m metrics.xml --c codecoverage.xml --t myrepo-master
Results are shown on my Code Quality Portal which in addition to static code analysis metrics and code churn also has an area for code churn.
#A few helpful queries
-- Top 10 worst methods
select top 10 dm.Name, fm.MaintainabilityIndex, fm.CyclomaticComplexity, fm.LinesOfCode
from FactMetrics fm
join DimDate dd on dd.DateId = fm.DateId
join DimMember dm on dm.MemberId = fm.MemberId
join DimModule dmo on dmo.ModuleId = fm.ModuleId
where dmo.Name like '%WebServices.dll' and dd.DayOfMonth = 25
order by fm.MaintainabilityIndex desc

-- Module over time
select top 10 dd.[Date], fm.MaintainabilityIndex, fm.CyclomaticComplexity, fm.ClassCoupling,  fm.DepthOfInheritance, fm.LinesOfCode
from FactMetrics fm
join DimDate dd on dd.DateId = fm.DateId
join DimModule dmo on dmo.ModuleId = fm.ModuleId
where dmo.Name like '%Account.dll'
order by dd.[Date] desc

-- Run stats
select dm.Name, fm.MaintainabilityIndex, fm.LinesOfCode, fm.CyclomaticComplexity, fm.CodeCoverage
from factmetrics fm
join dimmodule dm on dm.moduleid = fm.moduleid
where fm.dateid = [ID]
and fm.moduleid is not null and fm.namespaceid is null and typeid is null and memberid is null
order by fm.MaintainabilityIndex
