This is a fork of GEF with 3 major improvements.
- Added many heuristic commands for kernel debugging WITHOUT a symbolized vmlinux (for qemu-system; linux kernel 3.x ~ 6.11.x).
- Added support for many architectures (for qemu-user).
- Added some heap dump commands for various allocators.
Many other commands have been added and improved. Enjoy!
- Tested on ubuntu 24.04.
- It may work on ubuntu 22.04 - 23.10.
- It might work on ubuntu 20.04 - 21.10, but not recommended.
- Run following commands as root user.
# Ubuntu 23.04 or later restrict global installation of python packages with pip3.
# So you need --break-system-packages option.
wget -q https://raw.githubusercontent.com/bata24/gef/dev/install.sh -O- | sed -e 's/pip3 install/pip3 install --break-system-packages/g' | sh

# Ubuntu 22.10 or before
wget -q https://raw.githubusercontent.com/bata24/gef/dev/install.sh -O- | sh
- Note
- To simplify the installation script, GEF (
gef.py) is installed to a fixed path (/root/.gdbinit-gef.py). - Also, it registers the GEF path to
/root/.gdbinit. - If you want to change the location or user, please modify both yourself.
- See docs/FAQ.md for more information and other install options.
- There is a way to install it using
venv. - There is a minimum installation that reduces installation as much as possible.
- There is a way to install it using
- To simplify the installation script, GEF (
python3 /root/.gdbinit-gef.py --upgraderm -f /root/.gdbinit-gef.py /root/.gef.rc
sed -i -e '/source \/root\/.gdbinit-gef.py/d' /root/.gdbinitSee install.sh or install-minimal.sh.
- Normal debugging
- Attach to the process
- Attach to the process in another namespace (e.g. attaching from outside of
docker) - Connect to
gdbserver - Connect to the gdb stub of
qemu-system - Connect to the gdb stub of
qemu-user - Connect to the gdb stub of
Intel Pin - Connect to the gdb stub of
Intel SDE - Connect to the gdb stub of
qiling framework - Connect to the gdb stub of
KGDB(need gdb 12~) - Connect to the gdb stub of
VMWare - Connect to the gdb stub of
wine - Record and replay debugging (
rr replay)
See docs/SUPPORTED-MODE.md for detail.
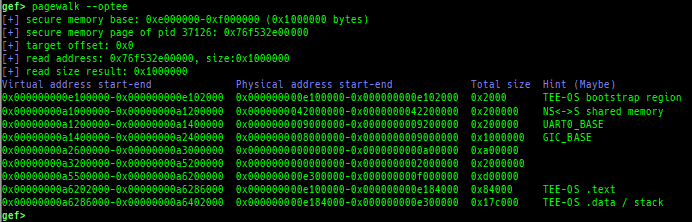
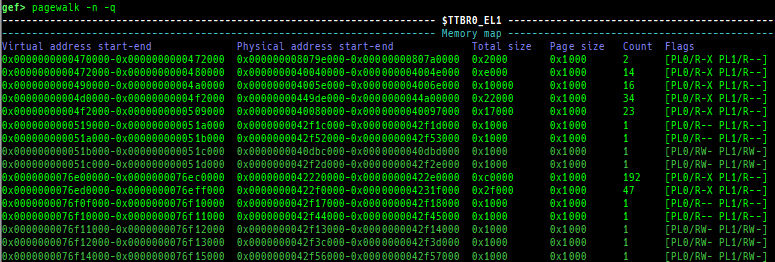
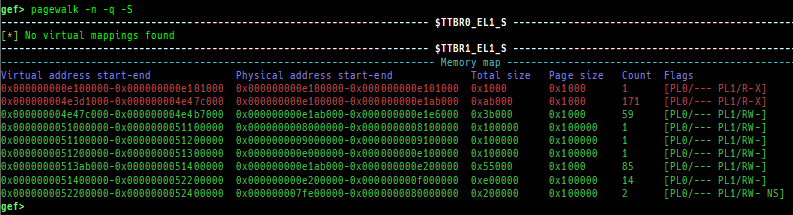
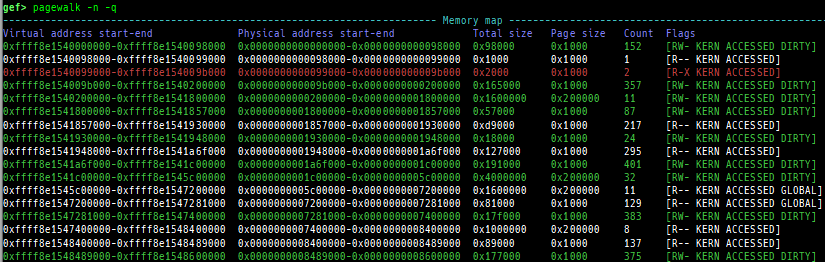
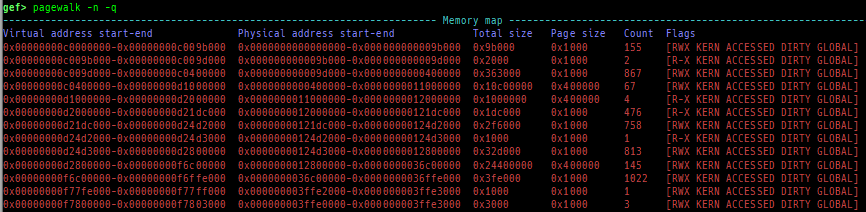
pagewalk: scans physical memory, parses page tables, and displays memory maps.- x64 (Supported: 4-Level/5-Level Paging)
- x86 (Supported: PAE/Non-PAE)
- ARM64 (Supported: only Cortex-A, EL0-EL3, stage1-2)
- ARM v8.7 base. 32bit mode is NOT supported.
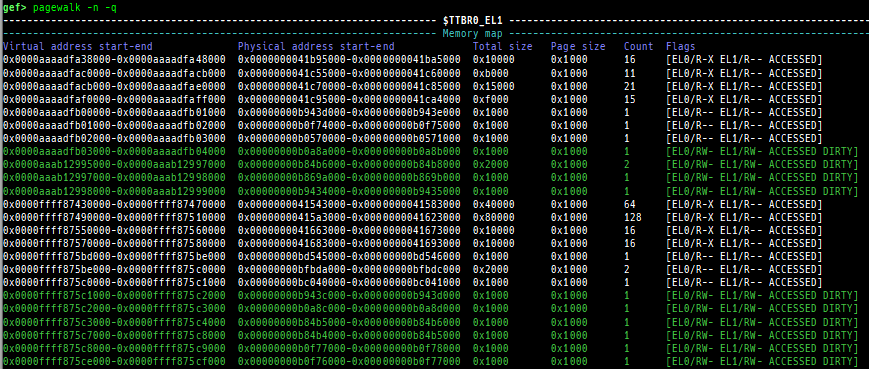
- Here is a sample of each level pagewalk from HITCON CTF 2018
super_hexagon. 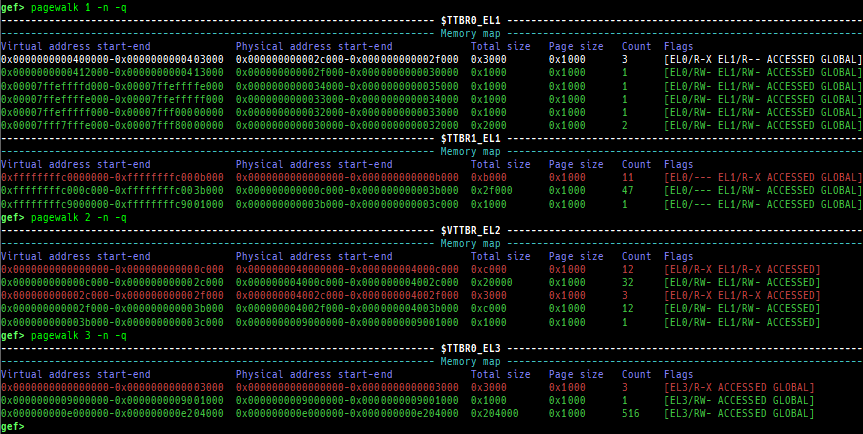
- Secure memory scanning is also supported, but you have to break in the secure world.
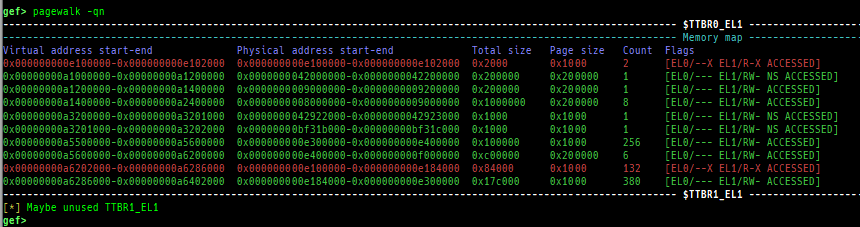
- Pseudo memory map without detailed flags and permission can be output even in the normal world (when OP-TEE).
- ARM (Supported: only Cortex-A, LPAE/Non-LPAE, PL0/PL1)
- ARM v7 base. PL2 is NOT supported.
- Secure memory scanning is also supported, and you don't have to break in the secure world (unlike ARM64).
- x64 (Supported: 4-Level/5-Level Paging)
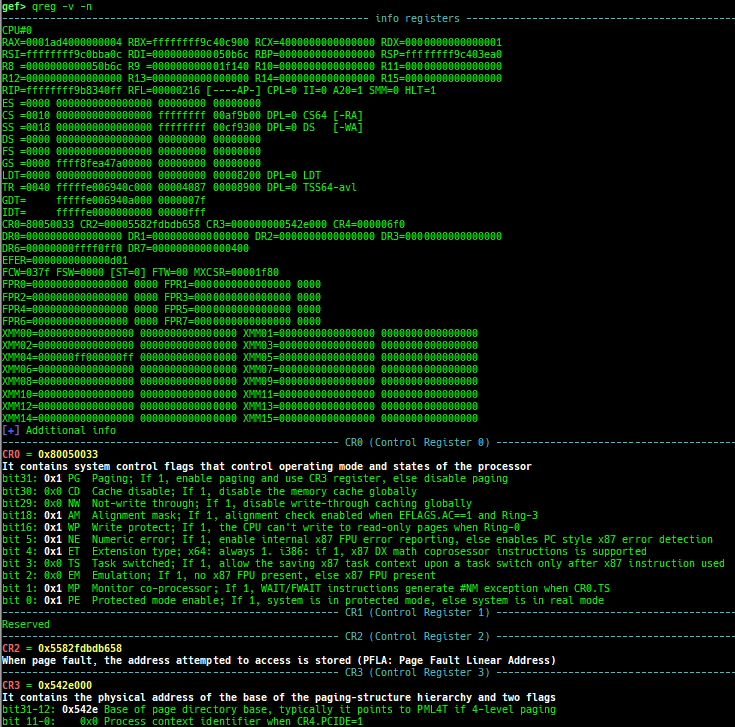
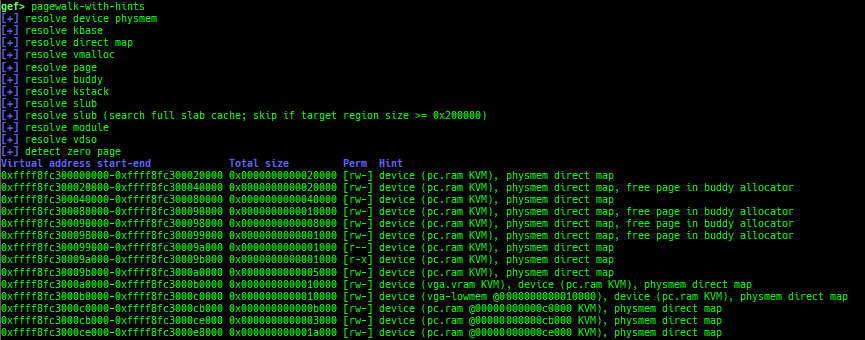
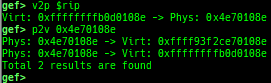
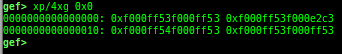
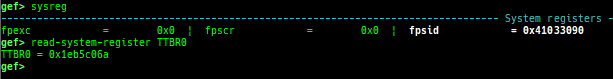
pagewalk-with-hints: prints pagetables with description.v2p/p2v: displays transformation virtual address <-> physical address.xp: is a shortcut for physical memory dump.qreg: displays the register values from qemu-monitor (allows to get like$cseven under qemu 2.x).- It is shortcut for
monitor info registers. - It also prints the details of the each bit of the system register when x64/x86.
- It is shortcut for
sysreg: pretty prints system registers.- It is the result of
info registerswith filtering general registers. 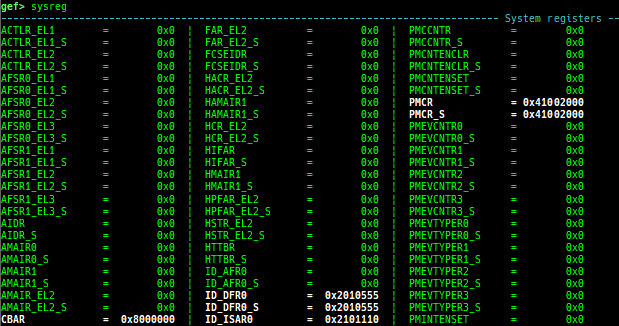
- It is the result of
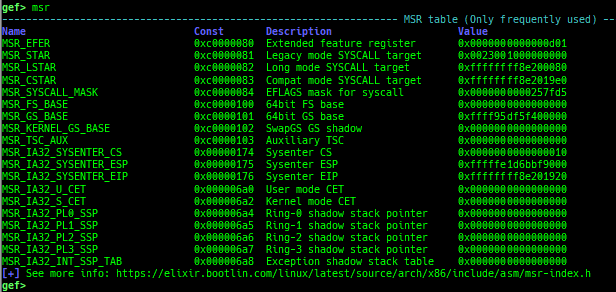
msr: reads/writes MSR (Model Specific Registers) value by embedding/executing dynamic assembly.- Supported on only x64 and x86.
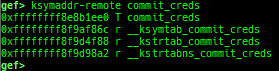
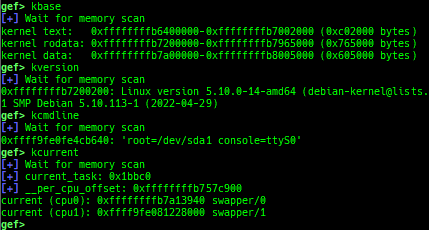
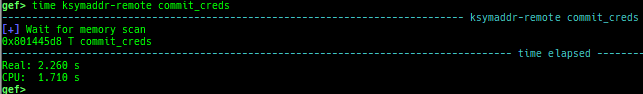
kbase: displays the kernel base address.kversion: displays the kernel version.kcmdline: displays the kernel cmdline used at boot time.kcurrent: displays current task address.ksymaddr-remote: displays kallsyms information from scanning kernel memory.- Supported kernel versions: 3.x to 6.11.x.
ksymaddr-remote-apply/vmlinux-to-elf-apply: applies kallsyms information obtained byksymaddr-remoteorvmlinux-to-elfto gdb.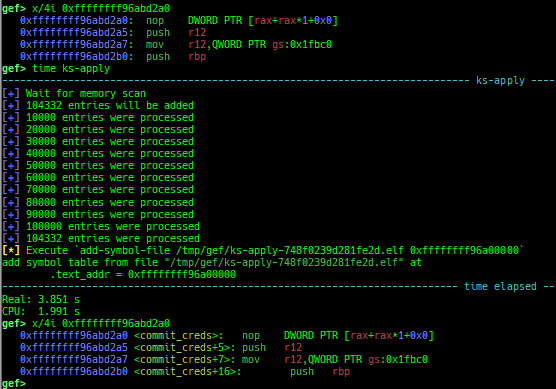
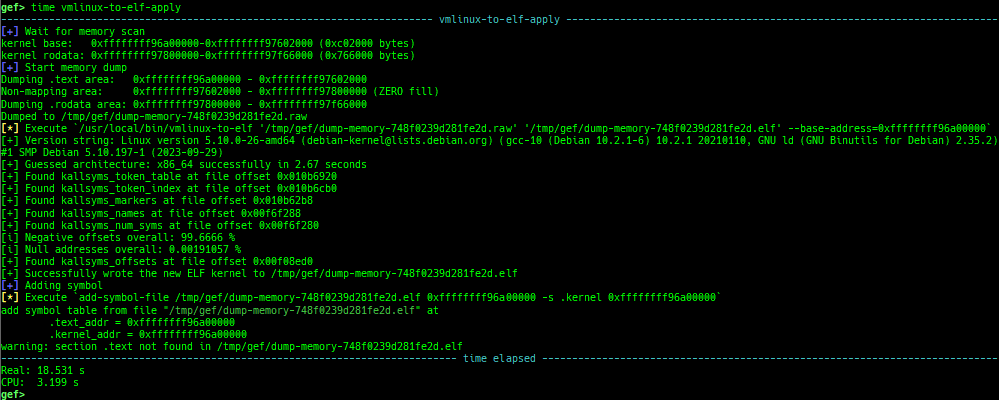
- Once you get symboled pseudo ELF file, you can reuse and apply it automatically even after rebooting qemu-system.
vmlinux-to-elf-applyandksymaddr-remote-applyprovide almost the same functionality.vmlinux-to-elf-apply: Requires installation of external tools. Createvmlinuxwith symbols.ksymaddr-remote-apply: Requires no external tools. Create an blank ELF with only embedded symbols.
slub-dump: dumps slub free-list.- Supported on x64/x86/ARM64/ARM +
SLUB+ no-symbol + kASLR. - Supported on both
CONFIG_SLAB_FREELIST_HARDENEDisyorn. - It supports to dump partial pages (
-v) and NUMA node pages (-vv). - Since
page_to_virtis difficult to implement, it will heuristically determine the virtual address from the free-list. 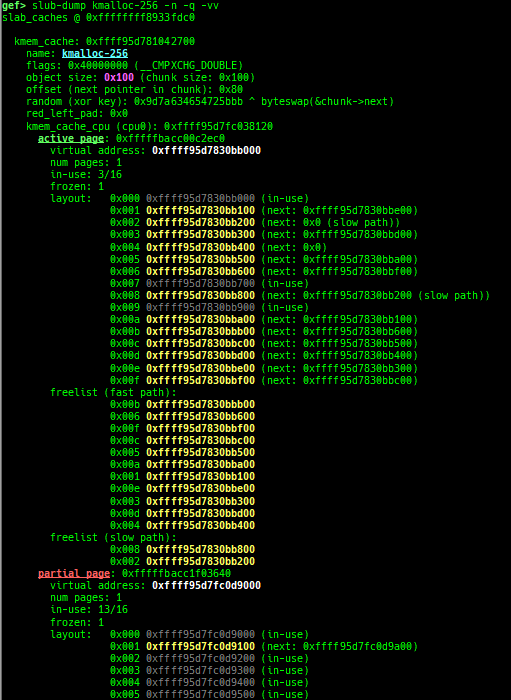
- Supported on x64/x86/ARM64/ARM +
slab-dump: dumps slab free-list.- Supported on x64/x86/ARM64/ARM +
SLAB+ no-symbol + kASLR. 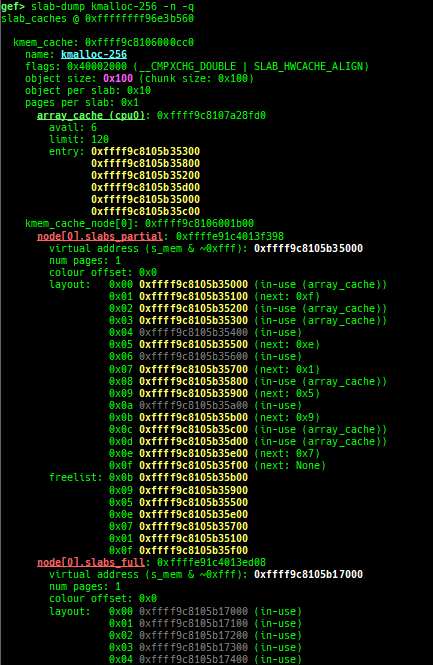
- Supported on x64/x86/ARM64/ARM +
slob-dump: dumps slob free-list.- Supported on x64/x86/ARM64/ARM +
SLOB+ no-symbol + kASLR. 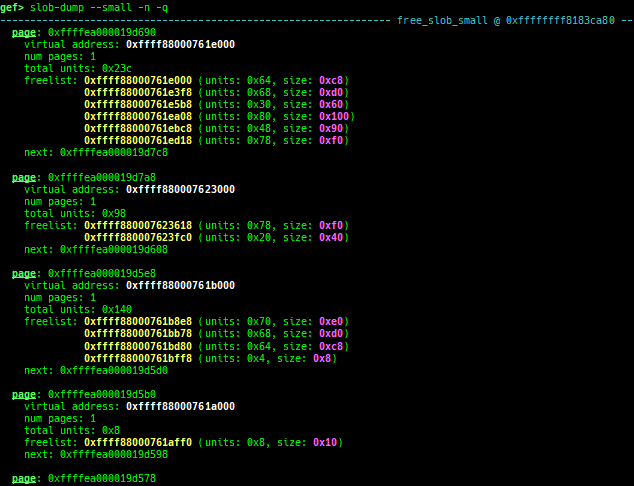
- Supported on x64/x86/ARM64/ARM +
slub-tiny-dump: dumps slub-tiny free-list.- Supported on x64/x86/ARM64/ARM +
SLUB-TINY+ no-symbol + kASLR. 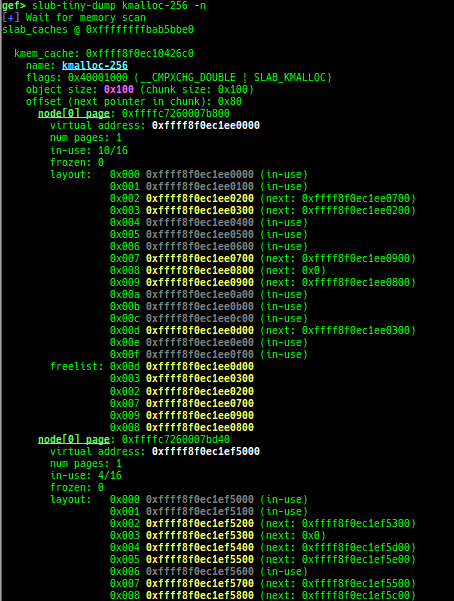
- Supported on x64/x86/ARM64/ARM +
slab-contains: resolves whichkmem_cachecertain address (object) belongs to (forSLUB/SLUB-TINY/SLAB).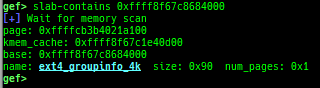
- For
SLUB/SLUB-TINY, if all chunks belonging to a certainpageare in use, they will not be displayed byslub-dump/slub-tiny-dumpcommand. - Even with such an address (object), this command may be able to resolve
kmem_cache.
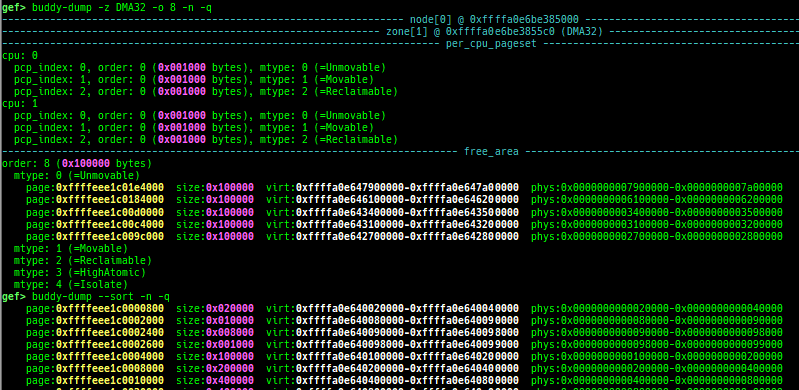
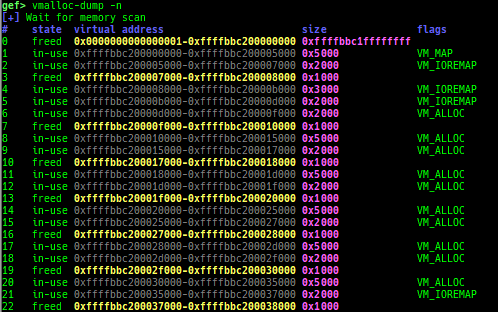
buddy-dump: dumps zone of page allocator (buddy allocator) free-list.vmalloc-dump: dumpsvmallocused-list and freed-list.page: displays transformationstruct page<-> virtual/physical address.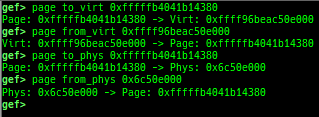
- There are shortcuts:
virt2page,page2virt,phys2pageandpage2phys.
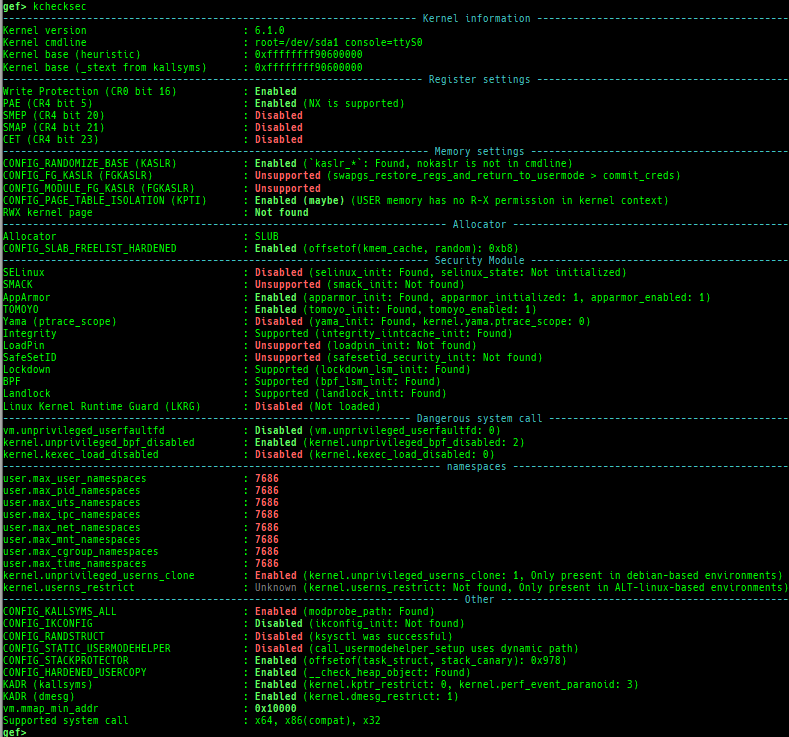
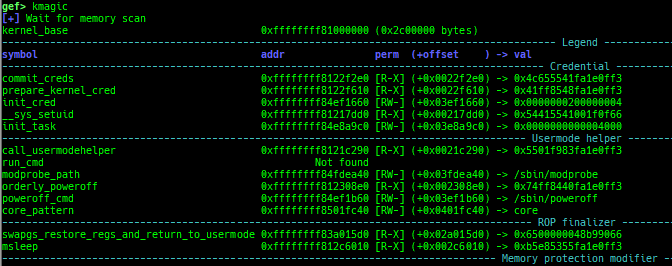
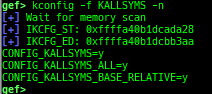
kchecksec: checks kernel security.kmagic: displays useful addresses in kernel.kconfig: dumps kernel config if available.syscall-table-view: displays system call table.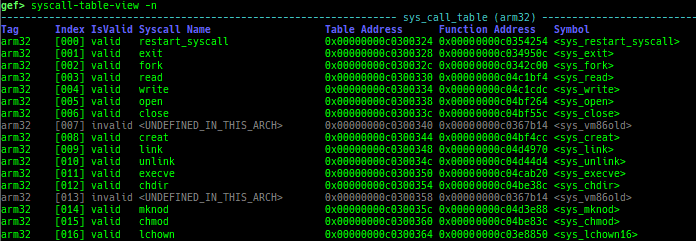
- It also dumps ia32/x32 syscall table under x64.
- It also dumps compat syscall table under ARM64.
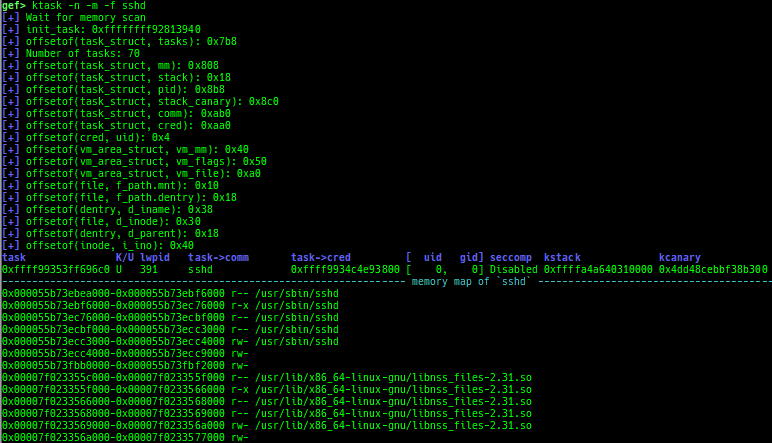
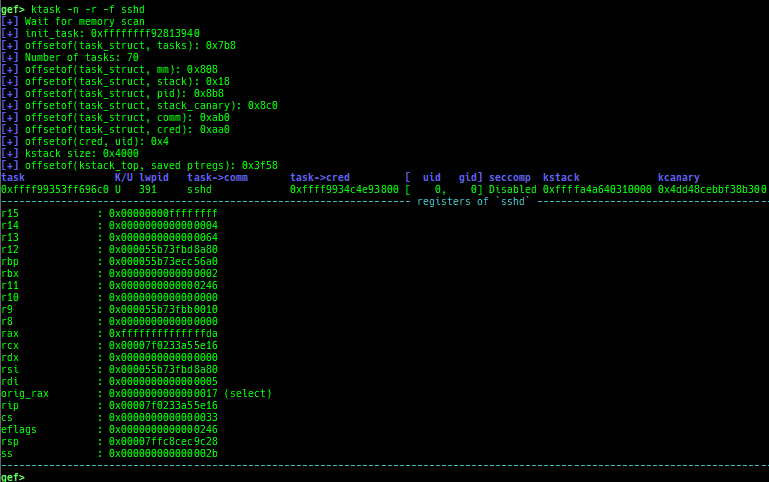
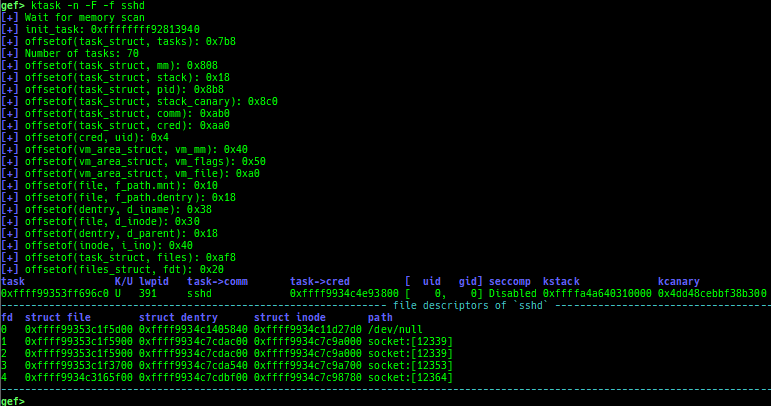
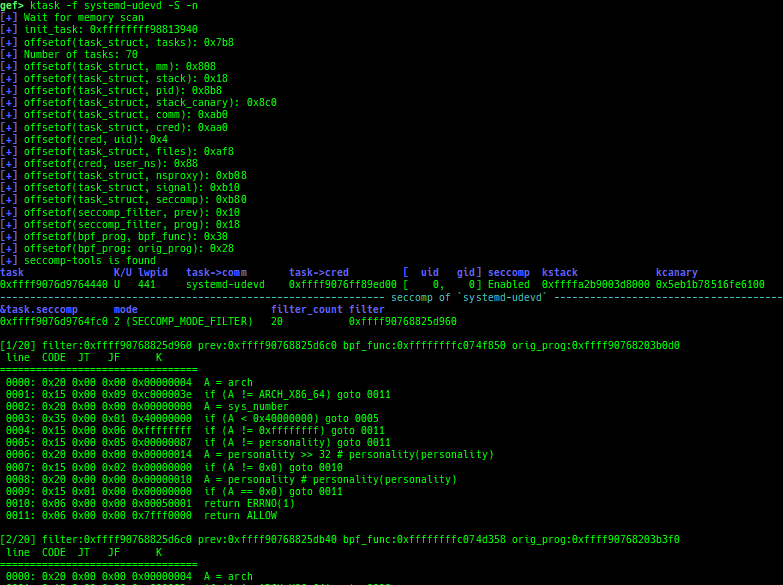
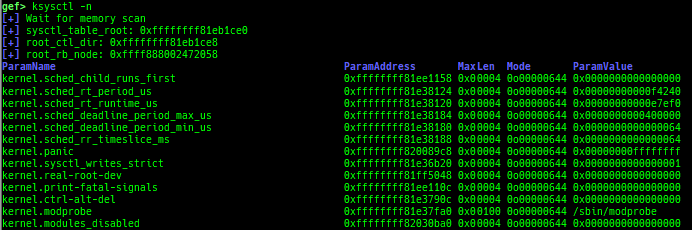
ksysctl: dumps sysctl parameters.ktask: displays each task address.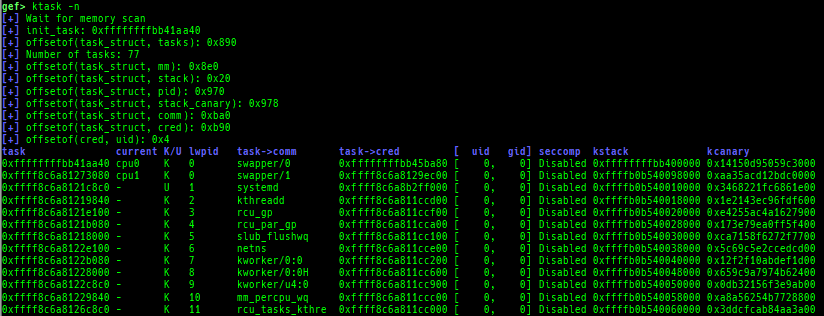
- It also displays the memory map of the userland process.
- It also displays the register values saved on kstack of the userland process.
- It also displays the file descriptors of the userland process.
- It also displays the signal handlers of the userland process.
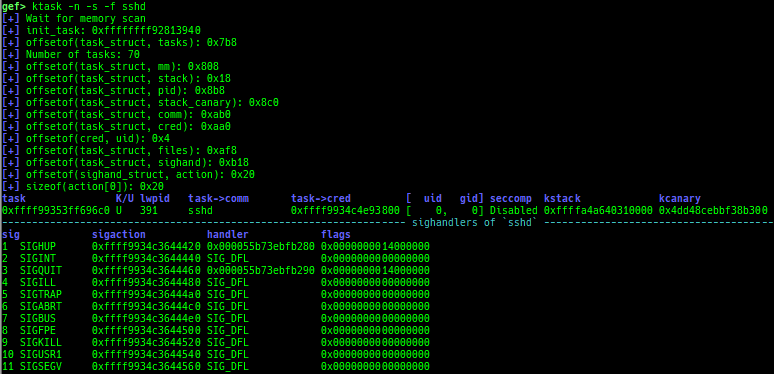
- It also displays the namespaces of the userland process.
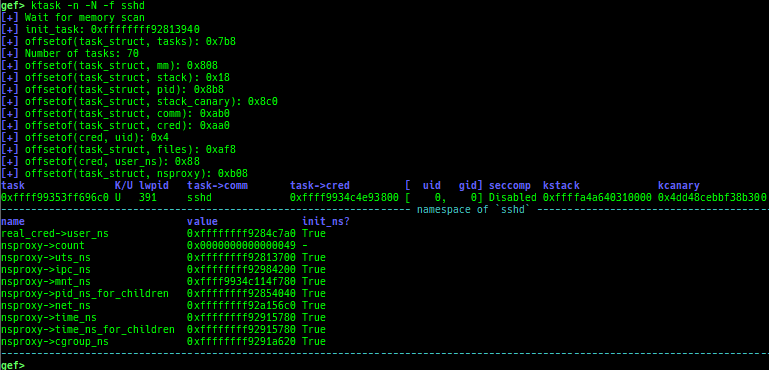
- It also displays the seccomp-filter.
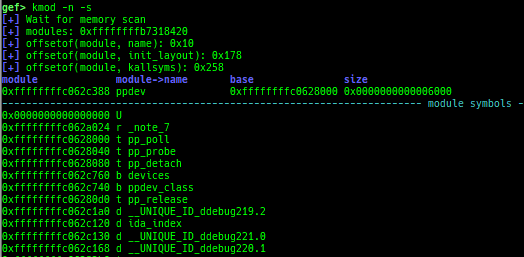
kmod: displays each module address.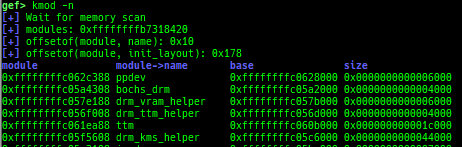
- It also displays each module symbols.
kload: loads vmlinux without loaded address.- It is useful if you have a vmlinux with debuginfo at hand.
kmod-load: loads the kernel module without loaded address.- It is useful if you have a kernel module with debuginfo at hand.
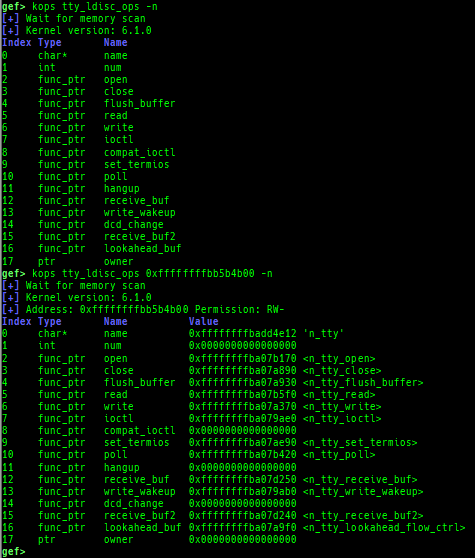
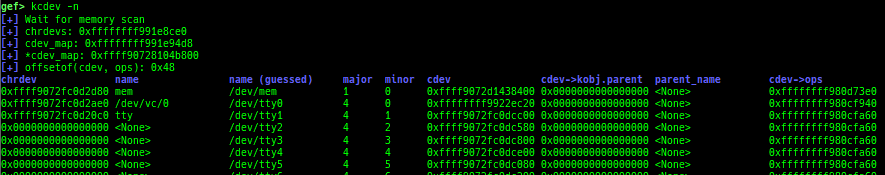
kops: displays each operations member.kcdev: displays each character device information.kbdev: displays each block device information.- If there are too many block devices, detection will not be successful.
- This is because block devices are not managed in one place, so I use the list of
bdev_cacheobtained from the slub-dump results. 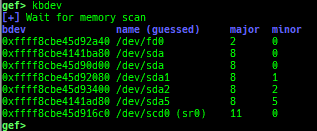
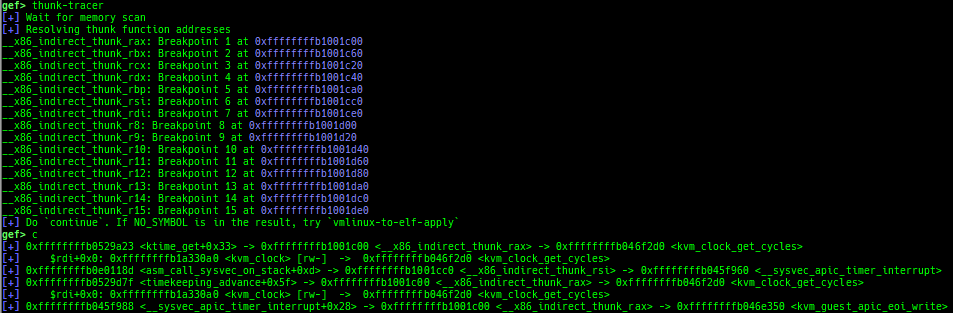
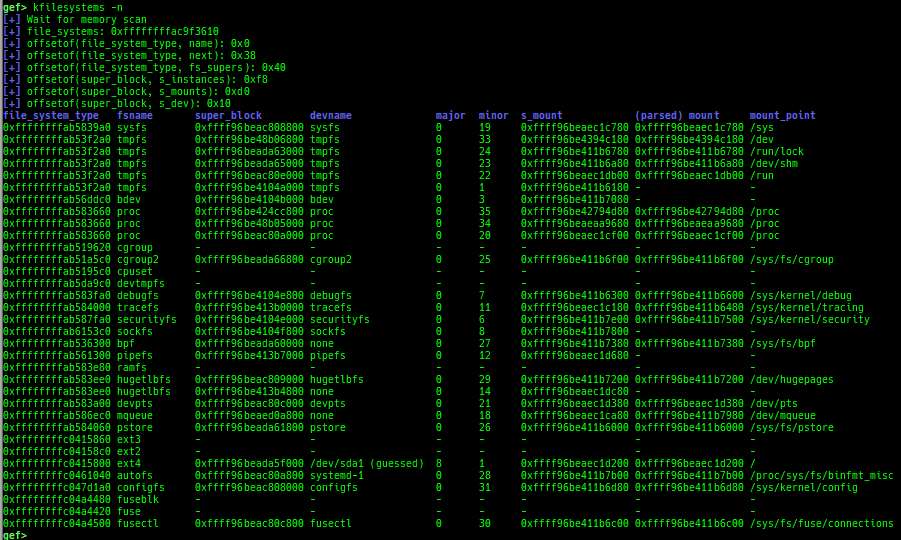
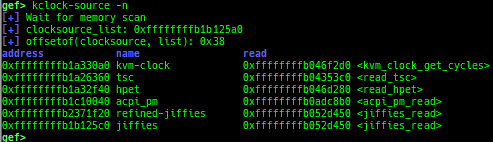
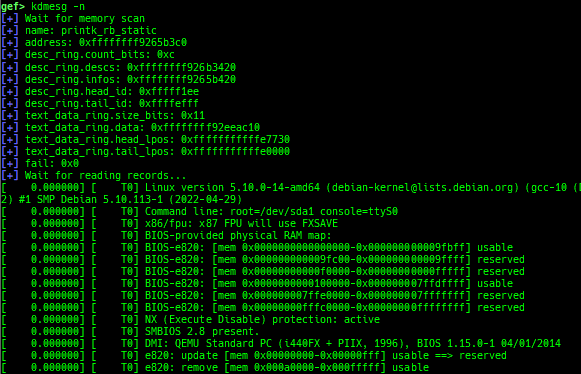
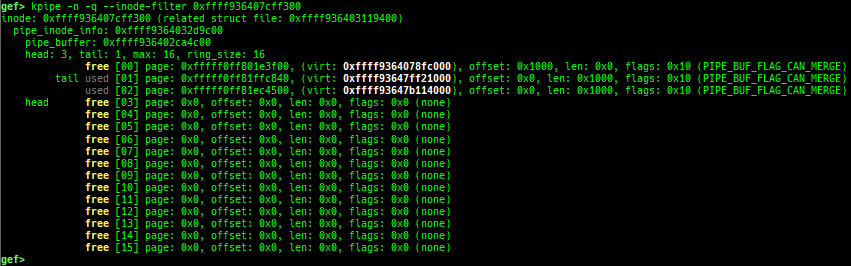
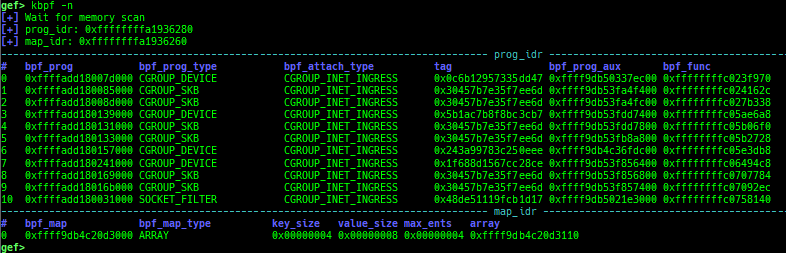
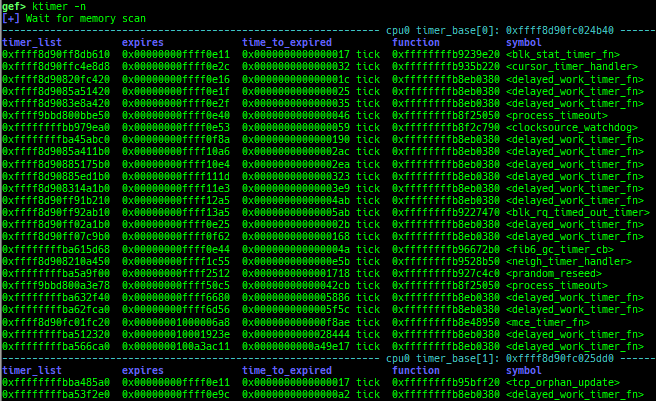
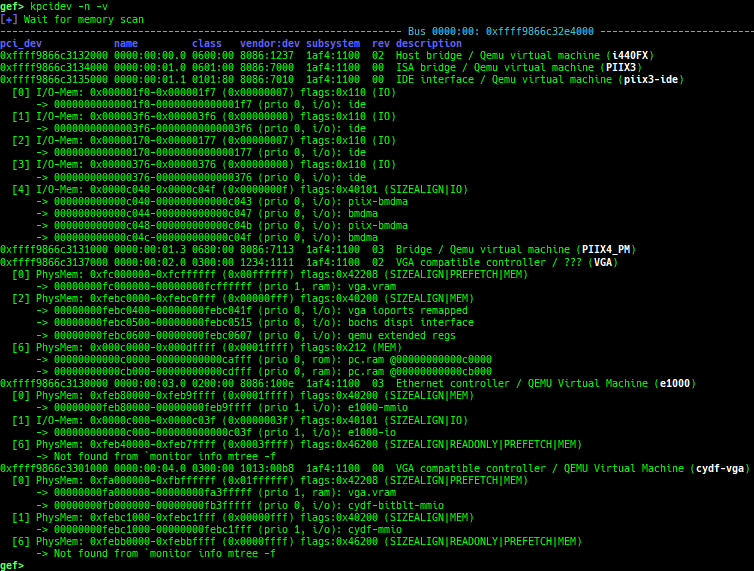
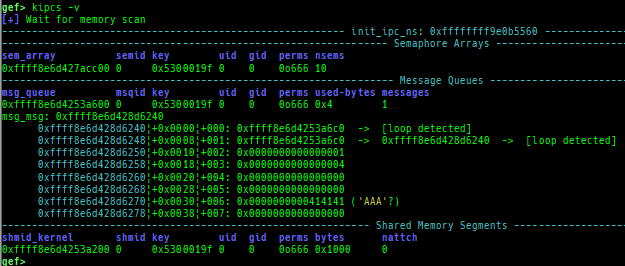
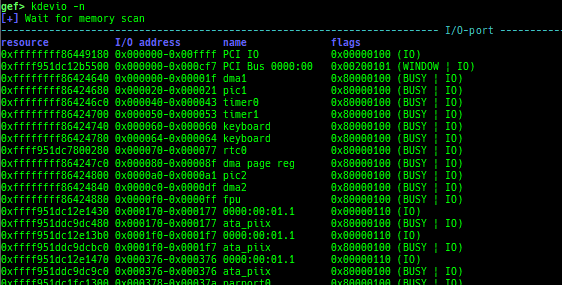
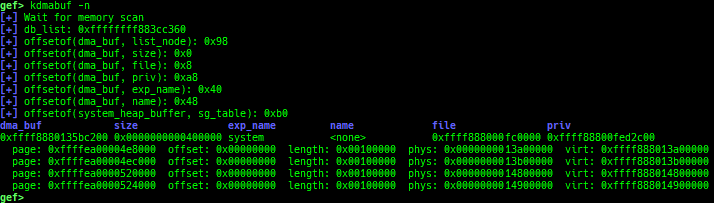
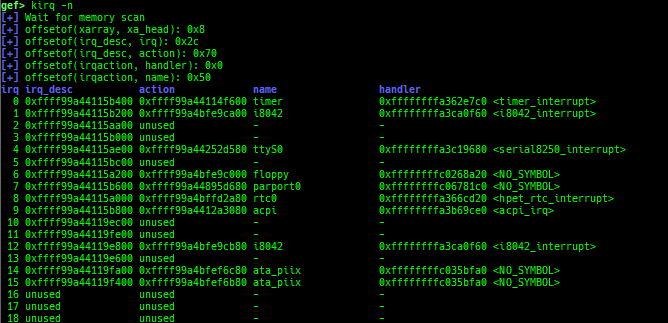
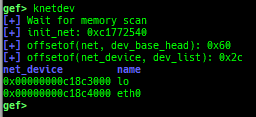
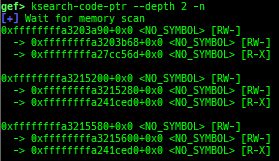
kfilesystems: dumps supported file systems.kclock-source: dumps clocksource list.kdmesg: dumps the ring buffer of dmesg area.kpipe: displays each pipe information.kbpf: dumps bpf information.ktimer: dumps timer.kpcidev: dumps PCI devices.kipcs: dumps IPCs information (System V semaphore, message queue and shared memory).kdevio: dumps I/O-port and I/O-memory information.kdmabuf: dumps DMA-BUF information.kirq: dumps irq information.knetdev: displays net devices.ksearch-code-ptr: searches the code pointer in kernel data area.thunk-tracer: collects and displays the thunk function addresses that are called automatically (only x64/x86).- If this address comes from RW area, this is useful for getting RIP.
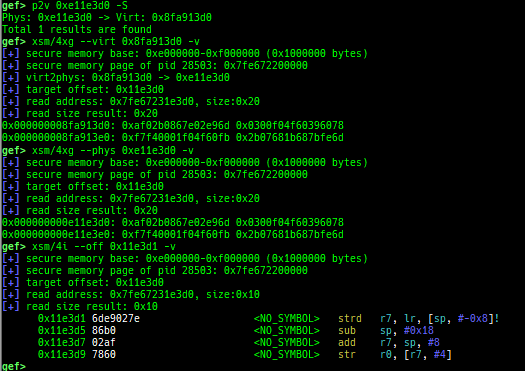
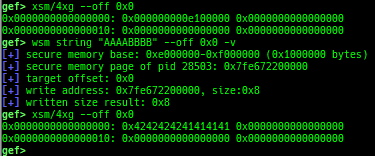
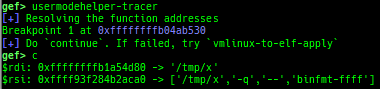
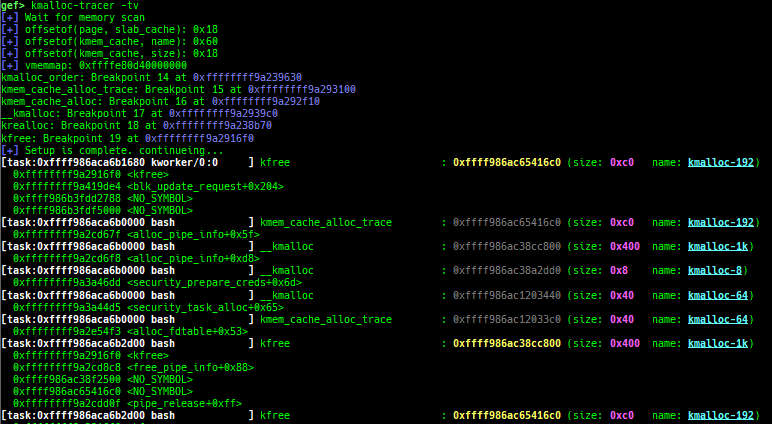
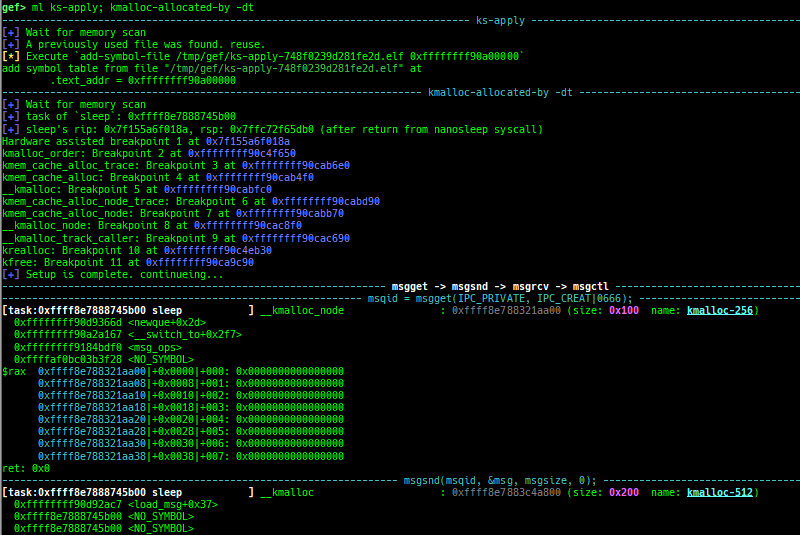
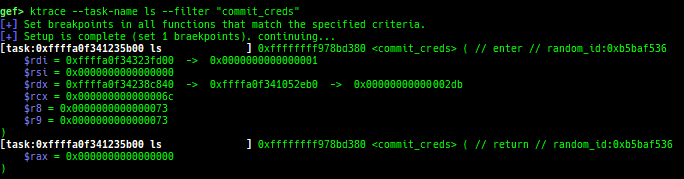
usermodehelper-tracer: collects and displays the information that is executed bycall_usermodehelper_setup.kmalloc-tracer: collects and displays information whenkmalloc/kfree.kmalloc-allocated-by: calls a predefined set of system calls and prints structures allocated bykmallocor freed bykfree.ktrace: traces kernel functions and arguments.xsm: dumps secure memory when gdb is in normal world.- Supported on only ARM64 and ARM.
wsm: writes the value to secure memory when gdb is in normal world.- Supported on only ARM64 and ARM.
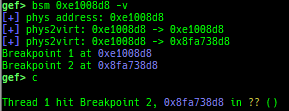
bsm: sets the breakpoint to secure memory when gdb is in normal world.- Supported on only ARM64 and ARM.
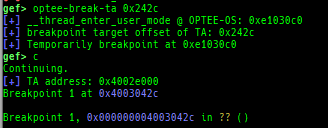
optee-break-ta: sets the breakpoint to the offset of OPTEE-Trusted-App when gdb is in normal world.- Supported on only ARM64 and ARM.
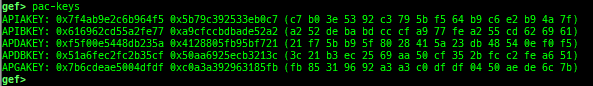
pac-keys: pretty prints ARM64 PAC keys.- Supported on only ARM64.
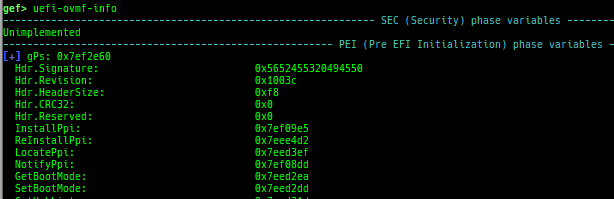
uefi-ovmf-info: dumps addresses of some important structures in each boot phase of UEFI when OVMF is used.- Supported on only x64.
qemu-device-info: dumps device information for qemu-escape (WIP).
si/ni: are the wrapper for nativesi/niif OpenRISC or cris.- On OpenRISC architecture, branch operations don't work well, so use breakpoints to simulate.
- On cris architecture,
stepi/nexticommands don't work well, so use breakpoints to simulate. - If you want to use native
si/ni, use the full formstepi/nexti.
c: is the wrapper for nativecif gdb is connected to qemu-user or intel pin.- When connecting to gdb stub of qemu-user or Intel Pin, gdb does not trap
SIGINTduringcontinue. - If you want to trap, you need to issue
SIGTRAPon the qemu-user or pin side, but switching screens is troublesome. - This command realizes a pseudo
SIGTRAPtrap by trappingSIGINTon the python side and throwingSIGTRAPback to qemu-user or Intel Pin. - It works only local qemu-user or Intel Pin.
- If you want to use native
c, use the full formcontinue.
- When connecting to gdb stub of qemu-user or Intel Pin, gdb does not trap
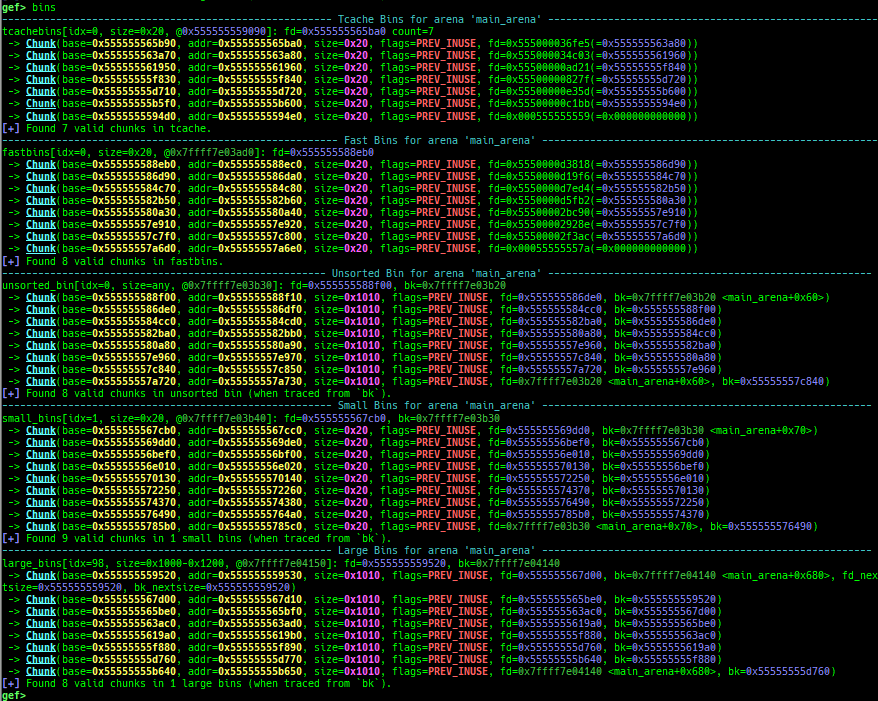
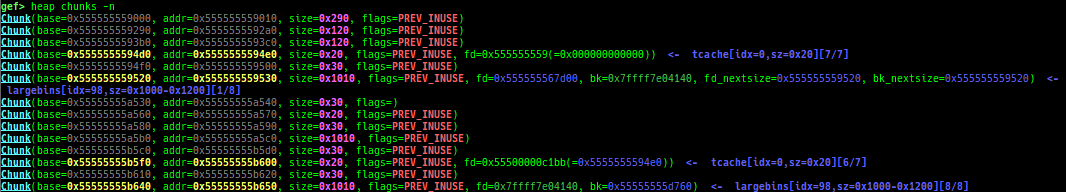
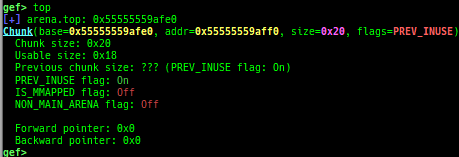
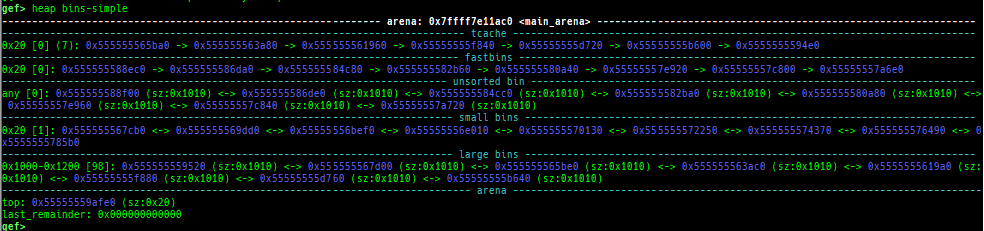
- Glibc heap commands are improved.
- It changes the color and print symbol if exists.
- They print bins information if the chunk is in free-list.
- It supports new modes
heap arenas,heap topandheap bins-simple. - Thread arena is supported for all
heapcommands.- Use
-aoption.
- Use
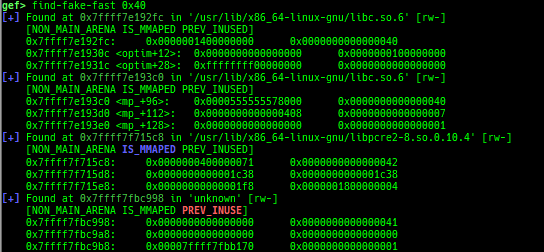
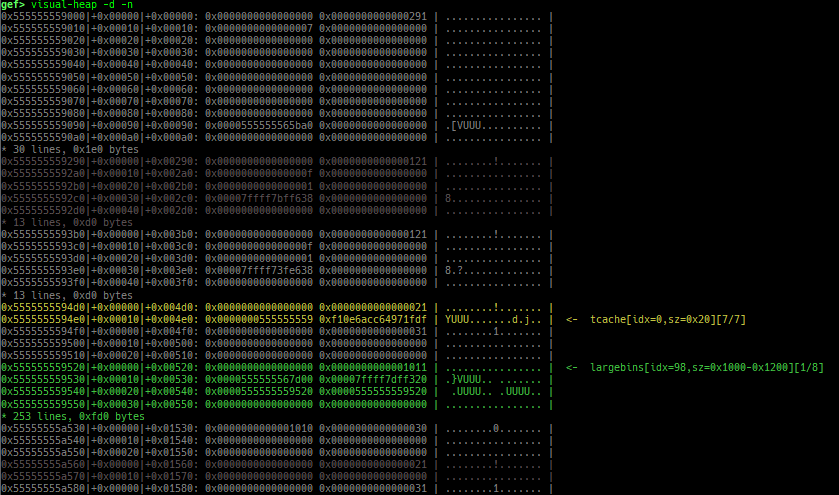
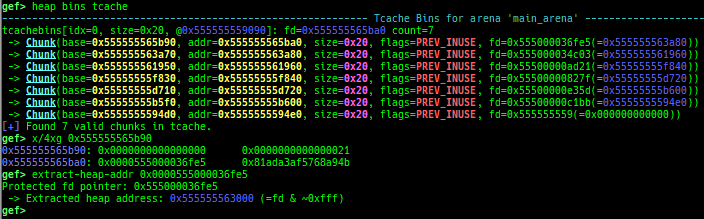
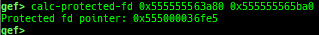
find-fake-fast: searches for a memory with a size-like value that can be linked to the fastbin free-list.visual-heap: is colorized heap viewer.extract-heap-addr: analyzes tcache-protected-fd introduced from glibc-2.32.calc-protected-fd: calculates a valid value as protected fd.
- It changes the color and print symbol if exists.
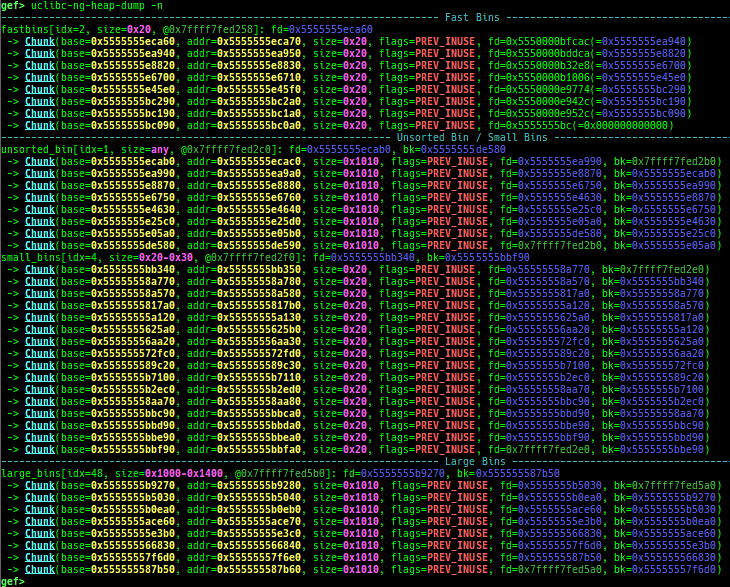
- uClibc heap commands are added.
uclibc-ng-heap-dump: dumps uClibc-ng heap chunks.- Supported on x64/x86, based on uClibc-ng v1.0.42 malloc-standard.
- How to test (x64):
- Download and extract
x86-64--uclibc--stable-2024.05-1.tar.bz2from https://toolchains.bootlin.com/ - Add
/PATH/TO/x86_64-buildroot-linux-uclibc/binto$PATH, then build asx86_64-linux-gcc test.c. - Fix interpreter by
patchelf --set-interpreter /PATH/TO/x86_64-buildroot-linux-uclibc/sysroot/lib/ld64-uClibc.so.0 a.out.
- Download and extract
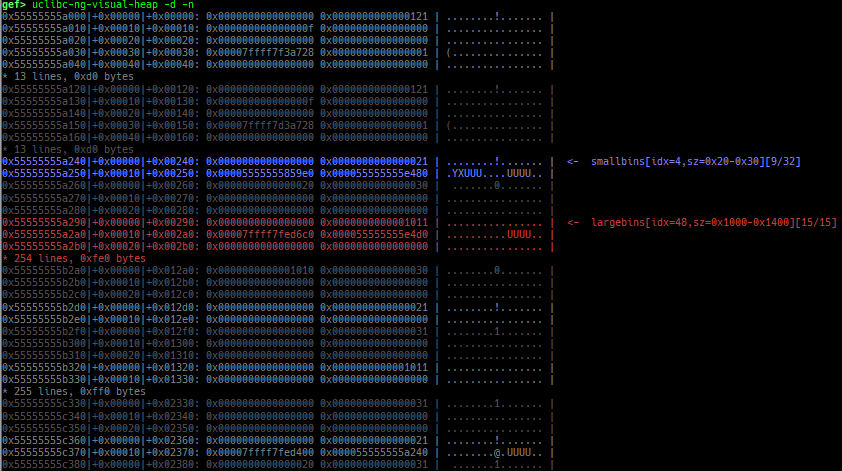
uclibc-ng-visual-heap: is colorized heap viewer for uClibc-ng.
partition-alloc-dump: dumps partition-alloc free-list for chromium.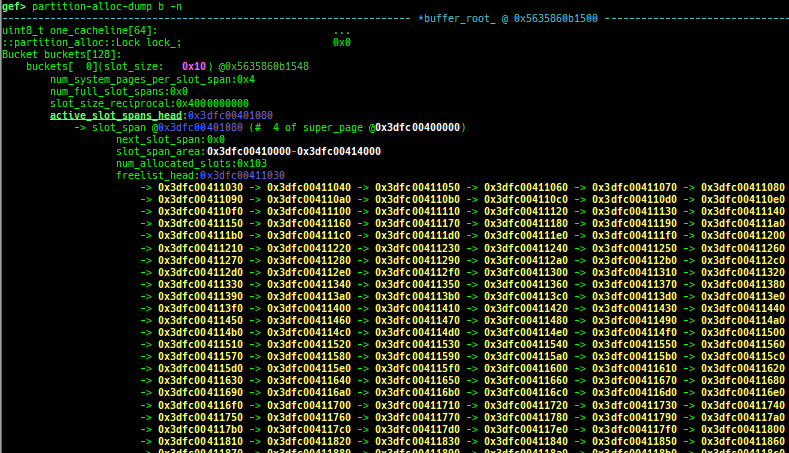
- This command is reserved for the implementation of latest version of chromium.
- Currently tested: v132.x / 1372437 / b39907d62aa9c705221c7f810277594a8fcda94b
- https://commondatastorage.googleapis.com/chromium-browser-snapshots/index.html?prefix=Linux_x64/1372437/
- Supported on only x64/ARM64 (maybe it works on x86/ARM too, but not tested).
- It will try heuristic search if binary has no symbol.
- How to test:
tcmalloc-dump: dumps tcmalloc free-list.- Supported on only x64, based on gperftools-2.9.1 (named
libgoogle-perftools{4,-dev}) 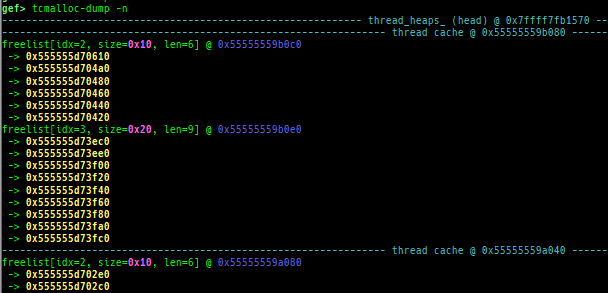
- How to test:
- Execute as
LD_PRELOAD=/usr/lib/x86_64-linux-gnu/libtcmalloc.so ./a.out.
- Execute as
- Supported on only x64, based on gperftools-2.9.1 (named
musl-heap-dump: dumps musl-libc heap chunks.- Supported on x64/x86, based on musl-libc v1.2.5.
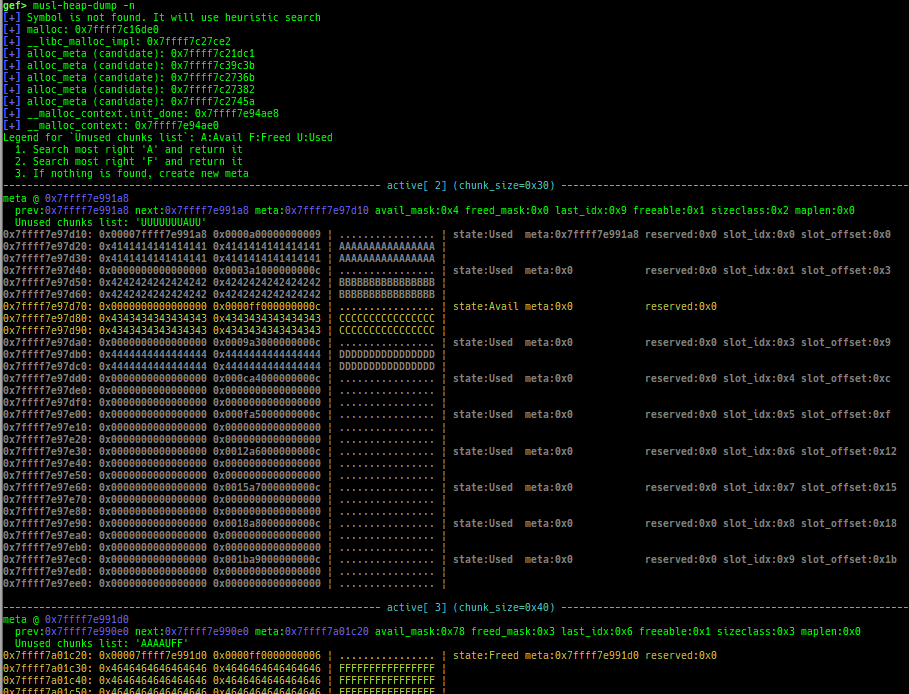
- How to test:
- Get and extract latest source from https://musl.libc.org/
- Build with
./configure && make install. - Build as
/usr/local/musl/bin/musl-gcc test.c.
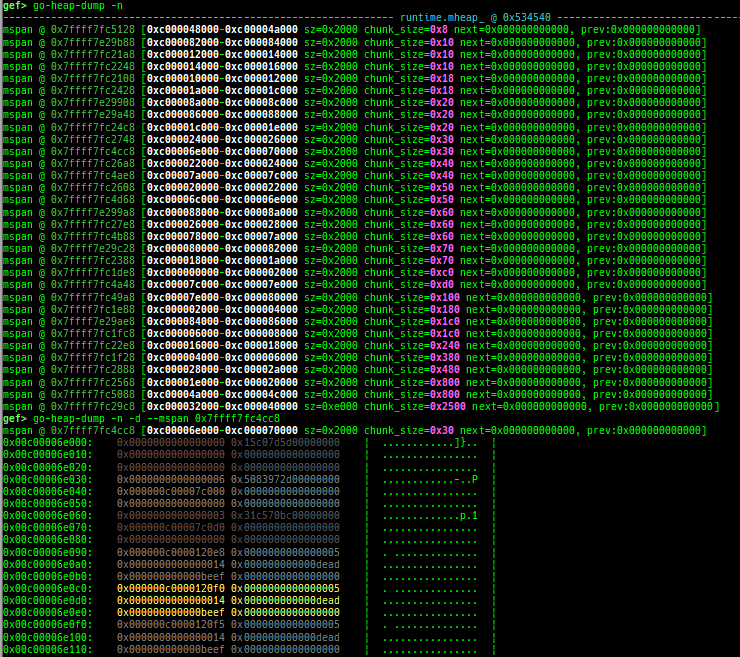
go-heap-dump: dumps go language v1.22.2 mheap (only x64).tlsf-heap-dump: dumps TLSF (Two-Level Segregated Fit) v2.4.6 free-list (only x64).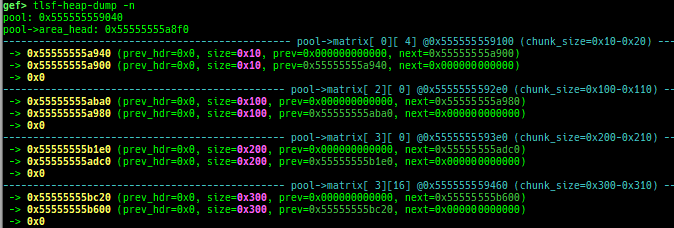
- How to test (x64):
- Get and extract latest source from http://www.gii.upv.es/tlsf/
- Build with
cd TLSF-2.4.6/src && make && cd ../examples && makethen usetest1etc.
hoard-heap-dump: dumps Hoard v3.13 free-list (only x64).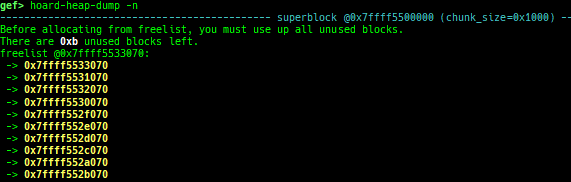
- How to test (x64):
- Get and extract latest source from https://github.com/emeryberger/Hoard
- Build with
cd Hoard/src && make. - Execute as
LD_PRELOAD=/path/to/libhoard.so ./a.out.
mimalloc-heap-dump: dumps mimalloc free-list (only x64).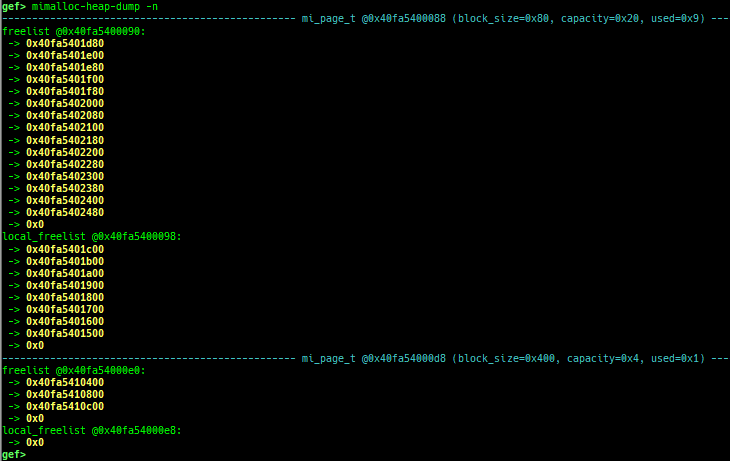
- How to test (x64):
- Get and extract latest source from https://github.com/microsoft/mimalloc
- Build with
mkdir build && cd build && cmake .. && make. - Execute as
LD_PRELOAD=/path/to/libmimalloc.so ./a.out.
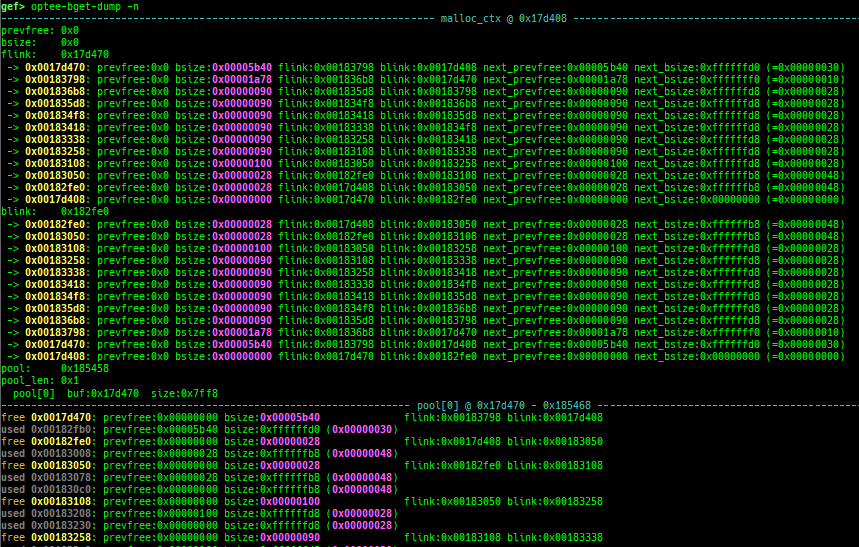
optee-bget-dump: dumps bget allocator of OPTEE-Trusted-App.

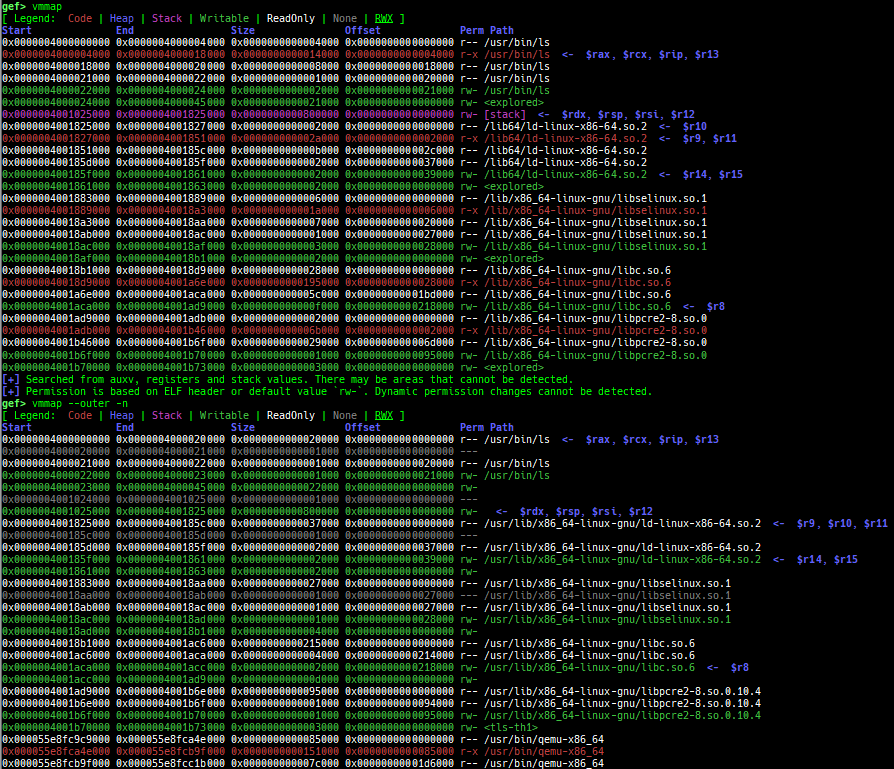
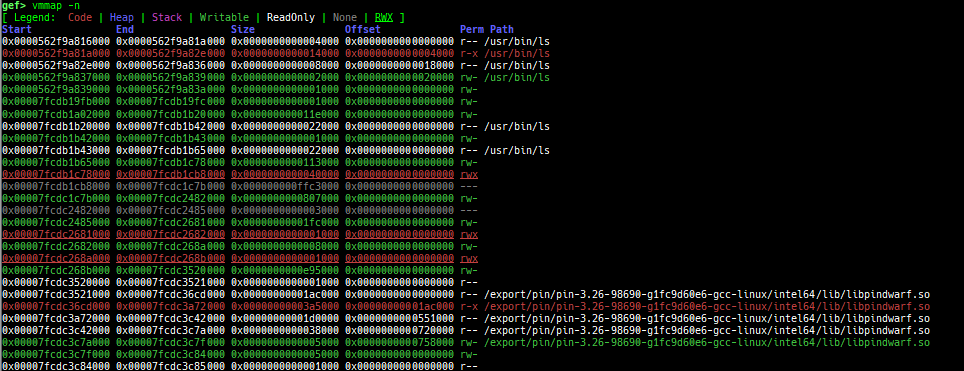
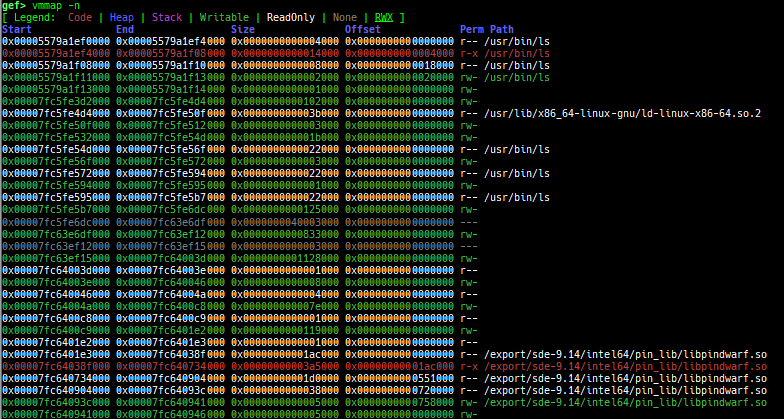
vmmap: is improved.- It displays the memory map information even when connecting to gdb stub like qemu-user.
- Intel Pin is supported.
- Intel SDE is supported.
- It is redirected to
pagewalkwhen connecting to gdb stub of qemu-system. - It supports detection and coloring of
Writable,ReadOnly,NoneandRWXregions. - It shows the area each register points to.
- It displays the memory map information even when connecting to gdb stub like qemu-user.
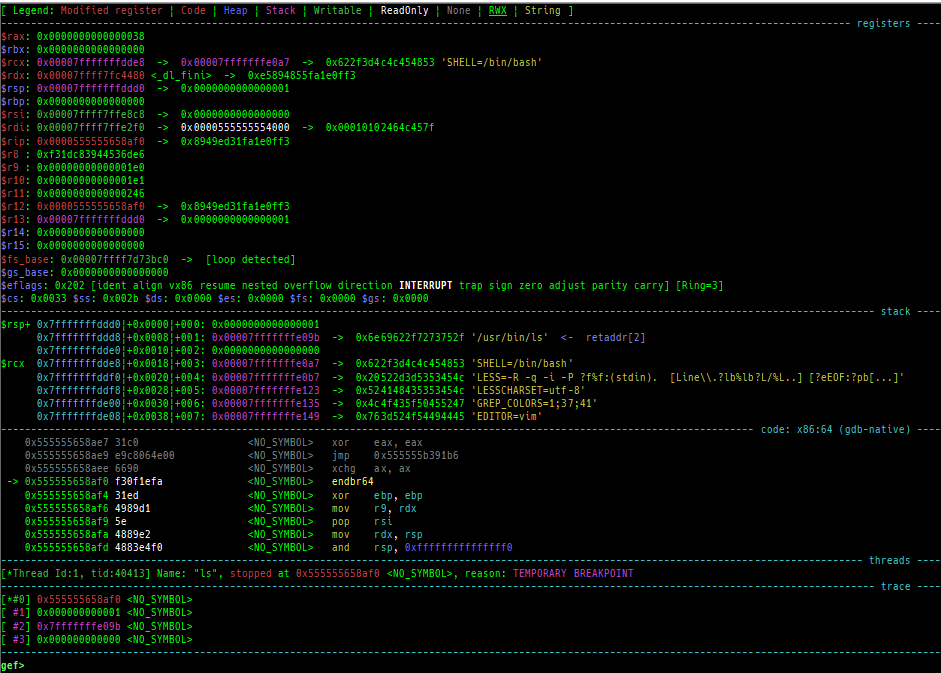
registers: is improved.- It also shows raw values of flag register, current ring, exception level, secure state, etc.
- It also shows raw values of flag register, current ring, exception level, secure state, etc.
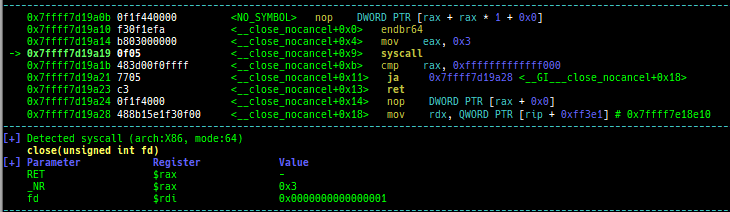
context: is improved.- It supports automatic display of system call arguments when calling a system call.
- It supports new modes:
context oncontext off
- It supports automatic display of address and value when accessing memory.
- It supports smart symbol printing for C++ function.
- ex:
std::map<int, std::map<int, int>>will be replaced bystd::map<...>. 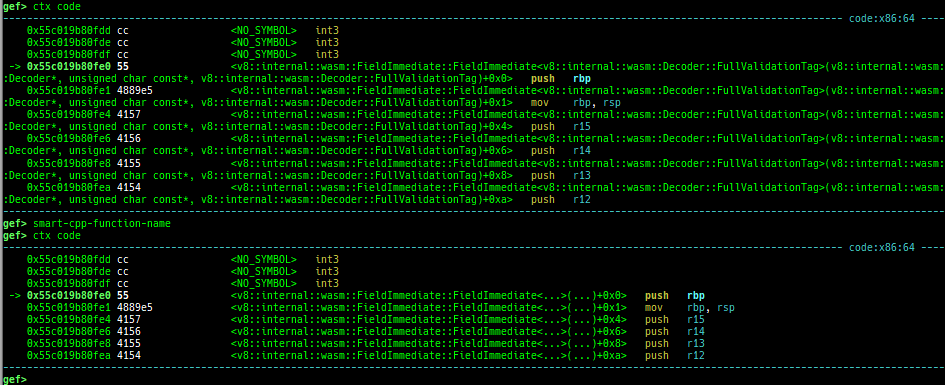
- command:
gef config context.smart_cpp_function_name trueorsmart-cpp-function-name(later is used to toggle).
- ex:
- It supports automatic display of system call arguments when calling a system call.
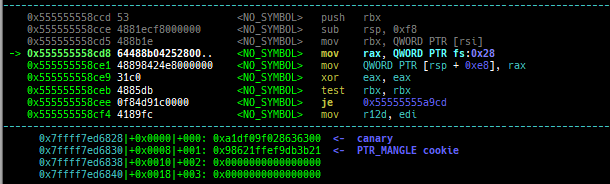
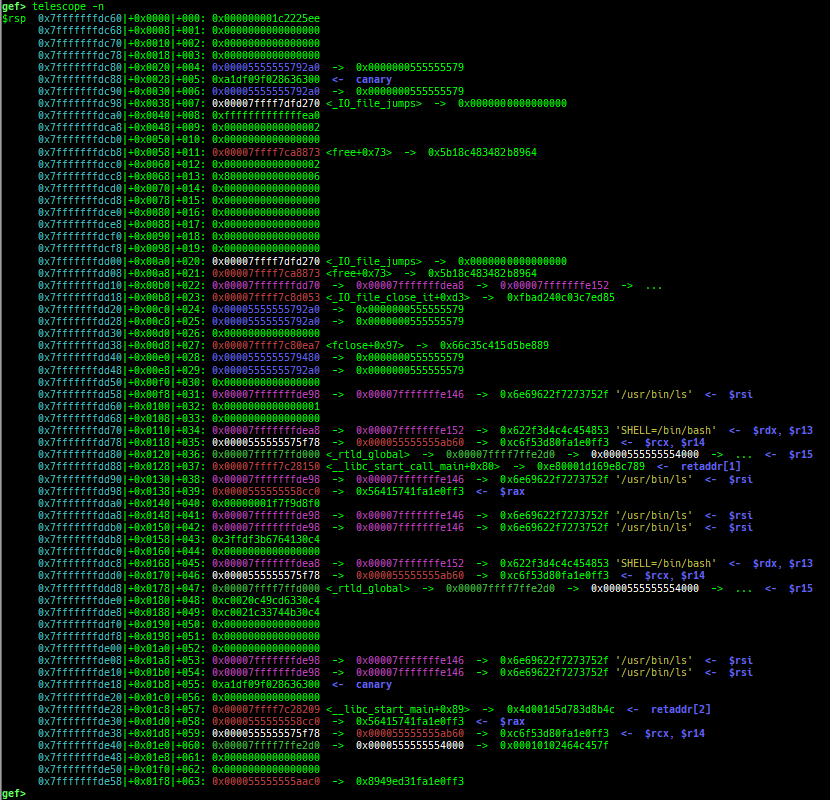
telescope: is improved.- It displays ordinal numbers as well as offsets.
- It displays if there are canary and return address on the target area.
- It supports blacklist address features (to avoid dying when touching the address mapped to the serial device).
- It also shows the symbol if available.
- It supports some new options:
--is-addr--is-not-addr--zero--non-zero--tag--uniq--depth--phys--list-head--slab-contains--slab-contains-unaligned
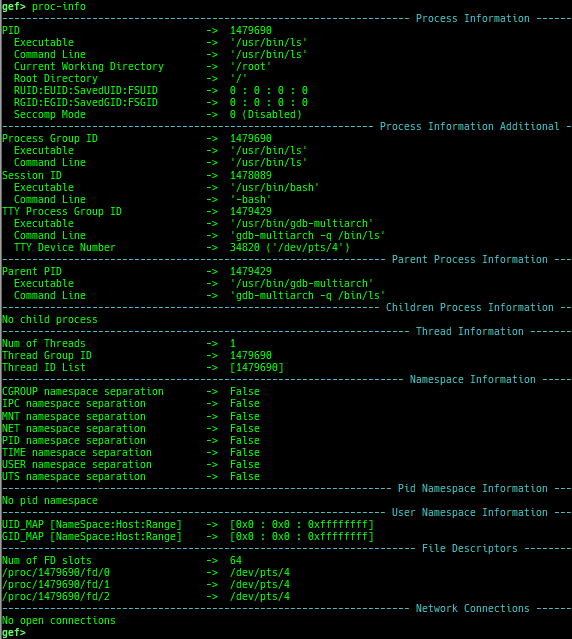
proc-info: is improved.- It displays some additional information.
- It displays some additional information.
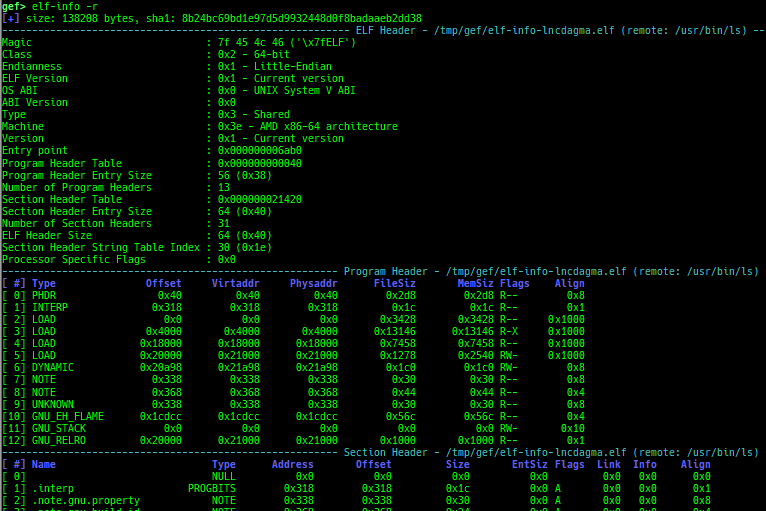
elf-info: is improved.- It displays Program Header and Section Header.
- It supports parsing from memory.
- It supports parsing remote binary (if download feature is available).
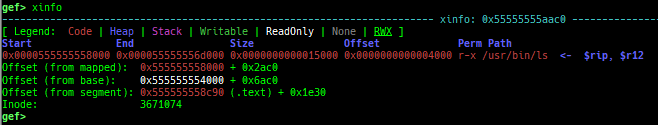
xinfo: is improved.- It shows more information.
- It also supports kernel debugging.
checksec: is improved.- It shows additional information.
- Static or Dynamic or Static-PIE
- Stripped or not
- Debuginfo or not
- Intel CET IBT/SHSTK
- ARMv8 PAC, ARMv8 MTE
- RPATH, RUNPATH
- Clang CFI/SafeStack
- System-ASLR, GDB ASLR setting
- It supports parsing remote binary (if download feature is available).
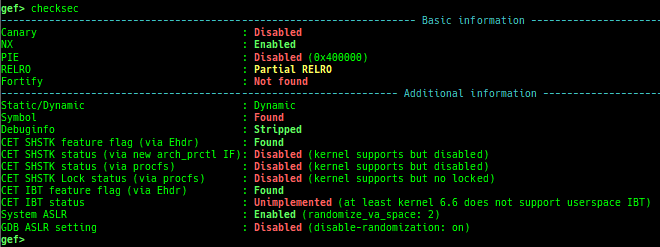
- It shows additional information.
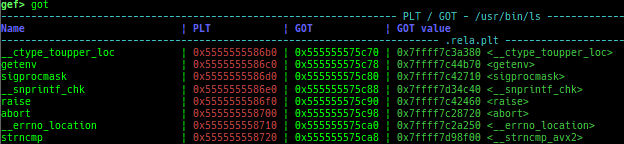
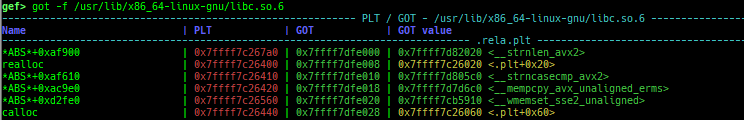
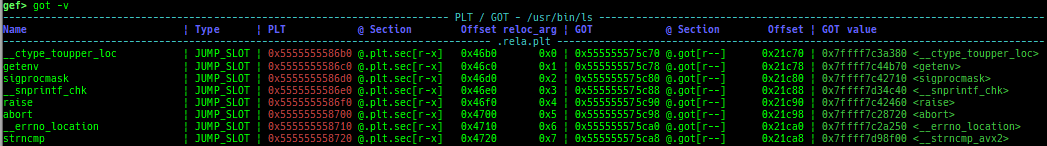
got: is improved.- It displays not only GOT address but also PLT address.
- It scans
.plt.secsection if Intel CET is enabled. - It can also display the GOT of the library.
- It can also display
type,offset,reloc_arg,sectionandpermission.
- It displays not only GOT address but also PLT address.
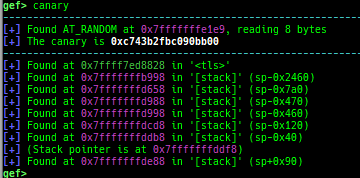
canary: is improved.- It displays all canary positions in memory.
- It displays all canary positions in memory.
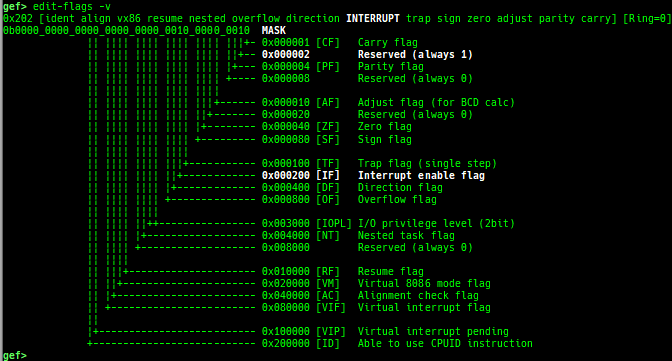
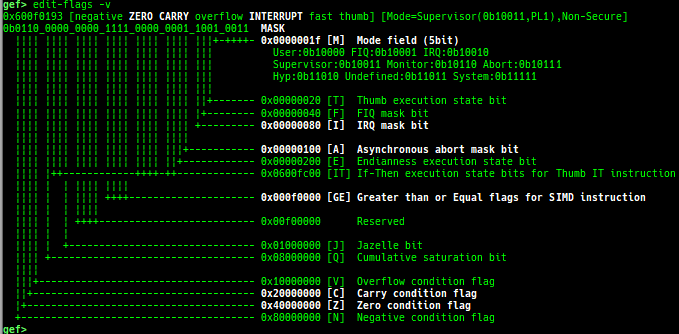
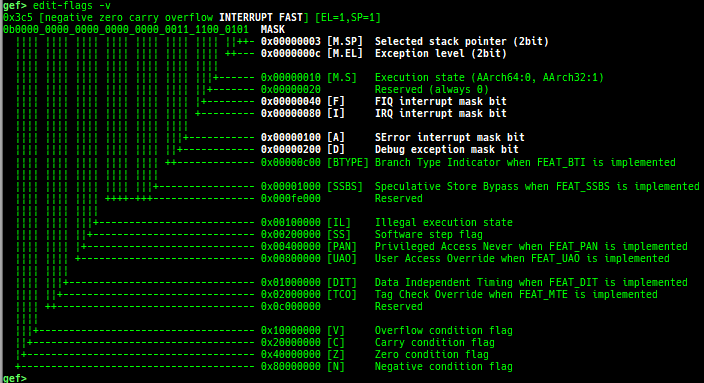
edit-flags: is improved.- It displays the meaning of each bit if
-voption is provided.
- It displays the meaning of each bit if
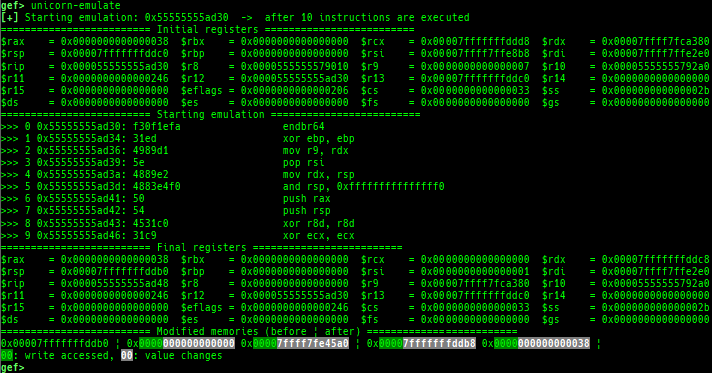
unicorn-emulate: is improved.- It reads and writes correctly to the address pointed to by
$fs/$gs. - It supports a new mode to stop after executing N instructions (
-g). - It shows changed memories.
- It reads and writes correctly to the address pointed to by
ropper: is improved.- It does not reset autocomplete settings after calling imported
ropper.
- It does not reset autocomplete settings after calling imported
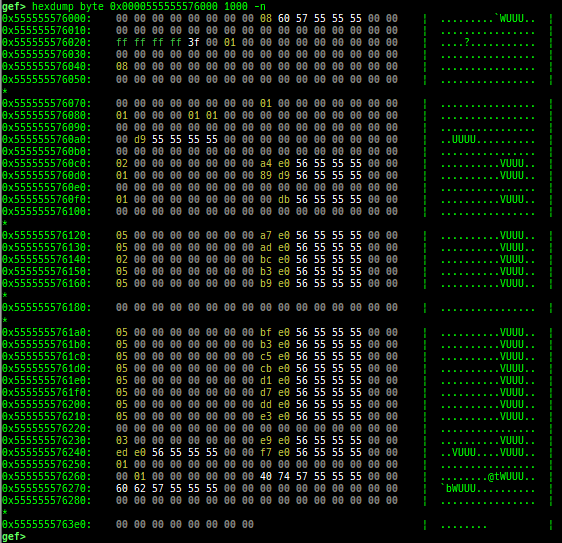
hexdump: is improved.- It supports physical memory if under qemu-system.
- It will retry with adjusting read size when failed reading memory.
- By default, the same line is omitted.
patch: is improved.- It supports physical memory if under qemu-system.
- Added some new modes:
patch hexpatch patternpatch noppatch infpatch trappatch retpatch syscallpatch historypatch revert
nopcommand has been integrated intopatchcommand.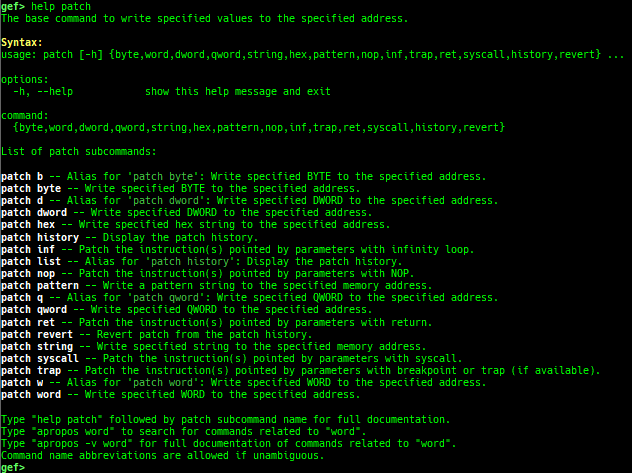
search-pattern: is improved.- It supports when under qemu-system (in short, it works without
/proc/self/maps) - It supports some new options:
--hex--hex-regex--aligned--perm--interval--limit--max-region-size--phys
- It also searches UTF-16 string if target string is ASCII.
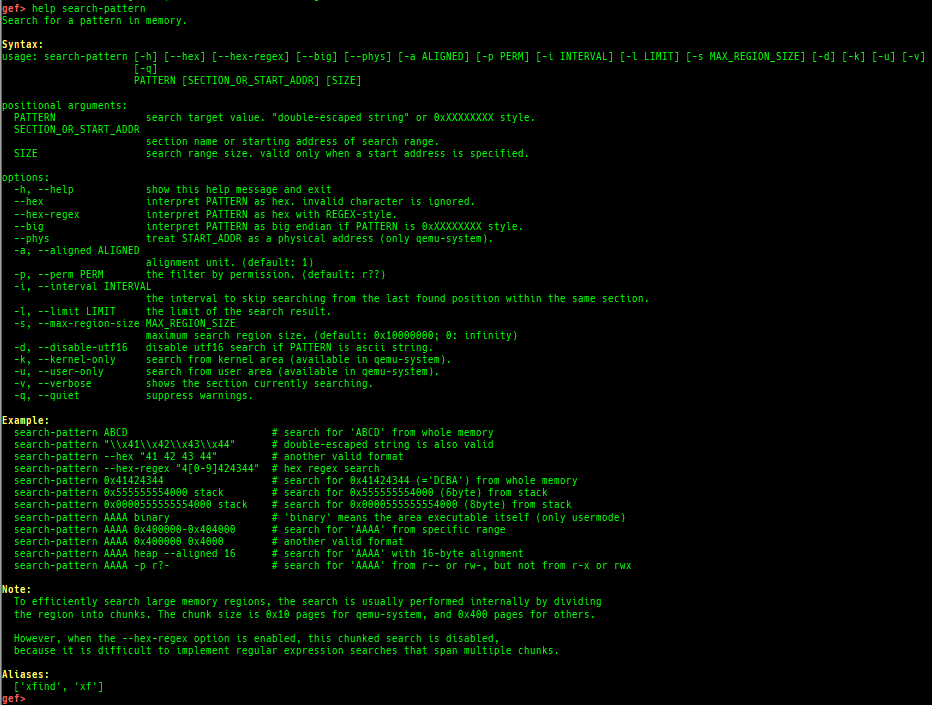
- It supports when under qemu-system (in short, it works without
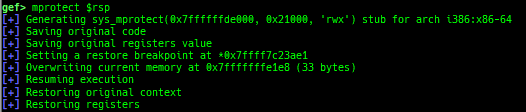
mprotect: is improved.- It supports more architectures.
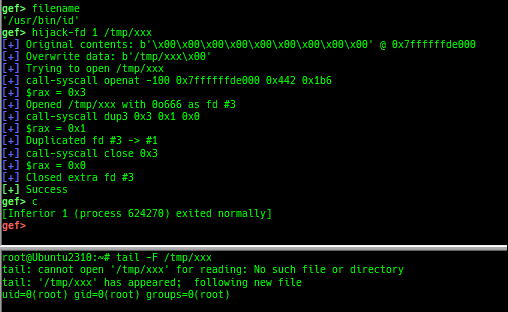
hijack-fd: is improved.- It supports more architectures.
format-string-helperis improved.- It supports more printf-like functions.
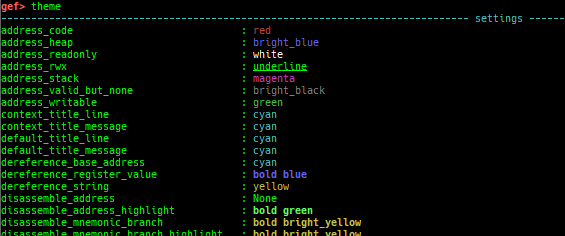
themeis improved.- Supports many colors.
reset-cacheis improved.- The cache structure within GEF has changed significantly. This command corresponds to them.


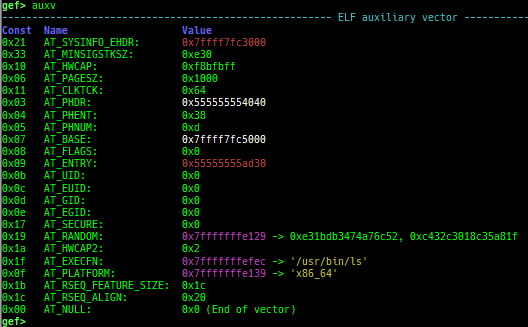
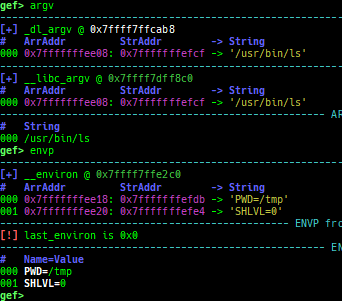
pid/tid: prints pid and tid.filename: prints filename.fds: shows opened file descriptors.auxv: pretty prints ELF auxiliary vector.- Supported also under qemu-user.
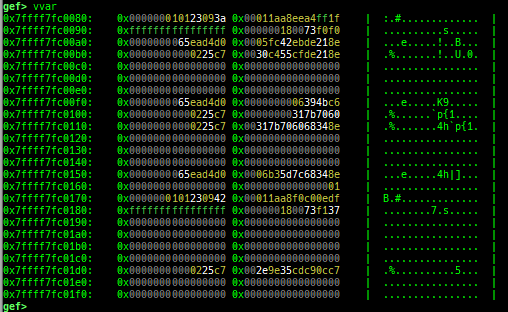
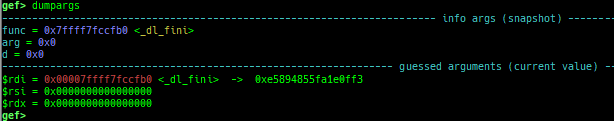
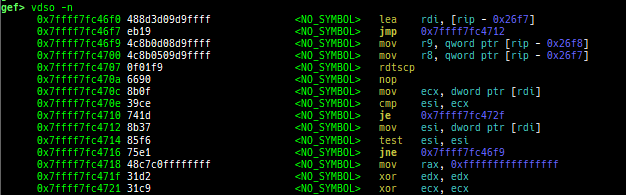
argv/envp: pretty prints argv and envp.dumpargs: dumps arguments of current function.vdso: disassembles the text area of vdso smartly.vvar: dumps the area of vvar.- This area is mapped to userland, but cannot be accessed from gdb.
- Therefore, it executes the assembly code and retrieve the contents.
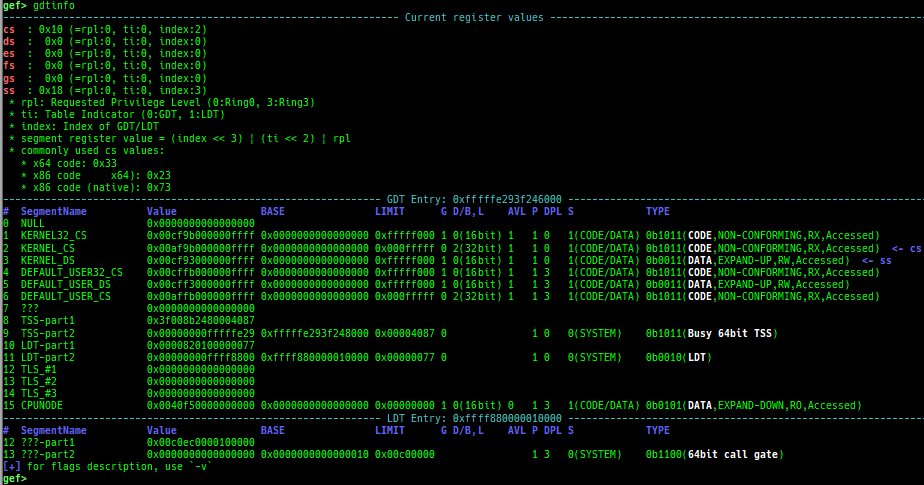
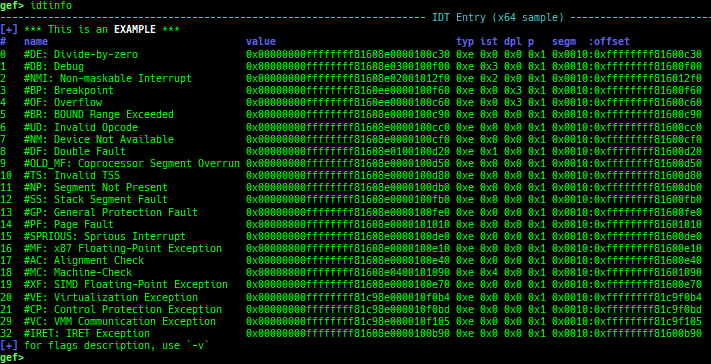
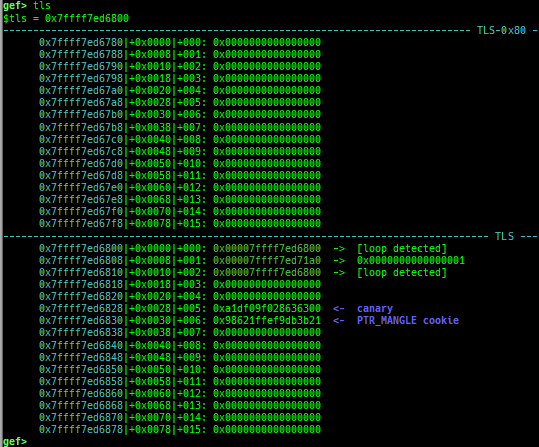
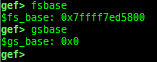
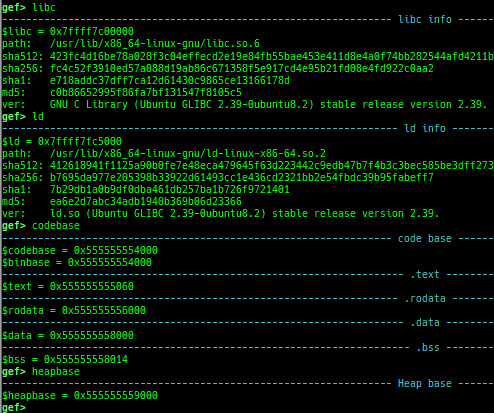
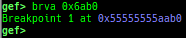
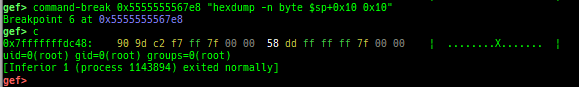
gdtinfo: pretty prints GDT entries. If userland, show sample entries.idtinfo: pretty prints IDT entries. If userland, show sample entries.tls: pretty prints TLS area. Requires glibc.fsbase/gsbase: pretty prints$fs_base,$gs_base.libc/ld/heapbase/codebase: displays each of the base address.got-all: shows got entries for all libraries.break-rva: sets a breakpoint at relative offset from codebase.command-break: sets a breakpoint which executes user defined command if hit.main-break: sets a breakpoint atmainwith or without symbols, then continue.- This is useful when you just want to run to
mainunder using qemu-user or pin, or debugging no-symbol ELF.
- This is useful when you just want to run to
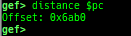
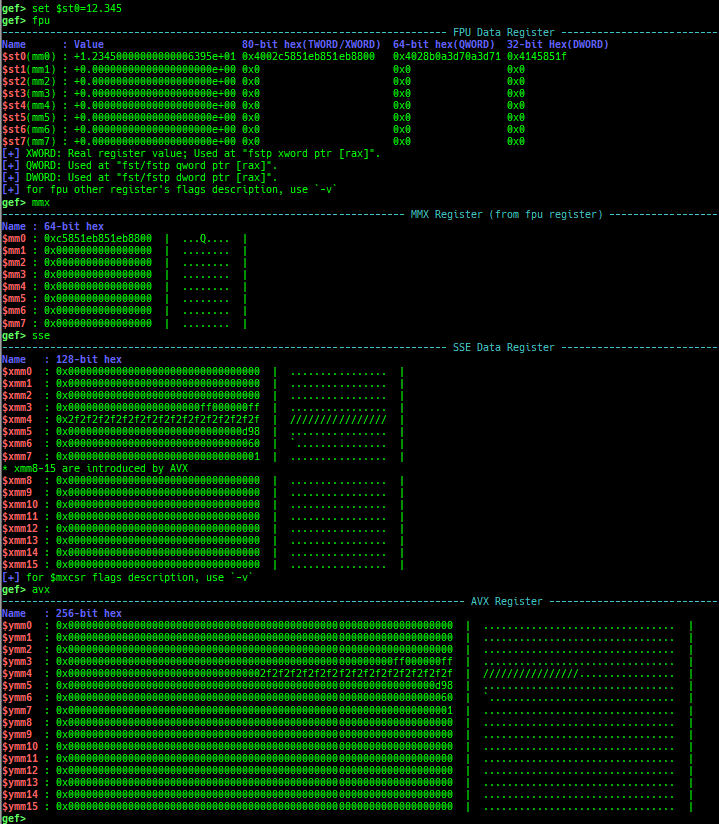
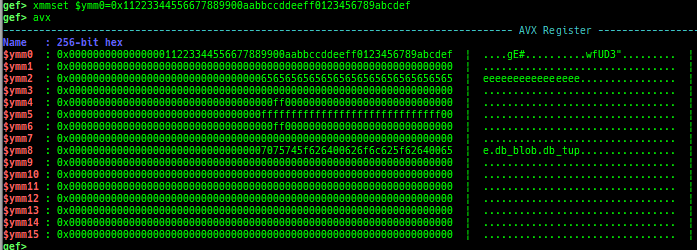
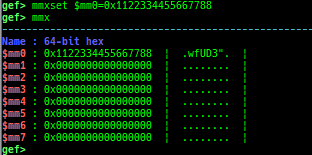
load-break: breaks if something is loaded.regdump-break: sets a breakpoint which dumps specified registers if hit.break-if-taken/break-if-not-taken: sets a breakpoint which breaks if branch is taken (or not taken).distance: calculates the offset from its base address.fpu/mmx/sse/avx: pretty prints FPU/MMX/SSE/AVX registers.xmmset: sets the value to xmm/ymm register simply.mmxset: sets the value to mm register simply.exec-until: executes until specified operation.- Supported following patterns of detection.
- call
- jmp
- syscall
- ret
- indirect-branch (only x64/x86)
- all-branch (call || jmp || ret)
- memory-access (detect just
[...]) - specified-keyword-regex
- specified-condition (expressions using register or memory values)
- user-code
- libc-code
- secure-world
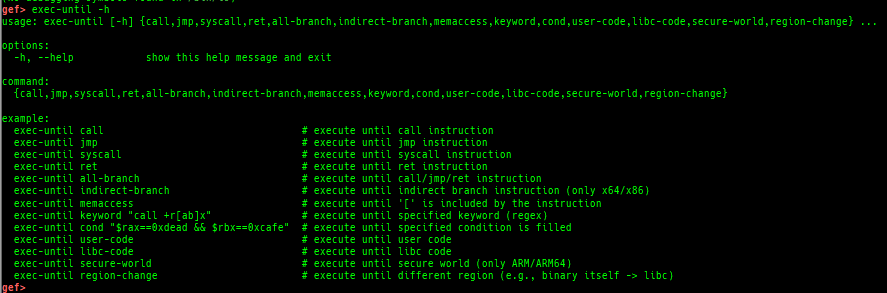
- Supported following patterns of detection.
xuntil: executes until specified address.- It is slightly easier to use than the original until command.
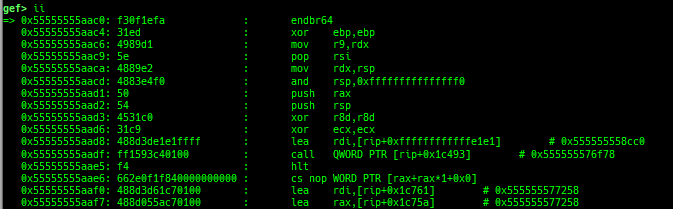
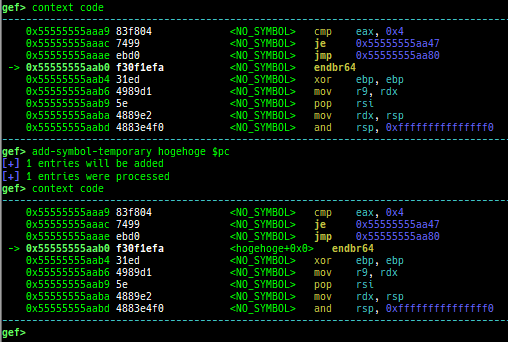
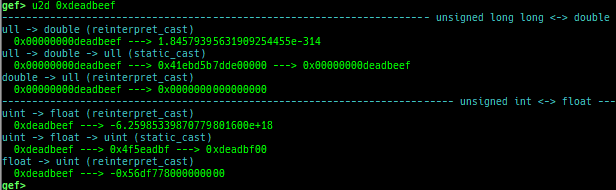
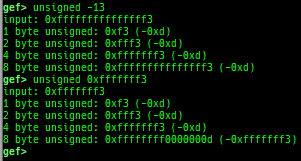
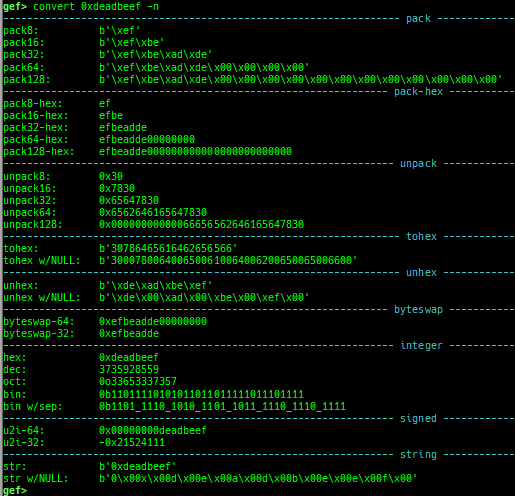
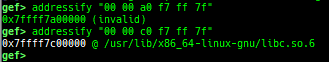
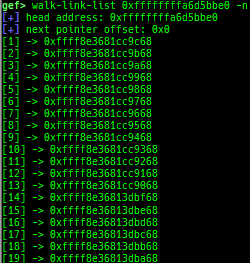
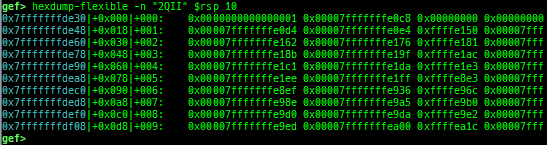
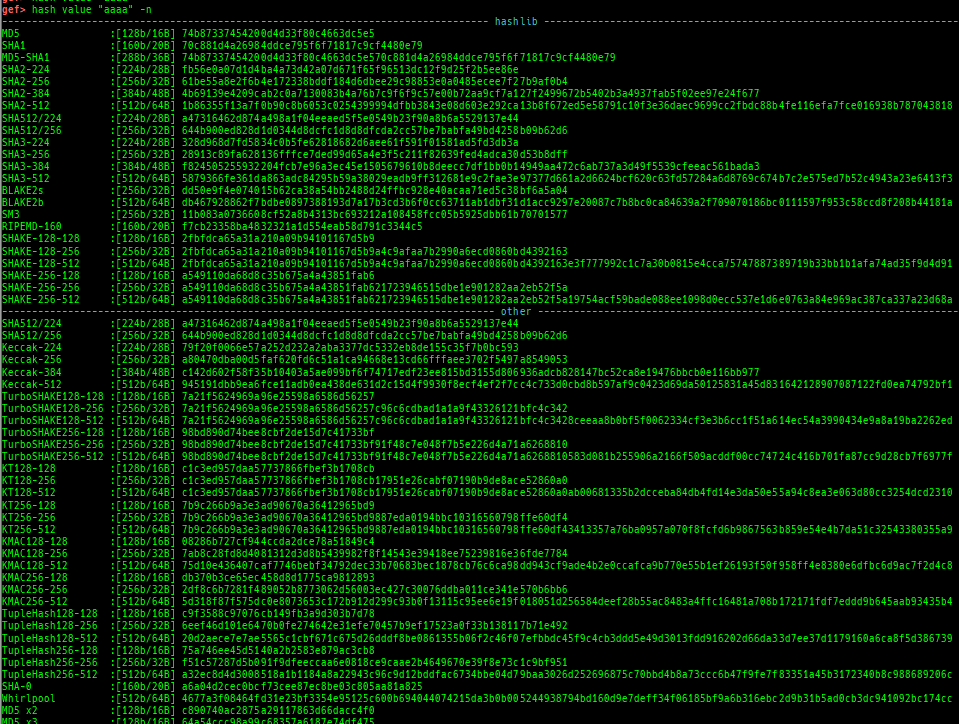
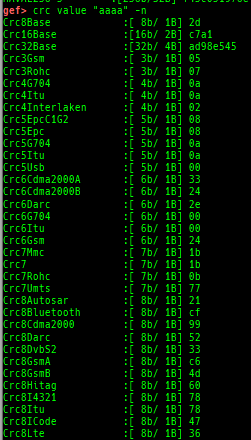
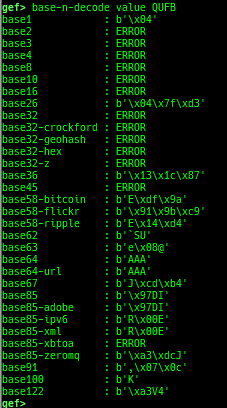
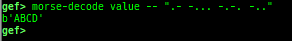
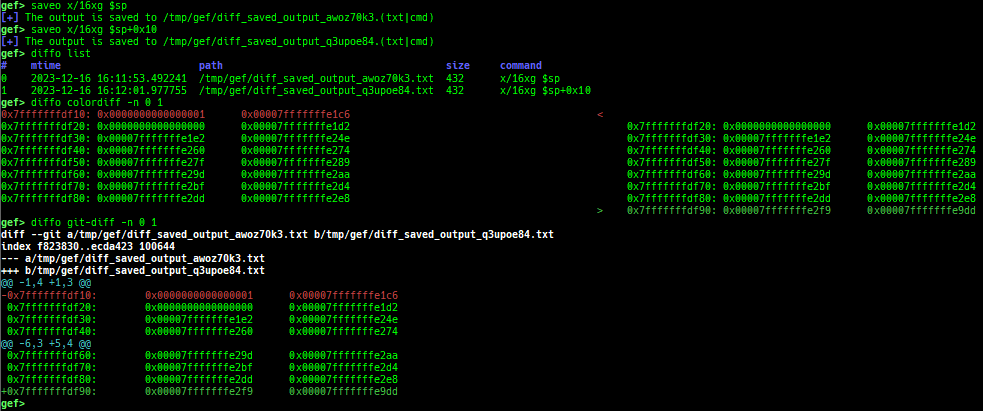
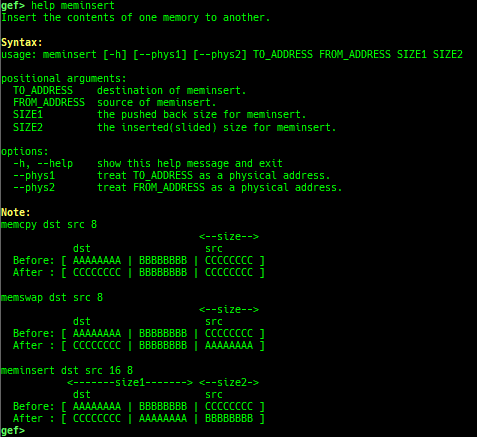
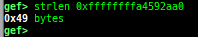
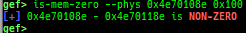
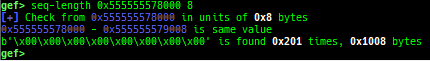
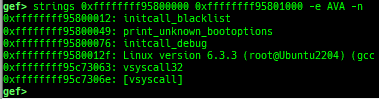
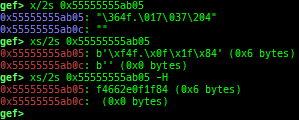
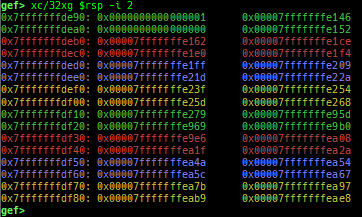
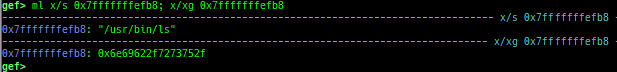
add-symbol-temporary: adds symbol information from command-line.errno: displays errno list or specified errno.u2d: shows cast/convert u64 <-> double/float.unsigned: shows unsigned value.convert: shows various conversion.addressify: converts reverse-order hex values to address.walk-link-list: walks the link list.hexdump-flexible: displays the hexdump with user defined format.hash: calculates various hashes.crc: calculates various CRCs.base-n-decode: decodes various baseN.morse-decode: decodes morse code.saveo/diffo: saves and diffs the command outputs.memcmp: compares the contents of the address A and B, whether virtual or physical.memset: sets the value to the memory range, whether virtual or physical.memcpy: copies the contents from the address A to B, whether virtual or physical.memswap: swaps the contents of the address A and B, whether virtual or physical.meminsert: inserts the contents of the address A to B, whether virtual or physical.strlen: detects the length of the string.is-mem-zero: checks the contents of address range is all 0x00 or 0xff or not.seq-length: detects consecutive length of the same sequence.strings: searches ASCII string from specific location.xs: dumps string likex/scommand, but with hex-string style.xc: dumps address likex/xcommand, but with coloring at some intervals.ii: is a shortcut forx/50i $pcwith opcode bytes.- It prints the value if it is memory access operation.
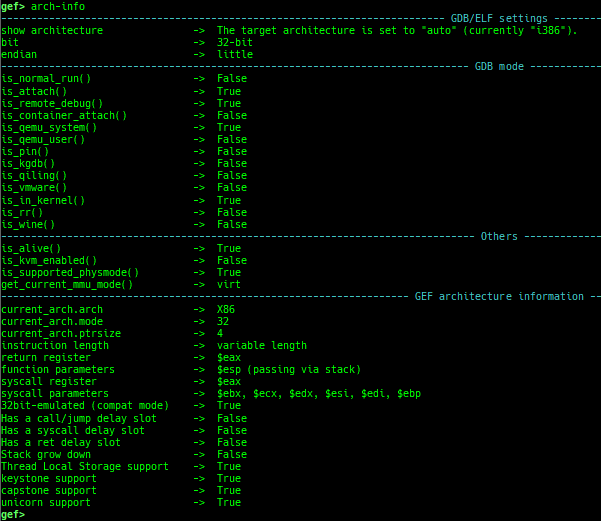
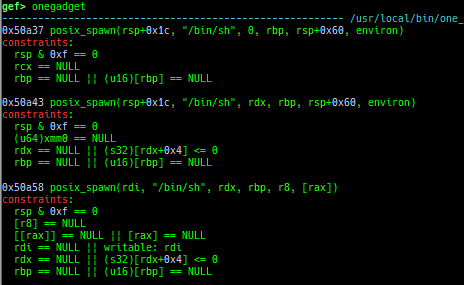
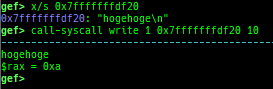
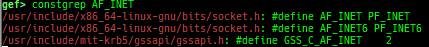
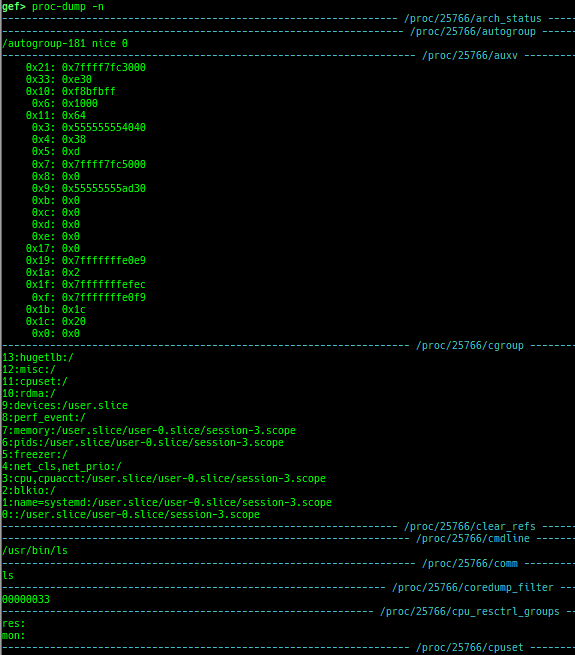
version: shows software versions that gef used.arch-info: shows architecture information used in gef.context-extra: manages user specified command to execute when each step.comment: manages user specified temporary comment.seccomp: invokesseccomp-tools.onegadget: invokesone_gadget.rp: invokesrp++with commonly used options.call-syscall: calls system call with specified values.mmap: allocates a new memory bycall-syscall.killthreads: kill specific or all pthread.constgrep: invokesgrepunder/usr/include.proc-dump: dumps each file under/proc/PID/.up/down: are the wrapper for nativeup/down.- It shows also backtrace.
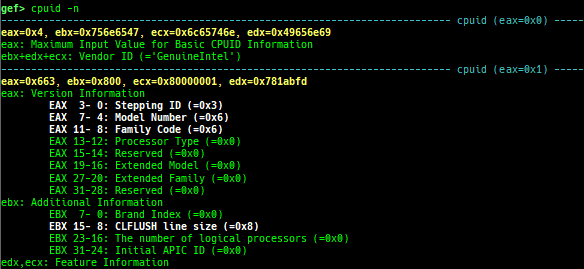
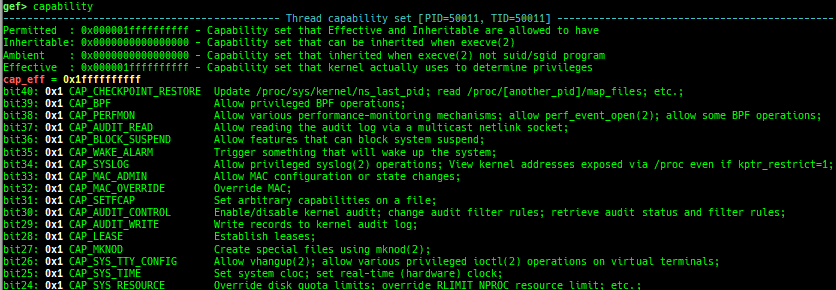
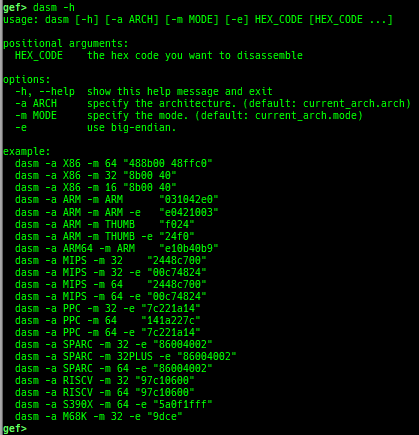
time: measures the time of the GDB command.multi-line: executes multiple GDB commands in sequence.cpuid: shows the result of cpuid(eax=0,1,2...).read-system-register: reads system register for oldqemu-system-arm.read-control-register: reads control register for kgdb.capability: shows the capabilities of the debugging process.dasm: disassembles the code by capstone.asm-list: lists up instructions. (only x64/x86)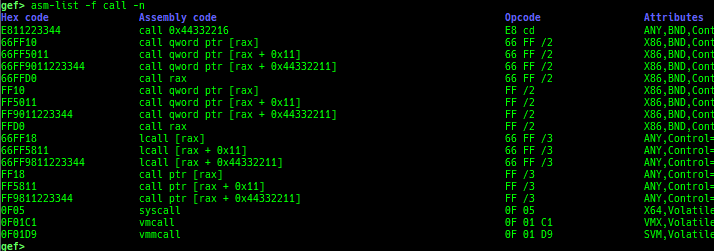
- This command uses x86data.js from https://github.com/asmjit/asmdb
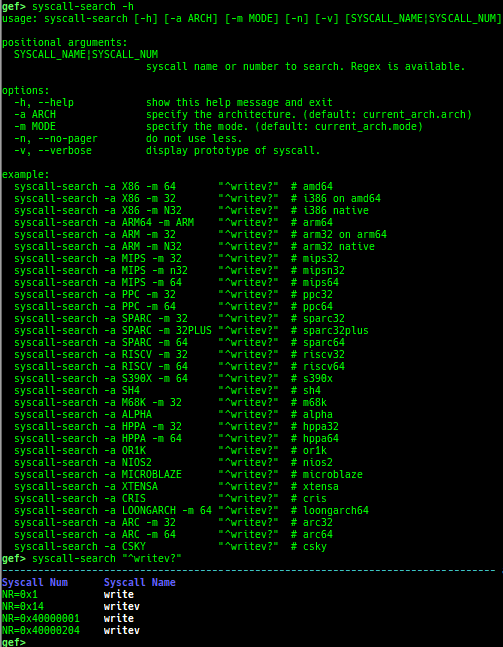
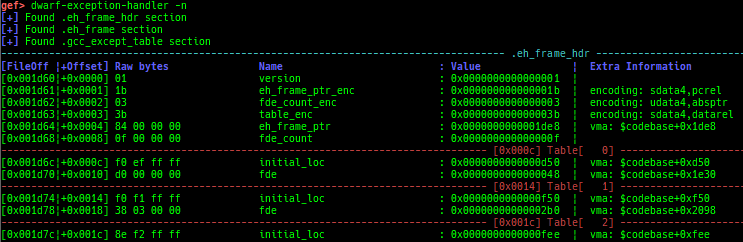
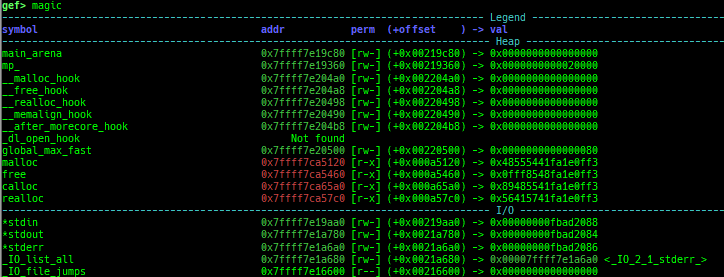
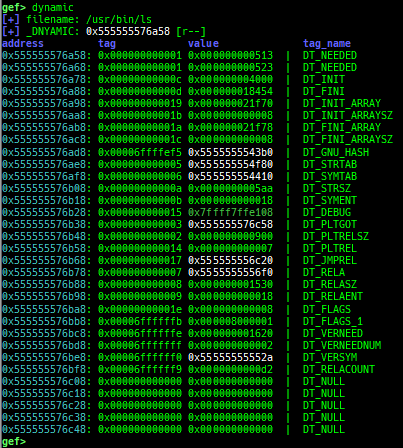
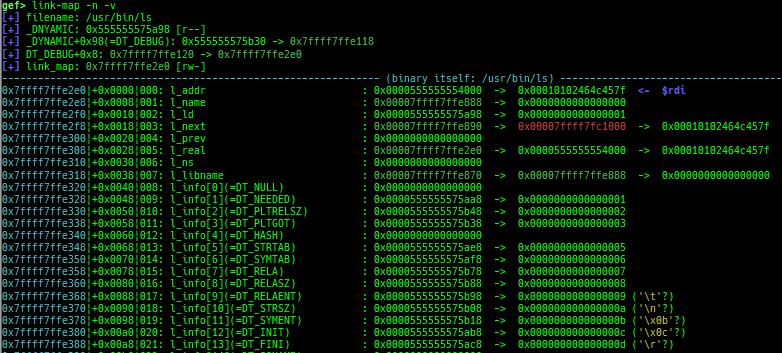
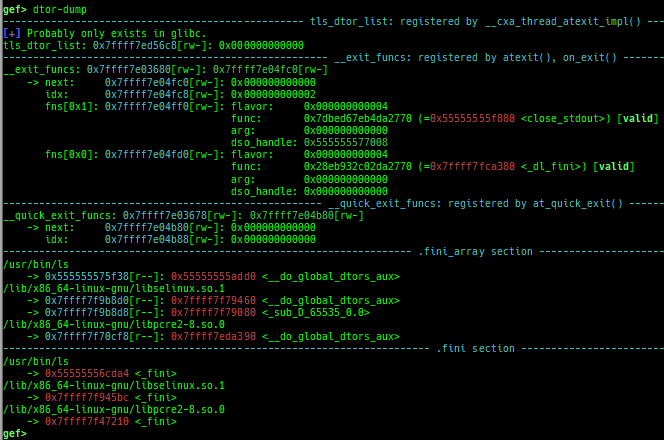
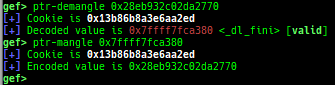
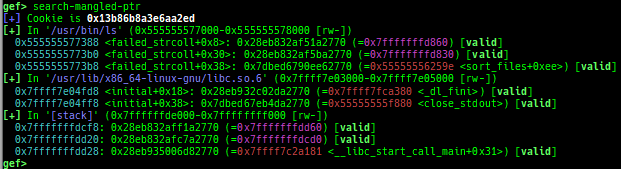
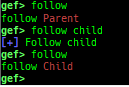
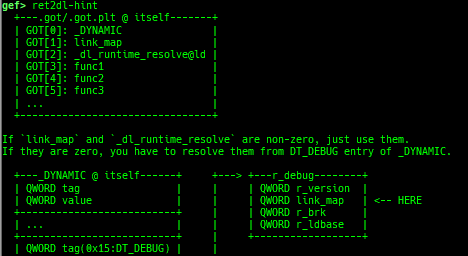
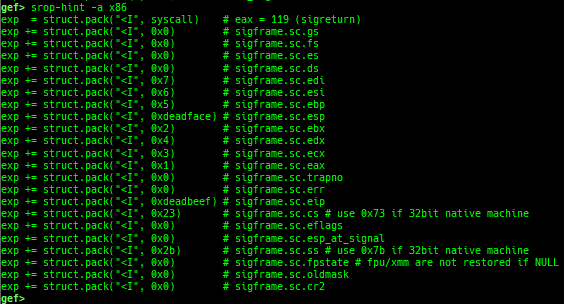
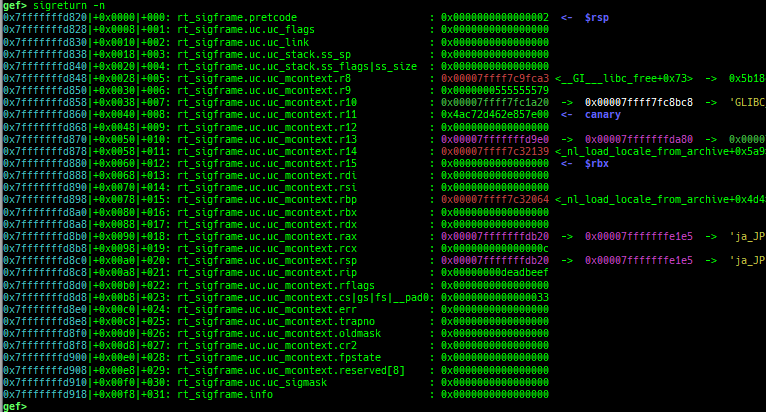
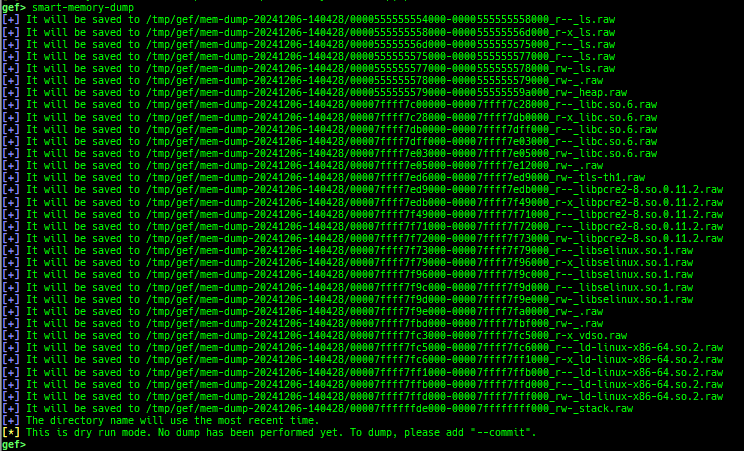
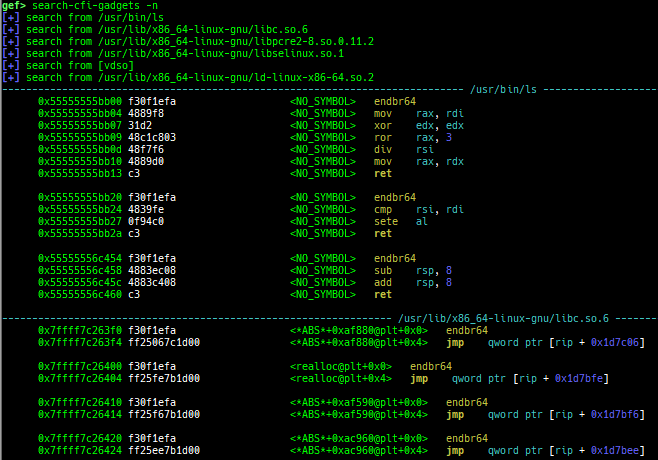
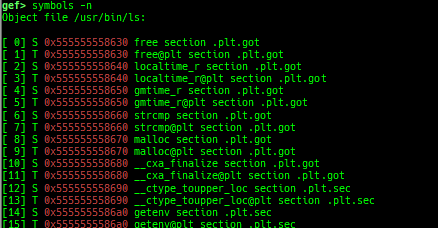
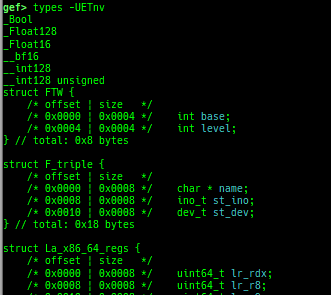
syscall-search: searches system call by regex.syscall-sample: shows the syscall calling sample for specified architecture.dwarf-exception-handler: dumps the DWARF exception handler information.magic: displays useful addresses in glibc etc.dynamic: dumps the_DYNAMICarea.link-map: dumps useful members oflink_mapwith iterating.dtor-dump: dumps some destructor functions list.ptr-mangle: shows the mangled value will be mangled byPTR_MANGLE.ptr-demangle: shows the demangled value of the value mangled byPTR_MANGLE.search-mangled-ptr: searches the mangled value from RW memory.follow: changesfollow-fork-modesetting.smart-cpp-function-name: togglescontext.smart_cpp_function_namesetting.ret2dl-hint: shows the structure used by return-to-dl-resolve as hint.srop-hint: shows the code for sigreturn-oriented-programming as hint.sigreturn: displays stack values for sigreturn syscall.smart-memory-dump: dumps all regions of the memory to each file.search-cfi-gadgets: searches CFI-valid (for CET IBT) and controllable generally gadgets from executable area.symbols: lists up all symbols with coloring.types: lists up all types with compaction.dt: makes it easier to useptype /ox TYPEandp ((TYPE*) ADDRESS)[0].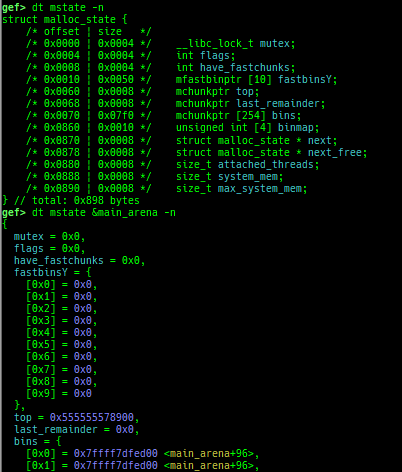
- This command is designed for several purposes.
- When displaying very large struct, you may want to go through a pager because the results will not fit on one screen. However, using a pager, the color information disappears. This command calls the pager with preserving colors.
- When
ptype /ox TYPE, interpreting member type recursively often result is too long and difficult to read. This command keeps result compact by displaying only top-level members. - When
p ((TYPE*) ADDRESS)[0]for large struct, the setting ofmax-value-sizeis too small to display. This command adjusts it automatically. - When debugging a binary written in the golang, the offset information of the type is not displayed. This command also displays the offset.
- When debugging a binary written in the golang, the
p ((TYPE*) ADDRESS)[0]command will be broken. Because the golang helper script is automatically loaded and overwrites the behavior ofpcommand. This command creates the display results on the python side, so we can display it without any problems.
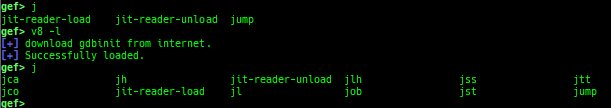
v8: displays v8 tagged object.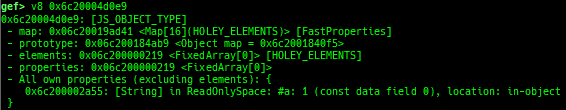
- It also loads more commands from latest gdbinit for v8.
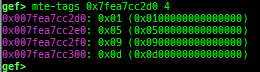
mte-tags: displays the MTE tags for the specified address.- Supported on only ARM64.
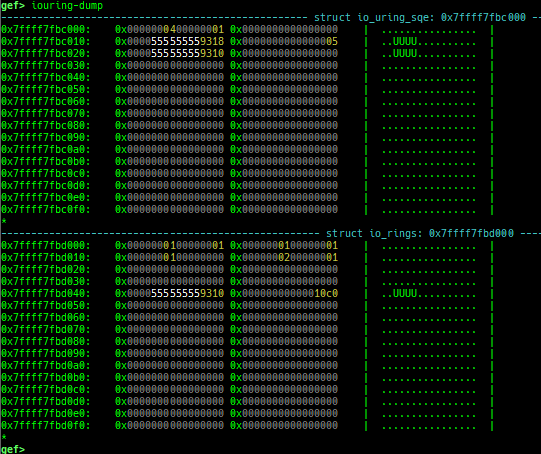
iouring-dump: dumps the area of iouring (only x64).- This area is mapped to userland, but cannot be accessed from gdb.
- Therefore, it executes the assembly code and retrieve the contents.
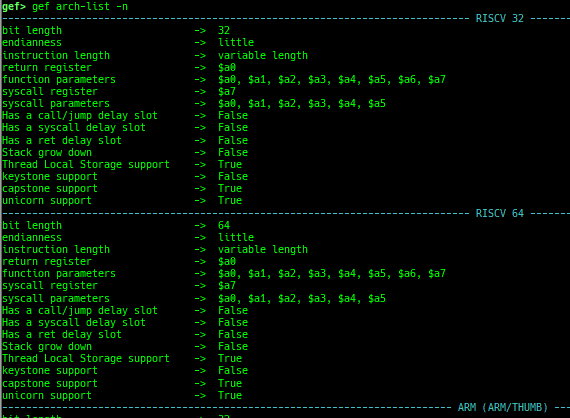
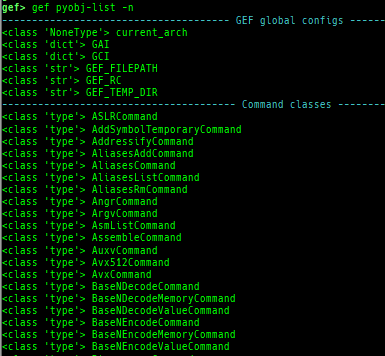
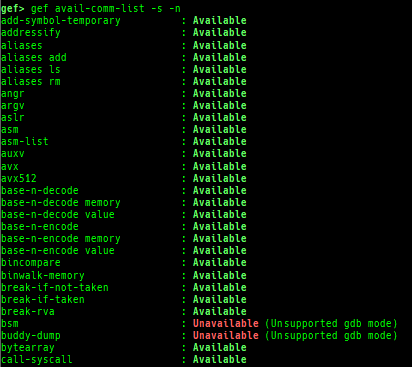
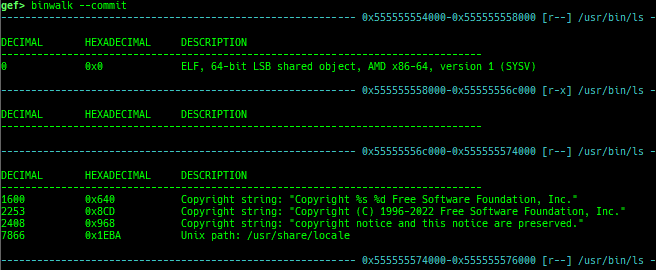
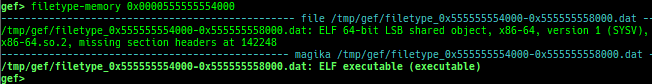
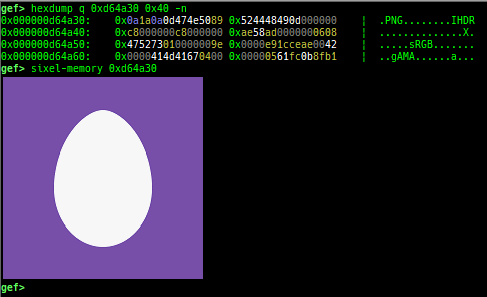
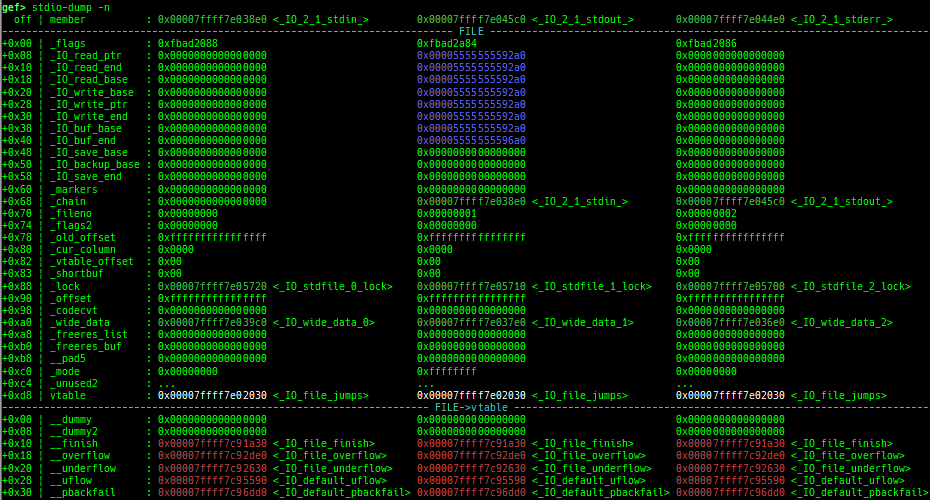
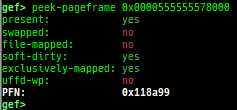
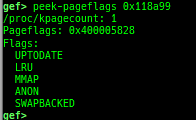
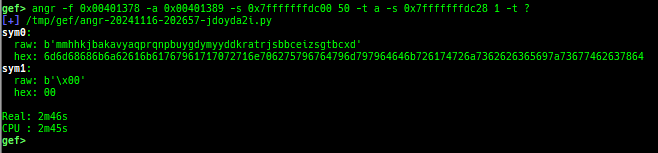
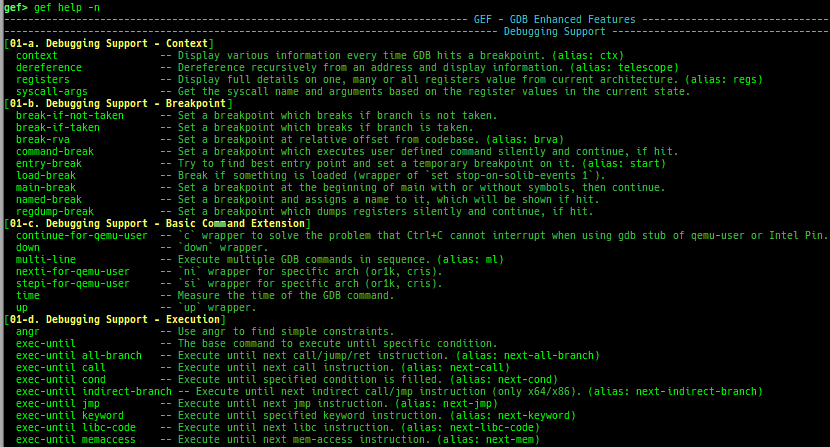
reset-bp: shows and resets all breakpoints.gef arch-list: displays defined architecture information.gef pyobj-list: displays defined global python object.gef avail-comm-list: displays a list of commands which are available or not for the current architecture and gdb execution mode.gef set-arch: sets a specific architecture to gef.gef check-update: checks for gef updates.binwalk-memory: scans memory bybinwalk.filetype-memory: scans memory byfileandmagika.sixel-memory: shows image to terminal byimagemagick.stdio-dump: dumps members of stdin/stdout/stderr.peek-pageframe: reads page frame data.peek-pageflags: reads page flags of a page frame.angr: finds simple constraints byangr.


- The category is introduced in
gef help. - Combined into one file (from gef-extra). The following are moved from gef-extras.
current-stack-frame,xref-telescope,bytearray, andbincompare.- This is because a single file is more attractive than ease of maintenance.
- The system-call table used by
syscall-argsis moved from gef-extras.- It was updated up to linux kernel 6.11.0 for each architecture.
- Removed some features I don't use.
$,ida-interact,gef-remote,pie,pcustom,ksymaddr,trace-run,bufferize,output redirectandshellcode.
- Many bugs fix / formatting / made it easy for me to use.
- See docs/FAQ.md.