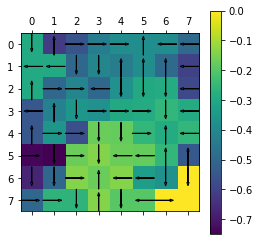
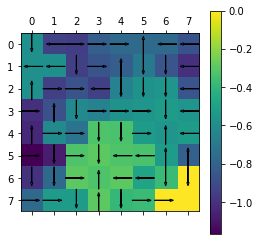
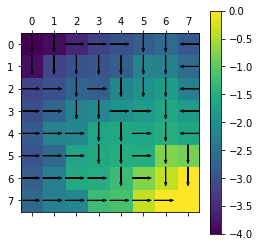
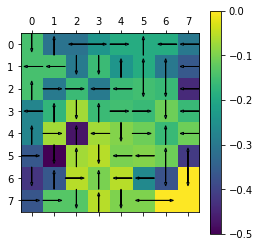
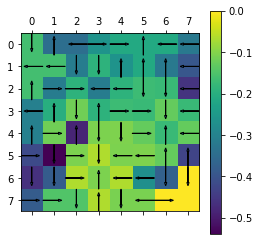
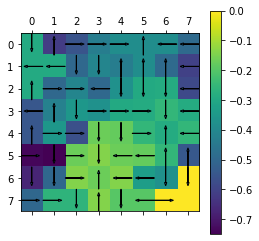
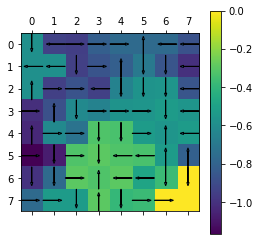
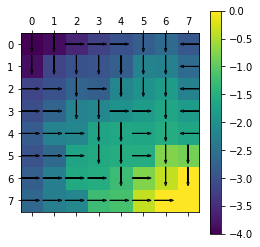
In this asignment we will be creating toy environments and map them to MDP based models (Value Iteration and Policy Iteration). We have used dynamic programming and bootstrapping to implement these agents, which learn to navigate through the environment to maximize returns.
├── assignment.pdf
├── agent.py
├── env.py
├── main.ipynb
├── README.md
├── main.pdf
└── main_files

2 directories, 6 files- env.py - Contanins code for the env in the Grid and Gambler problem. Details of the environment are given below in the appropriate sections.
- agent.py - Contains code for the various agents used.
- assignment.pdf - Contains details of the assignment.
- main.ipynb - Contains the plots of the policies generated by the various agents in different environments.
- main.pdf - contains .pdf format of the .ipynb notebook.
The environment consists of a grid with the start state as
and terminal state as
.
The reward for reaching the terminal state is else the reward
.
The possible actions in each stae are .
import env
import agent
import numpy as np
import matplotlib
import matplotlib.pyplot as plt
from mpl_toolkits.mplot3d import Axes3D
from matplotlib import cm


Env = env.Grid_1()
agent_1 = agent.ValueIteration(Env)
agent_2 = agent.PolicyIteration(Env)
agent_3 = agent.ConfusedAgent(Env)
- We train 3 agents corresponding to Value Iteration, Policy Iteration and Random.
def plot(Env,policy,V):
    pp = np.reshape(np.argmax(policy, axis=1), Env.shape)
    print(pp)

    cmp = plt.matshow(np.reshape(V, Env.shape))
    # plt.arrow(0,0.5,0,-0.7,head_width = 0.1)

    plt.colorbar(cmp)

    for i in range(Env.shape[0]):
        for j in range(Env.shape[1]):
            if i == (Env.shape[0]-1) and j == (Env.shape[1]-1):
                continue
            if pp[i][j] == 0:
                plt.arrow(j,i+0.5,0,-0.7,head_width = 0.1)
            elif pp[i][j] == 2:
                plt.arrow(j,i-0.5,0,+0.7,head_width = 0.1)
            elif pp[i][j] == 1:
                plt.arrow(j-0.5,i,0.7,0,head_width = 0.1)
            elif pp[i][j] == 3:
                plt.arrow(j+0.5,i,-0.7,0,head_width = 0.1)

    plt.show()
### Value Iteration
# agent_1.set_gamma(0.5)
agent_1.clear()
itr = 0
while True:
    agent_1.reset()
    agent_1.update()

    if agent_1.get_delta() < agent_1.get_threshold():
        break
    itr += 1

print(itr)
policy = agent_1.get_policy()
print(np.reshape(agent_1.V,Env.shape))
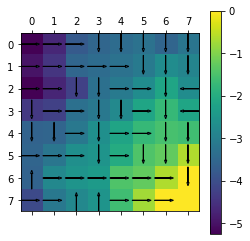
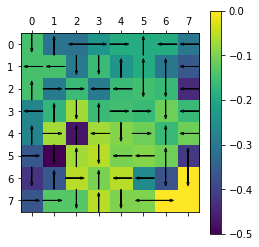
plot(Env,policy,agent_1.V)
# agent_1.clear()
121
[[-5.22041551 -4.66374662 -3.76022869 -3.51898212 -3.39792422 -3.27240293
  -3.53854272 -3.20898484]
 [-4.9694722  -4.4278591  -3.51898212 -3.39792422 -3.27240293 -3.1021674
  -2.68712729 -2.8775704 ]
 [-5.24781006 -4.71161351 -4.22887404 -3.31763094 -3.1021674  -2.68712729
  -2.16822194 -2.68712729]
 [-4.3842771  -4.22887404 -3.31763094 -3.15465386 -2.78012179 -2.16822194
  -1.72471154 -2.16822194]
 [-3.58602673 -3.53169027 -3.15465386 -2.63622143 -2.17376983 -1.72471154
  -1.52491241 -1.60236044]
 [-3.53169027 -3.19126    -2.63622143 -2.53203929 -2.01816864 -1.44891952
  -1.25594018 -0.62961128]
 [-3.58602673 -2.80017455 -2.53203929 -2.38232128 -1.44891952 -1.25594018
  -0.62961128  0.        ]
 [-4.07129585 -3.14357618 -2.80017455 -2.53203929 -1.6153412  -0.73101098
   0.          0.        ]]
[[1 1 1 2 2 2 2 2]
 [1 1 1 1 1 2 2 2]
 [1 1 2 2 1 1 2 3]
 [2 1 1 2 2 1 2 3]
 [2 2 1 2 1 1 2 2]
 [1 1 1 2 1 2 2 2]
 [0 1 1 1 1 1 1 2]
 [1 1 0 0 1 1 1 0]]
- In Value Iteration Algorithm, we initialize all the state values with
and apply the Bellman optimality operator until the point of constantcy (
) is reached.
- We get optimal policy using the following equation.
### Policy Iteration
# agent_2.set_gamma(0.5)
agent_2.clear()
while True:
    V = agent_2.evaluate_policy()
    # print(V)

    stable = agent_2.update()

    if stable == True:
        break

print(np.reshape(agent_2.V,Env.shape))
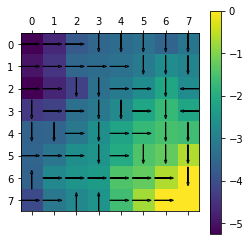
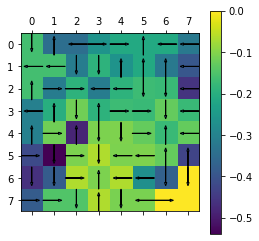
plot(Env,agent_2.policy,agent_2.V)
# agent_2.clear()
[[-5.22041551 -4.66374662 -3.76022869 -3.51898212 -3.39792422 -3.27240293
  -3.53854272 -3.20898484]
 [-4.9694722  -4.4278591  -3.51898212 -3.39792422 -3.27240293 -3.1021674
  -2.68712729 -2.8775704 ]
 [-5.24781006 -4.71161351 -4.22887404 -3.31763094 -3.1021674  -2.68712729
  -2.16822194 -2.68712729]
 [-4.3842771  -4.22887404 -3.31763094 -3.15465386 -2.78012179 -2.16822194
  -1.72471154 -2.16822194]
 [-3.58602673 -3.53169027 -3.15465386 -2.63622143 -2.17376983 -1.72471154
  -1.52491241 -1.60236044]
 [-3.53169027 -3.19126    -2.63622143 -2.53203929 -2.01816864 -1.44891952
  -1.25594018 -0.62961128]
 [-3.58602673 -2.80017455 -2.53203929 -2.38232128 -1.44891952 -1.25594018
  -0.62961128  0.        ]
 [-4.07129585 -3.14357618 -2.80017455 -2.53203929 -1.6153412  -0.73101098
   0.          0.        ]]
[[1 1 1 2 2 2 2 2]
 [1 1 1 1 1 2 2 2]
 [1 1 2 2 1 1 2 3]
 [2 1 1 2 2 1 2 3]
 [2 2 1 2 1 1 2 2]
 [1 1 1 2 1 2 2 2]
 [0 1 1 1 1 1 1 2]
 [1 1 0 0 1 1 1 0]]
- In Policy Iteration, we start with a random policy. This algorithm involves 2 parts:
- Policy Evaluation
- Policy Improvement
- In this we evaluate the current policy and return the final state value vector.
- Evaluation is done using the following equation:-
- We update the our current policy using the final state vector obtained from the policy evaluation step.
- Improvement is done as follows:-
In the above part, we show the state value vector and optimal policy for Policy Iteration Algorithm.
agent_3.get_policy()
print(np.reshape(agent_3.V,Env.shape))
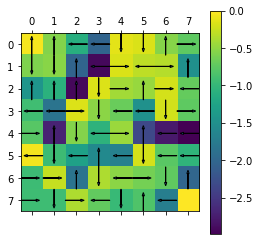
plot(Env,agent_3.policy,agent_3.V)
[[-0.04345    -0.55666888 -1.11333777 -2.0168557  -0.1255213  -0.17023553
  -0.53937516 -0.74397335]
 [-0.57585387 -0.53619655 -2.0168557  -2.92573268 -0.17023553 -0.29575683
  -0.33141444 -1.4879467 ]
 [-1.42734639 -1.07780964 -2.92573268 -0.16297707 -0.41504011 -0.46599235
  -0.19044311 -0.70934846]
 [-0.91915017 -1.83830034 -0.16297707 -0.51843243 -0.6814095  -1.47286136
  -0.19979913 -0.74597145]
 [-0.77347435 -2.69456567 -0.55503856 -1.04926075 -0.44905829 -2.33561133
  -2.78466962 -2.98446874]
 [-0.05433646 -0.94084391 -1.28127419 -1.56769318 -1.67187533 -0.19297934
  -0.76222846 -1.0312007 ]
 [-0.94084391 -0.26813526 -1.83631275 -0.36901193 -0.51872993 -0.6263289
  -0.73101098 -2.00394986]
 [-0.92771967 -0.92771967 -0.36901193 -0.71241356 -0.96835084 -0.81930824
  -1.70363847  0.        ]]
[[0 0 3 3 2 2 0 1]
 [2 2 0 3 1 3 1 0]
 [0 0 0 2 1 0 1 3]
 [3 3 1 2 3 3 2 1]
 [1 0 2 3 1 0 3 3]
 [3 2 3 0 3 2 3 3]
 [1 1 0 2 3 1 2 0]
 [1 2 1 3 2 0 3 2]]
We observe that the final state value vectors and optimal policies is the same for both value iteration and policy iteration algorithm.
def plot_mean_and_CI(mean, lb, ub, color_mean=None, color_shading=None):
    # plot the shaded range of the confidence intervals
    plt.fill_between(range(mean.shape[0]), ub, lb,
                     color=color_shading, alpha=.5)
    # plot the mean on top
    plt.plot(mean, color_mean)
agent_1.clear()

mu = []
low = []
high = []

while True:
    agent_1.reset()
    agent_1.update()

#     mu.append((np.matrix(np.reshape(agent_1.V,Env.shape)))[0][0])
#     mu.append(agent_1.V[0][0])
    mat = np.matrix(np.reshape(agent_1.V,Env.shape))
    mu.append(mat[0,0])

    low.append((np.matrix(np.reshape(agent_1.V,Env.shape))).min())
    high.append((np.matrix(np.reshape(agent_1.V,Env.shape))).max())

    if agent_1.get_delta() < agent_1.get_threshold():
        break

mu = np.array(mu)
high = np.array(high)
low = np.array(low)

print(mu)
plot_mean_and_CI(mu, high, low, color_mean='g--', color_shading='g')
[ 0.         -0.04345    -0.08689999 -0.13034999 -0.17379999 -0.21724999
 -0.26069998 -0.30414998 -0.34759998 -0.39104997 -0.43449997 -0.47794997
 -0.52139996 -0.56484996 -0.60829996 -0.65174996 -0.69519995 -0.73864995
 -0.78209995 -0.82554994 -0.86899994 -0.91244994 -0.95589993 -0.99934993
 -1.04279993 -1.08624993 -1.12969992 -1.17314992 -1.21659992 -1.26004991
 -1.30349991 -1.34694991 -1.3903999  -1.4338499  -1.4772999  -1.5207499
 -1.56419989 -1.60764989 -1.65109989 -1.69454988 -1.73799988 -1.78144988
 -1.82489988 -1.86834987 -1.91179987 -1.95524987 -1.99869986 -2.04214986
 -2.08559986 -2.12904985 -2.17249985 -2.21594985 -2.25939985 -2.30284984
 -2.34629984 -2.38974984 -2.43319983 -2.47664983 -2.52009983 -2.56354982
 -2.60699982 -2.65044982 -2.69389982 -2.73734981 -2.78079981 -2.82424981
 -2.8676998  -2.9111498  -2.9545998  -2.9980498  -3.04149979 -3.08494979
 -3.12839979 -3.17184978 -3.21529978 -3.25874978 -3.30219977 -3.34564977
 -3.38909977 -3.43254977 -3.47599976 -3.51944976 -3.56289976 -3.60634975
 -3.64979975 -3.69324975 -3.73669974 -3.78014974 -3.82359974 -3.86704974
 -3.91049973 -3.95394973 -3.99739973 -4.04084972 -4.08429972 -4.12774972
 -4.17119971 -4.21464971 -4.25809971 -4.30154971 -4.3449997  -4.3884497
 -4.4318997  -4.47534969 -4.51879969 -4.56224969 -4.60569969 -4.64914968
 -4.69259968 -4.73604968 -4.77949967 -4.82294967 -4.86639967 -4.90984966
 -4.95329966 -4.99674966 -5.04019966 -5.08364965 -5.12709965 -5.17054965
 -5.21399964 -5.22041551]
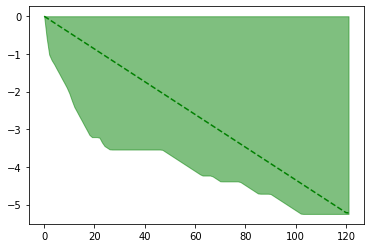
Above is the plot for the average value of the optimal state value function v/s number of iterations for value iteration
- We observe that as the number of iterations increases, the optimal reward value (average state value) converges to a constant value.
agent_2.clear()
mu = []
low = []
high = []

while True:
    V = agent_2.evaluate_policy()

#     mu.append((np.matrix(np.reshape(V,Env.shape))).mean())
    mat = np.matrix(np.reshape(agent_2.V,Env.shape))
    mu.append(mat[0,0])
    low.append((np.matrix(np.reshape(V,Env.shape))).min())
    high.append((np.matrix(np.reshape(V,Env.shape))).max())

    stable = agent_2.update()

    if stable == True:
        break

mu = np.array(mu)
high = np.array(high)
low = np.array(low)

print(mu)
plot_mean_and_CI(mu, high, low, color_mean='b--', color_shading='b')
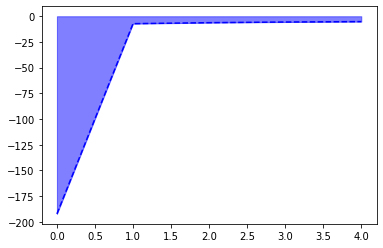
[-192.41222849 -7.22184676 -6.25734004 -5.62044015 -5.22041551]
Above is the plot for the average value of the optimal state value function v/s number of iterations for policy iteration
- We observe that as the number of iterations increases, the optimal reward value (average state value) converges to a constant value.
agent_3.clear()
mu = []
low = []
high = []

for i in range(100):
    agent_3.get_policy()

#     mu.append((np.matrix(np.reshape(agent_3.V,Env.shape))).mean())
    mat = np.matrix(np.reshape(agent_3.V,Env.shape))
    mu.append(mat[0,0])
    low.append((np.matrix(np.reshape(agent_3.V,Env.shape))).min())
    high.append((np.matrix(np.reshape(agent_3.V,Env.shape))).max())

mu = np.array(mu)
high = np.array(high)
low = np.array(low)

print(mu)
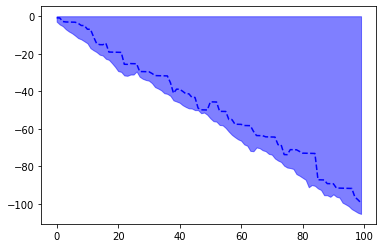
plot_mean_and_CI(mu, high, low, color_mean='b--', color_shading='b')
[ -0.85149252  -0.89494252  -2.82045201  -3.04805649  -3.09150649
  -3.13495648  -3.17840648  -3.77852536  -4.92484152  -4.96829152
  -6.91806603  -6.96151602 -10.97207975 -14.5501409  -15.12599477
 -15.16944477 -14.34906268 -19.06797577 -19.11142576 -19.15487576
 -19.19832576 -19.24177576 -25.58355328 -25.62700328 -25.22381249
 -25.26726249 -25.31071249 -29.43737012 -29.48082012 -29.52427012
 -29.56772011 -30.46266263 -31.61107069 -31.65452069 -31.69797068
 -31.74142068 -31.78487068 -35.36977725 -40.98164786 -38.837261
 -38.88071099 -39.99404876 -41.26846264 -41.31191264 -43.21823714
 -43.26168714 -48.93040912 -49.83392705 -49.87737705 -49.92082704
 -45.59886027 -45.64231027 -45.68576027 -50.64489701 -50.68834701
 -50.731797   -54.98156821 -55.02501821 -57.51033007 -57.55378007
 -57.59723007 -58.19734895 -58.24079895 -58.28424894 -61.28885544
 -63.54599585 -63.58944585 -63.63289584 -64.23301473 -64.27646472
 -64.31991472 -64.36336472 -68.40375532 -68.44720532 -73.68853667
 -73.73198667 -71.04513289 -71.08858288 -71.13203288 -72.0269754
 -72.92191792 -72.96536792 -73.00881791 -73.05226791 -73.09571791
 -87.10745609 -87.15090609 -87.19435609 -89.14413059 -89.18758059
 -89.23103059 -91.5098695  -91.5533195  -91.59676949 -91.64021949
 -91.68366949 -91.72711949 -96.30590684 -97.76609365 -99.46831686]
- By seeing the above plots we conclude that that the rewards obtained by confused agent may be higher but on an average the confused agent performs poorly than the learned agents.
- We also observe that the final average state value is same for both value iteration and policy iteration.
agent_1.clear()

# policies_value = []
# V_value = []

agent_1.set_gamma(0)
while True:
    agent_1.reset()
    agent_1.update()

    if agent_1.get_delta() < agent_1.get_threshold():
        break

policy = agent_1.get_policy()
print(np.reshape(agent_1.V,Env.shape))
plot(Env,policy,agent_1.V)
[[-0.14512055 -0.30882554 -0.30882554 -0.24017891 -0.19047494 -0.19047494
  -0.19047494 -0.30045085]
 [-0.14512055 -0.14512055 -0.29377688 -0.15884583 -0.24017891 -0.19047494
  -0.30045085 -0.36050373]
 [-0.14512055 -0.29377688 -0.15884583 -0.29377688 -0.15884583 -0.15183197
  -0.16053415 -0.44040548]
 [-0.27280255 -0.17011694 -0.06925676 -0.15884583 -0.15183197 -0.16053415
  -0.11034099 -0.16053415]
 [-0.27280255 -0.06925676 -0.47161264 -0.06925676 -0.09368626 -0.11034099
  -0.16053415 -0.11034099]
 [-0.36257063 -0.50018686 -0.06925676 -0.05339038 -0.10052064 -0.09368626
  -0.11034099 -0.41490262]
 [-0.4238164  -0.36257063 -0.05339038 -0.10052064 -0.05339038 -0.26303996
  -0.37154444  0.        ]
 [-0.36731126 -0.13121401 -0.13121401 -0.05339038 -0.09717174 -0.09717174
   0.          0.        ]]
[[2 0 3 1 1 0 3 3]
 [3 3 2 2 0 0 0 3]
 [0 1 1 3 3 2 2 3]
 [3 0 2 0 1 1 2 3]
 [0 1 0 3 2 1 0 3]
 [1 2 0 2 3 3 0 0]
 [2 0 1 0 3 3 2 2]
 [1 1 2 0 2 3 1 0]]
agent_1.clear()

# policies_value = []
# V_value = []

agent_1.set_gamma(0.1)
while True:
    agent_1.reset()
    agent_1.update()

    if agent_1.get_delta() < agent_1.get_threshold():
        break

policy = agent_1.get_policy()
print(np.reshape(agent_1.V,Env.shape))
plot(Env,policy,agent_1.V)
[[-0.16124344 -0.34313605 -0.34313605 -0.26134067 -0.21163671 -0.21163671
  -0.21163671 -0.32161262]
 [-0.16124344 -0.16124344 -0.31278745 -0.19012164 -0.26134067 -0.21163671
  -0.32161262 -0.39266309]
 [-0.16124344 -0.31278745 -0.19012164 -0.31278745 -0.19012164 -0.16916036
  -0.17329999 -0.45773387]
 [-0.30311091 -0.20139274 -0.11758913 -0.19012164 -0.16916036 -0.17329999
  -0.12766939 -0.17329999]
 [-0.30311091 -0.11758913 -0.48337086 -0.10692832 -0.10437809 -0.12766939
  -0.17329999 -0.12766939]
 [-0.41640676 -0.53837446 -0.10692832 -0.0640822  -0.10692832 -0.10437809
  -0.12766939 -0.42766846]
 [-0.462004   -0.38188914 -0.0640822  -0.10692832 -0.0640822  -0.26944764
  -0.37154444  0.        ]
 [-0.38188914 -0.14579189 -0.14579189 -0.0640822  -0.10796752 -0.10796752
   0.          0.        ]]
[[2 0 3 1 1 0 3 3]
 [3 3 2 2 0 0 0 3]
 [0 1 1 3 3 2 2 3]
 [3 0 2 0 1 1 2 3]
 [0 1 0 2 2 1 0 3]
 [1 2 1 2 3 3 0 0]
 [2 2 1 0 3 3 2 2]
 [1 1 2 0 2 3 1 0]]
agent_1.clear()

# policies_value = []
# V_value = []

agent_1.set_gamma(0.5)
while True:
    agent_1.reset()
    agent_1.update()

    if agent_1.get_delta() < agent_1.get_threshold():
        break

policy = agent_1.get_policy()
print(np.reshape(agent_1.V,Env.shape))
plot(Env,policy,agent_1.V)
[[-0.29023224 -0.61763222 -0.55453705 -0.43064222 -0.38093826 -0.38093826
  -0.38093826 -0.49091417]
 [-0.29023224 -0.29023224 -0.49758728 -0.40763051 -0.43064222 -0.38093826
  -0.49091417 -0.60595501]
 [-0.29023224 -0.49758728 -0.40763051 -0.49758728 -0.36935294 -0.29562629
  -0.28759844 -0.5841998 ]
 [-0.54558845 -0.41890161 -0.35296401 -0.36935294 -0.29562629 -0.28759844
  -0.25413532 -0.28759844]
 [-0.54558845 -0.35296401 -0.56741776 -0.16961688 -0.17849163 -0.25413532
  -0.28759844 -0.25413532]
 [-0.73728736 -0.74944148 -0.16961688 -0.13819575 -0.16961688 -0.17849163
  -0.25413532 -0.54196692]
 [-0.67307102 -0.49851726 -0.13819575 -0.16961688 -0.13819575 -0.3321362
  -0.37154444  0.        ]
 [-0.49851726 -0.26242001 -0.26242001 -0.13819575 -0.19433754 -0.19433754
   0.          0.        ]]
[[2 0 1 1 1 0 3 3]
 [3 3 2 2 0 0 0 3]
 [0 1 1 3 2 2 2 3]
 [3 0 2 1 1 1 2 3]
 [0 1 1 2 2 1 0 3]
 [1 2 1 2 3 3 0 0]
 [2 2 1 0 3 3 2 2]
 [1 1 2 0 2 3 1 0]]
agent_1.clear()

# policies_value = []
# V_value = []

agent_1.set_gamma(0.75)
while True:
    agent_1.reset()
    agent_1.update()

    if agent_1.get_delta() < agent_1.get_threshold():
        break

policy = agent_1.get_policy()
print(np.reshape(agent_1.V,Env.shape))
plot(Env,policy,agent_1.V)
[[-0.58046375 -0.93655564 -0.94790034 -0.81157952 -0.76187555 -0.76187555
  -0.76187555 -0.87185147]
 [-0.58046375 -0.58046375 -0.94376715 -0.86320238 -0.81157952 -0.69392968
  -0.85745711 -1.00359146]
 [-0.58046375 -0.94376715 -0.86666614 -0.94376715 -0.64820076 -0.5688836
  -0.55607352 -0.85745711]
 [-1.00943013 -0.87793725 -0.61193023 -0.64820076 -0.5688836  -0.55607352
  -0.52739263 -0.55607352]
 [-1.0298701  -0.61193023 -0.7235689  -0.3212776  -0.33464276 -0.52739263
  -0.55607352 -0.52739263]
 [-1.16573032 -1.07088514 -0.3212776  -0.29434688 -0.3212776  -0.33464276
  -0.52739263 -0.81044199]
 [-0.99451468 -0.76093661 -0.29434688 -0.3212776  -0.29434688 -0.48379693
  -0.37154444  0.        ]
 [-0.76093661 -0.52483936 -0.52483936 -0.29434688 -0.38867459 -0.37154444
   0.          0.        ]]
[[2 3 1 1 1 0 3 3]
 [3 3 2 1 0 2 2 3]
 [0 1 1 3 2 2 2 3]
 [1 0 2 1 1 1 2 3]
 [0 1 1 2 2 1 0 3]
 [1 2 1 2 3 3 0 0]
 [2 2 1 0 3 3 2 2]
 [1 1 2 0 2 1 1 0]]
agent_1.clear()

# policies_value = []
# V_value = []

agent_1.set_gamma(1)
while True:

    agent_1.reset()
    agent_1.update()

    if agent_1.get_delta() < agent_1.get_threshold():
        break

policy = agent_1.get_policy()
print(np.reshape(agent_1.V,Env.shape))
plot(Env,policy,agent_1.V)
[[-4.00052043 -3.87213884 -3.5688979  -3.22967614 -2.98949723 -2.79902229
  -2.59654604 -2.8969969 ]
 [-3.85539988 -3.15875858 -2.98864165 -2.94775684 -2.78891101 -2.21474088
  -2.23604231 -2.59654604]
 [-3.15875858 -2.98864165 -2.69486477 -2.78891101 -2.16901196 -1.9474688
  -1.79563683 -2.23604231]
 [-3.04585131 -2.69486477 -2.22325213 -2.15399537 -1.9474688  -1.79563683
  -1.63510268 -1.79563683]
 [-2.84204343 -2.22325213 -2.15399537 -1.67138298 -1.61115823 -1.63510268
  -1.52476168 -1.63510268]
 [-2.97756514 -2.61499451 -1.67138298 -1.57086235 -1.51747197 -1.52476168
  -0.76130864 -0.83198647]
 [-2.79131282 -2.29112596 -1.57086235 -1.51747197 -1.25443201 -0.76130864
  -0.37154444  0.        ]
 [-2.65161468 -2.28430342 -2.15308941 -1.25443201 -1.15726028 -0.37154444
   0.          0.        ]]
[[2 2 1 1 1 2 2 3]
 [2 2 2 2 2 2 2 3]
 [1 1 2 1 2 2 2 3]
 [1 1 2 2 1 1 2 3]
 [1 1 1 2 2 1 2 3]
 [1 1 1 2 2 1 2 2]
 [1 1 1 1 2 1 2 2]
 [1 1 1 1 1 1 1 0]]
agent_2.clear()
agent_2.set_gamma(0)
while True:
    V = agent_2.evaluate_policy()
    # print(V)

    stable = agent_2.update()

    if stable == True:
        break

print(np.reshape(agent_2.V,Env.shape))
plot(Env,agent_2.policy,agent_2.V)
[[-0.14512055 -0.30882554 -0.30882554 -0.24017891 -0.19047494 -0.19047494
  -0.19047494 -0.30045085]
 [-0.14512055 -0.14512055 -0.29377688 -0.15884583 -0.24017891 -0.19047494
  -0.30045085 -0.36050373]
 [-0.14512055 -0.29377688 -0.15884583 -0.29377688 -0.15884583 -0.15183197
  -0.16053415 -0.44040548]
 [-0.27280255 -0.17011694 -0.06925676 -0.15884583 -0.15183197 -0.16053415
  -0.11034099 -0.16053415]
 [-0.27280255 -0.06925676 -0.47161264 -0.06925676 -0.09368626 -0.11034099
  -0.16053415 -0.11034099]
 [-0.36257063 -0.50018686 -0.06925676 -0.05339038 -0.10052064 -0.09368626
  -0.11034099 -0.41490262]
 [-0.4238164  -0.36257063 -0.05339038 -0.10052064 -0.05339038 -0.26303996
  -0.37154444  0.        ]
 [-0.36731126 -0.13121401 -0.13121401 -0.05339038 -0.09717174 -0.09717174
   0.          0.        ]]
[[2 0 3 1 1 0 3 3]
 [3 3 2 2 0 0 0 3]
 [0 1 1 3 3 2 2 3]
 [3 0 2 0 1 1 2 3]
 [0 1 0 3 2 1 0 3]
 [1 2 0 2 3 3 0 0]
 [2 0 1 0 3 3 2 2]
 [1 1 2 0 2 3 1 0]]
agent_2.clear()
agent_2.set_gamma(0.1)
while True:
    V = agent_2.evaluate_policy()
    # print(V)

    stable = agent_2.update()

    if stable == True:
        break

print(np.reshape(agent_2.V,Env.shape))
plot(Env,agent_2.policy,agent_2.V)
[[-0.16124344 -0.34313605 -0.34313605 -0.26134067 -0.21163671 -0.21163671
  -0.21163671 -0.32161262]
 [-0.16124344 -0.16124344 -0.31278745 -0.19012164 -0.26134067 -0.21163671
  -0.32161262 -0.39266309]
 [-0.16124344 -0.31278745 -0.19012164 -0.31278745 -0.19012164 -0.16916036
  -0.17329999 -0.45773387]
 [-0.30311091 -0.20139274 -0.11758913 -0.19012164 -0.16916036 -0.17329999
  -0.12766939 -0.17329999]
 [-0.30311091 -0.11758913 -0.48337086 -0.10692832 -0.10437809 -0.12766939
  -0.17329999 -0.12766939]
 [-0.41640676 -0.53837446 -0.10692832 -0.0640822  -0.10692832 -0.10437809
  -0.12766939 -0.42766846]
 [-0.462004   -0.38188914 -0.0640822  -0.10692832 -0.0640822  -0.26944764
  -0.37154444  0.        ]
 [-0.38188914 -0.14579189 -0.14579189 -0.0640822  -0.10796752 -0.10796752
   0.          0.        ]]
[[2 0 3 1 1 0 3 3]
 [3 3 2 2 0 0 0 3]
 [0 1 1 3 3 2 2 3]
 [3 0 2 0 1 1 2 3]
 [0 1 0 2 2 1 0 3]
 [1 2 1 2 3 3 0 0]
 [2 2 1 0 3 3 2 2]
 [1 1 2 0 2 3 1 0]]
agent_2.clear()
agent_2.set_gamma(0.5)
while True:
    V = agent_2.evaluate_policy()
    # print(V)

    stable = agent_2.update()

    if stable == True:
        break

print(np.reshape(agent_2.V,Env.shape))
plot(Env,agent_2.policy,agent_2.V)
[[-0.29023224 -0.61763222 -0.55453705 -0.43064222 -0.38093826 -0.38093826
  -0.38093826 -0.49091417]
 [-0.29023224 -0.29023224 -0.49758728 -0.40763051 -0.43064222 -0.38093826
  -0.49091417 -0.60595501]
 [-0.29023224 -0.49758728 -0.40763051 -0.49758728 -0.36935294 -0.29562629
  -0.28759844 -0.5841998 ]
 [-0.54558845 -0.41890161 -0.35296401 -0.36935294 -0.29562629 -0.28759844
  -0.25413532 -0.28759844]
 [-0.54558845 -0.35296401 -0.56741776 -0.16961688 -0.17849163 -0.25413532
  -0.28759844 -0.25413532]
 [-0.73728736 -0.74944148 -0.16961688 -0.13819575 -0.16961688 -0.17849163
  -0.25413532 -0.54196692]
 [-0.67307102 -0.49851726 -0.13819575 -0.16961688 -0.13819575 -0.3321362
  -0.37154444  0.        ]
 [-0.49851726 -0.26242001 -0.26242001 -0.13819575 -0.19433754 -0.19433754
   0.          0.        ]]
[[2 0 1 1 1 0 3 3]
 [3 3 2 2 0 0 0 3]
 [0 1 1 3 2 2 2 3]
 [3 0 2 1 1 1 2 3]
 [0 1 1 2 2 1 0 3]
 [1 2 1 2 3 3 0 0]
 [2 2 1 0 3 3 2 2]
 [1 1 2 0 2 3 1 0]]
agent_2.clear()
agent_2.set_gamma(0.75)
while True:
    V = agent_2.evaluate_policy()
    # print(V)

    stable = agent_2.update()

    if stable == True:
        break

print(np.reshape(agent_2.V,Env.shape))
plot(Env,agent_2.policy,agent_2.V)
[[-0.58046375 -0.93655564 -0.94790034 -0.81157952 -0.76187555 -0.76187555
  -0.76187555 -0.87185147]
 [-0.58046375 -0.58046375 -0.94376715 -0.86320238 -0.81157952 -0.69392968
  -0.85745711 -1.00359146]
 [-0.58046375 -0.94376715 -0.86666614 -0.94376715 -0.64820076 -0.5688836
  -0.55607352 -0.85745711]
 [-1.00943013 -0.87793725 -0.61193023 -0.64820076 -0.5688836  -0.55607352
  -0.52739263 -0.55607352]
 [-1.0298701  -0.61193023 -0.7235689  -0.3212776  -0.33464276 -0.52739263
  -0.55607352 -0.52739263]
 [-1.16573032 -1.07088514 -0.3212776  -0.29434688 -0.3212776  -0.33464276
  -0.52739263 -0.81044199]
 [-0.99451468 -0.76093661 -0.29434688 -0.3212776  -0.29434688 -0.48379693
  -0.37154444  0.        ]
 [-0.76093661 -0.52483936 -0.52483936 -0.29434688 -0.38867459 -0.37154444
   0.          0.        ]]
[[2 3 1 1 1 0 3 3]
 [3 3 2 1 0 2 2 3]
 [0 1 1 3 2 2 2 3]
 [1 0 2 1 1 1 2 3]
 [0 1 1 2 2 1 0 3]
 [1 2 1 2 3 3 0 0]
 [2 2 1 0 3 3 2 2]
 [1 1 2 0 2 1 1 0]]
agent_2.clear()
agent_2.set_gamma(1)
while True:
    V = agent_2.evaluate_policy()
    # print(V)

    stable = agent_2.update()

    if stable == True:
        break

print(np.reshape(agent_2.V,Env.shape))
plot(Env,agent_2.policy,agent_2.V)
[[-4.00052043 -3.87213884 -3.5688979  -3.22967614 -2.98949723 -2.79902229
  -2.59654604 -2.8969969 ]
 [-3.85539988 -3.15875858 -2.98864165 -2.94775684 -2.78891101 -2.21474088
  -2.23604231 -2.59654604]
 [-3.15875858 -2.98864165 -2.69486477 -2.78891101 -2.16901196 -1.9474688
  -1.79563683 -2.23604231]
 [-3.04585131 -2.69486477 -2.22325213 -2.15399537 -1.9474688  -1.79563683
  -1.63510268 -1.79563683]
 [-2.84204343 -2.22325213 -2.15399537 -1.67138298 -1.61115823 -1.63510268
  -1.52476168 -1.63510268]
 [-2.97756514 -2.61499451 -1.67138298 -1.57086235 -1.51747197 -1.52476168
  -0.76130864 -0.83198647]
 [-2.79131282 -2.29112596 -1.57086235 -1.51747197 -1.25443201 -0.76130864
  -0.37154444  0.        ]
 [-2.65161468 -2.28430342 -2.15308941 -1.25443201 -1.15726028 -0.37154444
   0.          0.        ]]
[[2 2 1 1 1 2 2 3]
 [2 2 2 2 2 2 2 3]
 [1 1 2 1 2 2 2 3]
 [1 1 2 2 1 1 2 3]
 [1 1 1 2 2 1 2 3]
 [1 1 1 2 2 1 2 2]
 [1 1 1 1 2 1 2 2]
 [1 1 1 1 1 1 1 0]]
We observe that different values of result in different policies.
If value of , then the agent focusses on short term gains and acts greedily.
If the value of , then the agent will put more weight on long term gains and will not act greedily.
In our MDP, as , we obtain a better policy.
- A gambler has the opportunity to make bets on the outcomes of a sequence of coin flips. If the coin comes up heads, he wins as many dollars as he has staked on that flip; if it is tails, he loses his stake. The game ends when the gambler wins by reaching his goal of $100, or loses by running out of money.
- On each flip, the gambler must decide what portion of his capital to stake, in integer numbers of dollars.
where $ and
are terminal states.
- The Bellman Update Equation for this problem will be as follows:
Gambler_env = env.Gambler_env()
Gambler_env.set_p_h(0.3)
agent_1 = agent.Gambler_ValueIteration(Gambler_env)
Gambler_env.set_p_h(0.15)
agent_2 = agent.Gambler_ValueIteration(Gambler_env)
Gambler_env.set_p_h(0.65)
agent_3 = agent.Gambler_ValueIteration(Gambler_env)
def plot_fig1(y):
    x = range(100)

    for i in range(1,len(y)):
        plt.plot(x,y[i][:100])
    plt.show()
def plot_fig2(policy):
    x = range(100)

    plt.bar(x,policy)

    plt.show()
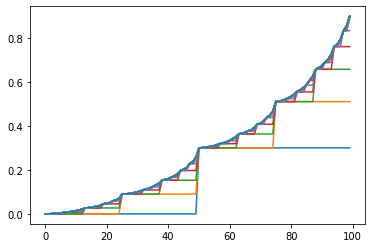
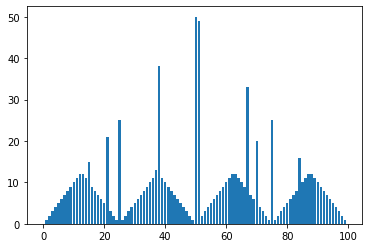
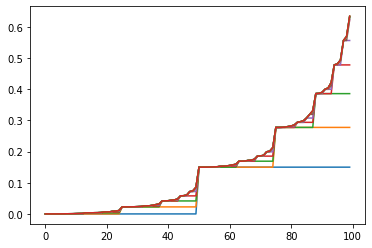
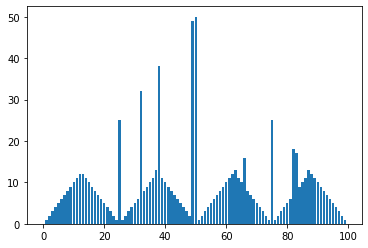
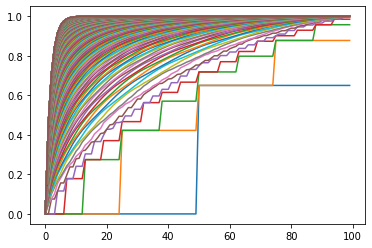
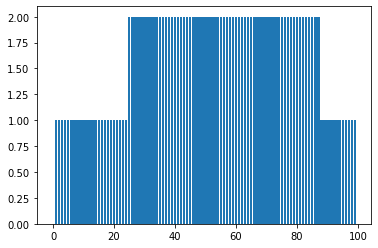
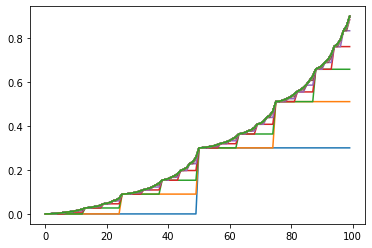
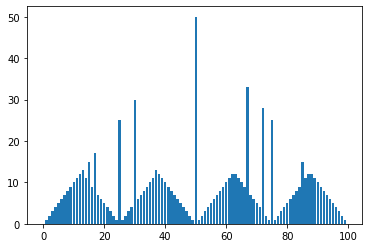
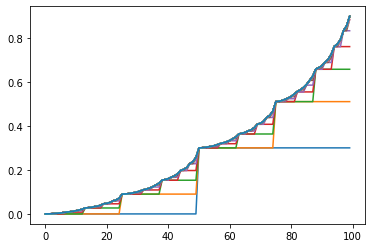
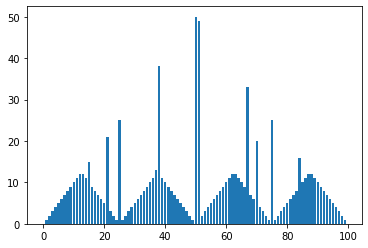
Plots showing the iterations of Value Iteration Algorithm and the optimal policy for different values of )
- The first plots shows the state-value function then gives the probability of winning from each state.
- The second plots shows the optimal policy , that is a mapping from levels of capital to stakes.
agent_1.clear()
y = []
while True:

    agent_1.reset()
    agent_1.update()

    y.append(agent_1.V)

    if agent_1.get_delta() < agent_1.get_threshold():
        break

policy = agent_1.get_policy()
print(agent_1.get_policy())
print(agent_1.V)
[ 0.  1.  2.  3.  4.  5.  6.  7.  8.  9. 10. 11. 12. 12. 11. 15.  9.  8.
  7.  6.  5. 21.  3.  2.  1. 25.  1.  2.  3.  4.  5.  6.  7.  8.  9. 10.
 11. 13. 38. 11. 10.  9.  8.  7.  6.  5.  4.  3.  2.  1. 50. 49.  2.  3.
  4.  5.  6.  7.  8.  9. 10. 11. 12. 12. 11. 10.  9. 33.  7.  6. 20.  4.
  3.  2.  1. 25.  1.  2.  3.  4.  5.  6.  7.  8. 16. 10. 11. 12. 12. 11.
 10.  9.  8.  7.  6.  5.  4.  3.  2.  1.]
[0.00000000e+00 2.66917018e-04 8.89723393e-04 1.92325355e-03
 2.96574464e-03 4.32158176e-03 6.41084517e-03 8.50388325e-03
 9.88581548e-03 1.18309578e-02 1.44052725e-02 1.77664658e-02
 2.13694839e-02 2.71868419e-02 2.83462775e-02 3.00251072e-02
 3.29527183e-02 3.52816705e-02 3.94365260e-02 4.60307893e-02
 4.80175751e-02 5.16971693e-02 5.92215525e-02 6.31880185e-02
 7.12316130e-02 9.00000000e-02 9.06228064e-02 9.20760213e-02
 9.44875916e-02 9.69200708e-02 1.00083691e-01 1.04958639e-01
 1.09842394e-01 1.13066903e-01 1.17605568e-01 1.23612303e-01
 1.31455087e-01 1.39862129e-01 1.53435964e-01 1.56141314e-01
 1.60058584e-01 1.66889676e-01 1.72323898e-01 1.82018561e-01
 1.97405175e-01 2.02041008e-01 2.10626728e-01 2.28183623e-01
 2.37438710e-01 2.56207097e-01 3.00000000e-01 3.00622806e-01
 3.02076021e-01 3.04487592e-01 3.06920071e-01 3.10083691e-01
 3.14958639e-01 3.19842394e-01 3.23066903e-01 3.27605568e-01
 3.33612303e-01 3.41455087e-01 3.49862129e-01 3.63435964e-01
 3.66141314e-01 3.70058584e-01 3.76889676e-01 3.82323898e-01
 3.92018561e-01 4.07405175e-01 4.12041008e-01 4.20626728e-01
 4.38183623e-01 4.47438710e-01 4.66207097e-01 5.10000000e-01
 5.11453215e-01 5.14844050e-01 5.20471047e-01 5.26146832e-01
 5.33528612e-01 5.44903490e-01 5.56298920e-01 5.63822773e-01
 5.74412993e-01 5.88428706e-01 6.06728536e-01 6.26344968e-01
 6.58017250e-01 6.64329733e-01 6.73470028e-01 6.89409244e-01
 7.02089095e-01 7.24709975e-01 7.60612075e-01 7.71429020e-01
 7.91462366e-01 8.32428453e-01 8.54023656e-01 8.97816560e-01
 0.00000000e+00]
plot_fig1(y)
plot_fig2(policy)
agent_2.clear()
y = []
while True:

    agent_2.reset()
    agent_2.update()

    y.append(agent_2.V)

    if agent_2.get_delta() < agent_2.get_threshold():
        break

policy = agent_2.get_policy()
print(policy)
print(agent_2.V)
[ 0.  1.  2.  3.  4.  5.  6.  7.  8.  9. 10. 11. 12. 12. 11. 10.  9.  8.
  7.  6.  5.  4.  3.  2.  1. 25.  1.  2.  3.  4.  5.  6. 32.  8.  9. 10.
 11. 13. 38. 11. 10.  9.  8.  7.  6.  5.  4.  3.  2. 49. 50.  1.  2.  3.
  4.  5.  6.  7.  8.  9. 10. 11. 12. 13. 11. 10. 16.  8.  7.  6.  5.  4.
  3.  2.  1. 25.  1.  2.  3.  4.  5.  6. 18. 17.  9. 10. 11. 13. 12. 11.
 10.  9.  8.  7.  6.  5.  4.  3.  2.  1.]
[0.00000000e+00 1.92759560e-06 1.28536475e-05 3.73999231e-05
 8.57080408e-05 1.42805249e-04 2.49880557e-04 5.10991667e-04
 5.71386939e-04 6.72316904e-04 9.52034995e-04 1.30250559e-03
 1.66587038e-03 3.37663800e-03 3.40670777e-03 3.49636996e-03
 3.80934292e-03 3.94646937e-03 4.48212975e-03 6.24514185e-03
 6.34689997e-03 6.72948446e-03 8.68337057e-03 9.09506179e-03
 1.11058025e-02 2.25000000e-02 2.25109230e-02 2.25728373e-02
 2.27119329e-02 2.29856789e-02 2.33092297e-02 2.39159898e-02
 2.53956194e-02 2.57378593e-02 2.63097958e-02 2.78948650e-02
 2.98808650e-02 3.19399321e-02 4.16342820e-02 4.18046774e-02
 4.23127631e-02 4.40862765e-02 4.48633264e-02 4.78987352e-02
 5.78891372e-02 5.84657665e-02 6.06337453e-02 7.17057666e-02
 7.40386835e-02 8.54328810e-02 1.50000000e-01 1.50010923e-01
 1.50072837e-01 1.50211933e-01 1.50485679e-01 1.50809230e-01
 1.51415990e-01 1.52895619e-01 1.53237859e-01 1.53809796e-01
 1.55394865e-01 1.57380865e-01 1.59439932e-01 1.69134282e-01
 1.69304677e-01 1.69812763e-01 1.71586277e-01 1.72363326e-01
 1.75398735e-01 1.85389137e-01 1.85965766e-01 1.88133745e-01
 1.99205767e-01 2.01538684e-01 2.12932881e-01 2.77500000e-01
 2.77561897e-01 2.77912745e-01 2.78700953e-01 2.80252180e-01
 2.82085635e-01 2.85523942e-01 2.93908510e-01 2.95847869e-01
 2.99088843e-01 3.08070902e-01 3.19324902e-01 3.30992949e-01
 3.85927598e-01 3.86893172e-01 3.89772324e-01 3.99822234e-01
 4.04225516e-01 4.21426166e-01 4.78038444e-01 4.81306010e-01
 4.93591223e-01 5.56332677e-01 5.69552540e-01 6.34119659e-01
 0.00000000e+00]
plot_fig1(y)
plot_fig2(policy)
agent_3.clear()
y = []
while True:

    agent_3.reset()
    agent_3.update()

    y.append(agent_3.V)
    if agent_3.get_delta() < agent_3.get_threshold():
        break

policy = agent_3.get_policy()
print(policy)
print(agent_3.V)
[0. 1. 1. 1. 1. 1. 1. 1. 1. 1. 1. 1. 1. 1. 1. 1. 1. 1. 1. 1. 1. 1. 1. 1.
 1. 2. 2. 2. 2. 2. 2. 2. 2. 2. 2. 2. 2. 2. 2. 2. 2. 2. 2. 2. 2. 2. 2. 2.
 2. 2. 2. 2. 2. 2. 2. 2. 2. 2. 2. 2. 2. 2. 2. 2. 2. 2. 2. 2. 2. 2. 2. 2.
 2. 2. 2. 2. 2. 2. 2. 2. 2. 2. 2. 2. 2. 2. 2. 2. 1. 1. 1. 1. 1. 1. 1. 1.
 1. 1. 1. 1.]
[0.         0.46137334 0.70981407 0.84360309 0.91565822 0.9544721
 0.97538609 0.98666051 0.99274307 0.99602866 0.99780691 0.99877234
 0.99929903 0.99958853 0.99974948 0.99984048 0.9998932  0.99992476
 0.99994446 0.99995737 0.99996628 0.99997274 0.99997763 0.99998147
 0.99998454 0.99998706 0.99998911 0.99999081 0.9999922  0.99999336
 0.99999432 0.99999513 0.9999958  0.99999638 0.99999686 0.99999728
 0.99999763 0.99999794 0.9999982  0.99999843 0.99999862 0.9999988
 0.99999894 0.99999907 0.99999919 0.99999929 0.99999938 0.99999945
 0.99999952 0.99999958 0.99999963 0.99999968 0.99999972 0.99999975
 0.99999978 0.99999981 0.99999984 0.99999986 0.99999987 0.99999989
 0.99999991 0.99999992 0.99999993 0.99999994 0.99999995 0.99999995
 0.99999996 0.99999997 0.99999997 0.99999998 0.99999998 0.99999998
 0.99999998 0.99999999 0.99999999 0.99999999 0.99999999 0.99999999
 0.99999999 1.         1.         1.         1.         1.
 1.         1.         1.         1.         1.         1.
 1.         1.         1.         1.         1.         1.
 1.         1.         1.         1.         0.        ]
plot_fig1(y)
plot_fig2(policy)
agent_1.set_threshold(0.00000000000000001)
agent_1.clear()
y = []
while True:

    agent_1.reset()
    agent_1.update()

    y.append(agent_1.V)
    if agent_1.get_delta() < agent_1.get_threshold():
        break

policy = agent_1.get_policy()
print(policy)
print(agent_1.V)
[ 0.  1.  2.  3.  4.  5.  6.  7.  8.  9. 10. 11. 12. 13. 11. 15.  9. 17.
  7.  6.  5.  4.  3.  2.  1. 25.  1.  2.  3.  4. 30.  6.  7.  8.  9. 10.
 11. 13. 12. 11. 10.  9.  8.  7.  6.  5.  4.  3.  2.  1. 50.  1.  2.  3.
  4.  5.  6.  7.  8.  9. 10. 11. 12. 12. 11. 10.  9. 33.  7.  6.  5.  4.
 28.  2.  1. 25.  1.  2.  3.  4.  5.  6.  7.  8.  9. 15. 11. 12. 12. 11.
 10.  9.  8.  7.  6.  5.  4.  3.  2.  1.]
[0.00000000e+00 2.66917018e-04 8.89723393e-04 1.92325355e-03
 2.96574464e-03 4.32158176e-03 6.41084517e-03 8.50388325e-03
 9.88581548e-03 1.18309578e-02 1.44052725e-02 1.77664658e-02
 2.13694839e-02 2.71868419e-02 2.83462775e-02 3.00251072e-02
 3.29527183e-02 3.52816705e-02 3.94365260e-02 4.60307893e-02
 4.80175751e-02 5.16971693e-02 5.92215525e-02 6.31880185e-02
 7.12316130e-02 9.00000000e-02 9.06228064e-02 9.20760213e-02
 9.44875916e-02 9.69200708e-02 1.00083691e-01 1.04958639e-01
 1.09842394e-01 1.13066903e-01 1.17605568e-01 1.23612303e-01
 1.31455087e-01 1.39862129e-01 1.53435964e-01 1.56141314e-01
 1.60058584e-01 1.66889676e-01 1.72323898e-01 1.82018561e-01
 1.97405175e-01 2.02041008e-01 2.10626728e-01 2.28183623e-01
 2.37438710e-01 2.56207097e-01 3.00000000e-01 3.00622806e-01
 3.02076021e-01 3.04487592e-01 3.06920071e-01 3.10083691e-01
 3.14958639e-01 3.19842394e-01 3.23066903e-01 3.27605568e-01
 3.33612303e-01 3.41455087e-01 3.49862129e-01 3.63435964e-01
 3.66141314e-01 3.70058584e-01 3.76889676e-01 3.82323898e-01
 3.92018561e-01 4.07405175e-01 4.12041008e-01 4.20626728e-01
 4.38183623e-01 4.47438710e-01 4.66207097e-01 5.10000000e-01
 5.11453215e-01 5.14844050e-01 5.20471047e-01 5.26146832e-01
 5.33528612e-01 5.44903490e-01 5.56298920e-01 5.63822773e-01
 5.74412993e-01 5.88428706e-01 6.06728536e-01 6.26344968e-01
 6.58017250e-01 6.64329733e-01 6.73470028e-01 6.89409244e-01
 7.02089095e-01 7.24709975e-01 7.60612075e-01 7.71429020e-01
 7.91462366e-01 8.32428453e-01 8.54023656e-01 8.97816560e-01
 0.00000000e+00]
plot_fig1(y)
plot_fig2(policy)
agent_1.set_threshold(0.00000000000001)
agent_1.clear()
y = []
while True:

    agent_1.reset()
    agent_1.update()

    y.append(agent_1.V)
    if agent_1.get_delta() < agent_1.get_threshold():
        break

policy = agent_1.get_policy()
print(policy)
print(agent_1.V)
[ 0.  1.  2.  3.  4.  5.  6.  7.  8.  9. 10. 11. 12. 12. 11. 15.  9.  8.
  7.  6.  5. 21.  3.  2.  1. 25.  1.  2.  3.  4.  5.  6.  7.  8.  9. 10.
 11. 13. 38. 11. 10.  9.  8.  7.  6.  5.  4.  3.  2.  1. 50. 49.  2.  3.
  4.  5.  6.  7.  8.  9. 10. 11. 12. 12. 11. 10.  9. 33.  7.  6. 20.  4.
  3.  2.  1. 25.  1.  2.  3.  4.  5.  6.  7.  8. 16. 10. 11. 12. 12. 11.
 10.  9.  8.  7.  6.  5.  4.  3.  2.  1.]
[0.00000000e+00 2.66917018e-04 8.89723393e-04 1.92325355e-03
 2.96574464e-03 4.32158176e-03 6.41084517e-03 8.50388325e-03
 9.88581548e-03 1.18309578e-02 1.44052725e-02 1.77664658e-02
 2.13694839e-02 2.71868419e-02 2.83462775e-02 3.00251072e-02
 3.29527183e-02 3.52816705e-02 3.94365260e-02 4.60307893e-02
 4.80175751e-02 5.16971693e-02 5.92215525e-02 6.31880185e-02
 7.12316130e-02 9.00000000e-02 9.06228064e-02 9.20760213e-02
 9.44875916e-02 9.69200708e-02 1.00083691e-01 1.04958639e-01
 1.09842394e-01 1.13066903e-01 1.17605568e-01 1.23612303e-01
 1.31455087e-01 1.39862129e-01 1.53435964e-01 1.56141314e-01
 1.60058584e-01 1.66889676e-01 1.72323898e-01 1.82018561e-01
 1.97405175e-01 2.02041008e-01 2.10626728e-01 2.28183623e-01
 2.37438710e-01 2.56207097e-01 3.00000000e-01 3.00622806e-01
 3.02076021e-01 3.04487592e-01 3.06920071e-01 3.10083691e-01
 3.14958639e-01 3.19842394e-01 3.23066903e-01 3.27605568e-01
 3.33612303e-01 3.41455087e-01 3.49862129e-01 3.63435964e-01
 3.66141314e-01 3.70058584e-01 3.76889676e-01 3.82323898e-01
 3.92018561e-01 4.07405175e-01 4.12041008e-01 4.20626728e-01
 4.38183623e-01 4.47438710e-01 4.66207097e-01 5.10000000e-01
 5.11453215e-01 5.14844050e-01 5.20471047e-01 5.26146832e-01
 5.33528612e-01 5.44903490e-01 5.56298920e-01 5.63822773e-01
 5.74412993e-01 5.88428706e-01 6.06728536e-01 6.26344968e-01
 6.58017250e-01 6.64329733e-01 6.73470028e-01 6.89409244e-01
 7.02089095e-01 7.24709975e-01 7.60612075e-01 7.71429020e-01
 7.91462366e-01 8.32428453e-01 8.54023656e-01 8.97816560e-01
 0.00000000e+00]
plot_fig1(y)
plot_fig2(policy)
- We see from the above plots that as
, the state value matrix and the optimal policy becomes stable for
.
- Jack manages two locations for a nationwide car rental company. Each day, some number of customers arrive at each location to rent cars. If Jack has a car available, he rents it out and is credited $10 by the national company.
- If he is out of cars at that location, then the business is lost. Cars become available for renting the day after they are returned. To help ensure that cars are available where they are needed, Jack can move them between the two locations overnight, at a cost of $2 per car moved.
- We assume that the number of cars requested and returned at each location are Poisson random variables, meaning that the probability that the number is n is:
- where
is the expected number. Suppose
is 3 and 4 for rental requests at the first and second locations and 3 and 2 for returns.
- To simplify the problem slightly, we assume that there can be no more than 20 cars at each location (any additional cars are returned to the nationwide company, and thus disappear from the problem) and a maximum of five cars can be moved from one location to the other in one night.
-
Let number of cars rented at location 1 and location 2 be
and
respectively and cars returned be
and
.That is, given
.
-
Given a state
, if number of cars moved are
and final state is
, then:
Assumption: I have assumed an upper bound of 8 on the number of cars that can be rented or returned as  \to 0) for
for  .
.
-
The Bellman Update Equation for this problem will be as follows:
2. Policy Improvement:
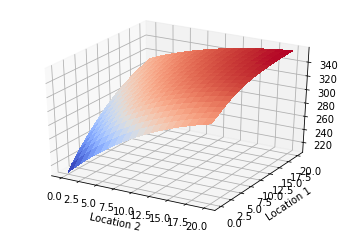
def three_dimentional_plot(V):
    fig = plt.figure()
    ax = fig.gca(projection = '3d')
    X = np.arange(0,V.shape[0],1)
    Y = np.arange(0,V.shape[1],1)
    X,Y = np.meshgrid(X,Y)
    surf = ax.plot_surface(X,Y,V,rstride = 1,cstride = 1,cmap = cm.coolwarm,linewidth = 0,antialiased = False)
    ax.set_xlabel('Location 2')
    ax.set_ylabel('Location 1')
    plt.show()
def plot_policy(all_P):
    itr = 0
    for pi in all_P:
        cmp = plt.matshow(pi)
        plt.xlabel('Location 2')
        plt.ylabel('Location 1')
        plt.colorbar(cmp)
    plt.show()
Jack_env = env.Jack_env()
agent_1 = agent.Jack_PolicyIteration(Jack_env)


all_V = []
all_P = []

all_P.append(agent_1.policy.copy())

while True:
    agent_1.evaluate_policy()
    stable = agent_1.update()

    all_V.append(agent_1.V.copy())
    all_P.append(np.flip(agent_1.policy.copy(),0))
    if stable == True:
        break
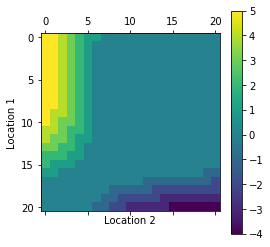
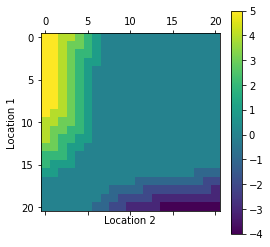
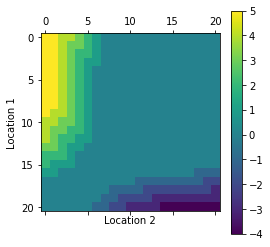
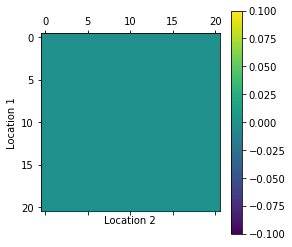
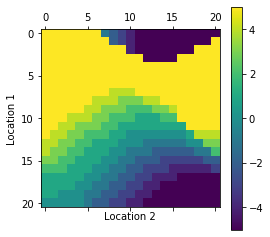
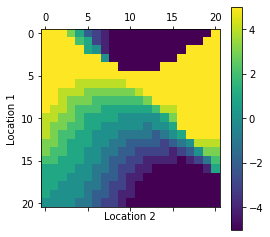
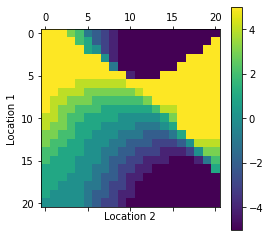
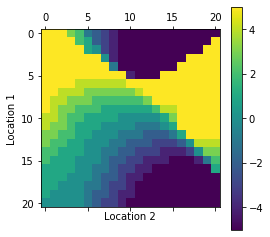
plot_policy(all_P)
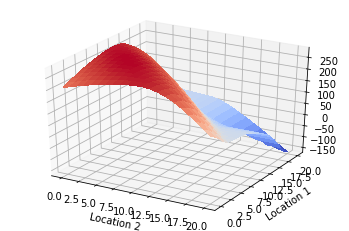
three_dimentional_plot(agent_1.V)
- One of Jack’s employees at the first location rides a bus home each night and lives near the second location. She is happy to shuttle one car to the second location for free.
- Each additional car still costs $2, as do all cars moved in the other direction. In addition, Jack has limited parking space at each location. If more than 10 cars are kept overnight at a location (after any moving of cars), then an additional cost of $4 must be incurred to use a second parking lot (independent of how many cars are kept there).
- These sorts of non-linearities and arbitrary dynamics often occur in real problems and cannot easily be handled by optimization methods other than dynamic programming.
- Solve the problem incorporating the new complications using Policy Iteration.
Jack_env = env.Jack_env()
agent_2 = agent.Jack_PolicyIteration_2(Jack_env)


all_V = []
all_P = []

all_P.append(agent_2.policy.copy())

while True:
    agent_2.evaluate_policy()
    stable = agent_2.update()

    all_V.append(agent_2.V.copy())
    all_P.append(np.flip(agent_2.policy.copy(),0))
    if stable == True:
        break
plot_policy(all_P)
three_dimentional_plot(agent_2.V)