Create graphs from CSVs
scoop bucket add bbkane https://github.com/bbkane/scoop-bucket
scoop install bbkane/tablegraph
- Download Mac/Linux/Windows executable: GitHub releases
- Go:
go install go.bbkane.com/tablegraph@latest - Build with goreleaser after cloning:
goreleaser --snapshot --skip-publish --rm-dist
I don't feel comfortable with Python's packaging ecoystem. I want to brew install <tool> reliably and I don't know how to get that with Python + dependencies.
Options:
- learn how to do Python + dependencies, probably by following Simon Willerson's work on DataSette. This seems to involve a somewhat complicated set of tools, but he's done most of the work. If I do this, I'm worried that the components will change over time and I'll have to keep on top of that. That does get me the
plotlypackage instead of manually writing the JSON. - Use a single Python file and only the stdlib. This is what I do now (and it's honestly not too bad), but I want more complext help than
argparsecan provide. TODO: see how I can do that - Switch to Go. Go has a great packaging system I understand, and I could use my CLI library warg.
Typs + Lints
Python has optional type hints that I use, but because I don't really run MyPy consistently, they function more like docs... that goes for a lot of Python tooling. All the best editors for Python are proprietary (Pylance, PyCharm).
Due to my single file choice, it's getting more difficult to add different types of graphs
Options:
- Python + dependencies
- Switch to Go
Plotly uses fairly complex JSON to build charts. I want to add more types of charts, and I'm not looking forward to learning the right JSON for histograms, etc.
Options:
- Python + dependencies. This gets me the plotly library, which would help, but I'd still have to learn it.
- Switch to Vega, which uses CSV but might not be powerful enough.
Vega/Vega-Lite already use CSV to make graphs
Let's seen if I can recreate what plotly gives me in cashflow... multiline chart, zoom, show nubmer at point, space filling chart, isolate a line
Also want histograms, bar and column charts.
Line chart: Open the Chart in the Vega Editor
Let's see if I can get mouseover number, increase the chart width, isolate a line
https://vega.github.io/vega-lite/docs/size.html#specifying-responsive-width-and-height
Open the Chart in the Vega Editor
There's also the "autosize" param, but I'll play with that later I guess :)
https://vega.github.io/vega-lite/docs/tooltip.html
"mark": {"type": "line", "tooltip": true },
Open the Chart in the Vega Editor
This also shows the line names. It does seem to interact poorly with the zoom... might have to look up autosize again.
Open the Chart in the Vega Editor
https://vega.github.io/vega-lite/examples/interactive_legend.html
https://vega.github.io/vega-lite/examples/interactive_line_hover.html
This makes it so when I click the line I get different opacity:
Open the Chart in the Vega Editor
If I add "bind": "legend", then i can click the legend, but not the line anymore. This is worth it to me. I'd like to be able to select multiple lines like I can with plotly, but that's fine... IT WORKS if I use "shift" click to select multiple legend items.
Open the Chart in the Vega Editor
With title:
Open the Chart in the Vega Editor
Embed plot: https://vega.github.io/vega-lite/usage/embed.html
Embedding works pretty well. I feel confident I can write the code to inline stuff in the chart.
Bar charts: https://vega.github.io/vega-lite/docs/bar.html
grouped bar chart: https://vega.github.io/vega-lite/docs/bar.html#grouped-bar-chart-with-facet
For example, Git (or expenses) over time. Could also be stacked? Or an areachart
What's going on with these dates? Maybe it's representing it as 2020-01-01 00:00:00 and then some rounding error makes it miss something?
Date,Type,Value
2020-01-01,Added,10
2020-01-02,Added,5
2020-01-02,Removed,3
https://vega.github.io/vega-lite/docs/type.html says I should be fine?
Date,Type,Value
2020-01-01 12:32:17,Added,10
2020-01-02 12:32:17,Added,5
2020-01-02 12:32:17,Removed,3
Ok, that worked..., and if I take it back, it doesn't work again. I should open a bug report for this
There is one - see vega/vega-lite#7185 - it looks like it's ingesting the date as UTC, then rendering it as my local timezone, which is 8 hours behind. I've added a comment.
OK, it looks like this can be specified with: https://vega.github.io/vega-lite/docs/timeunit.html#output . I needed to specify both the "timeunit" and the "scale"
TODO: comment on that issue
Let's carry on!
https://vega.github.io/vega-lite/docs/bar.html#grouped-bar-chart-with-offset
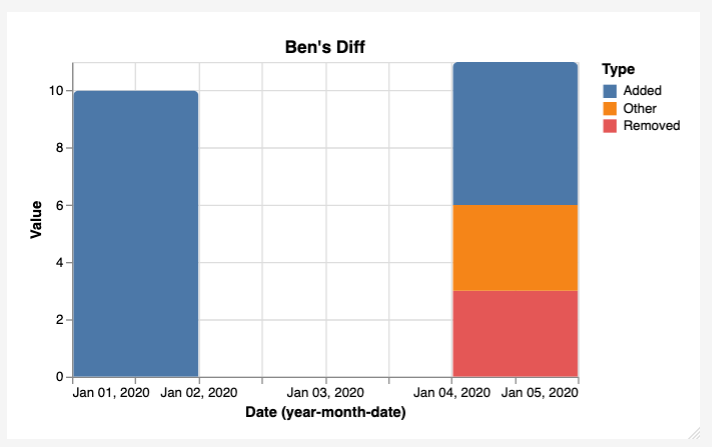
It looks like it's doing stacked, and the lines are too thin
This can be manipulated with https://vega.github.io/vega-lite/docs/timeunit.html , but I do actually want to see the year
Ok, I can't just add the xOffset property with the temporal x type:
{
  "$schema": "https://vega.github.io/schema/vega-lite/v5.json",
  "description": "Ben's Diff",
  "data": {
    "values": [
      {"Date": "2020-01-01", "Type": "Added", "Value": 10},
      {"Date": "2020-01-04", "Type": "Added", "Value": 5},
      {"Date": "2020-01-04", "Type": "Removed", "Value": 3},
      {"Date": "2020-01-04", "Type": "Other", "Value": 3}
    ]
  },
  "mark": {"type": "bar", "tooltip": true, "point": true, "cornerRadiusEnd": 4},
  "height": "container",
  "width": "container",
  "encoding": {
    "x": {
      "field": "Date",
      "type": "temporal",
      "timeUnit": "utcyearmonthdate",
      "scale": {"type": "utc"}
    },
    "y": {"field": "Value", "type": "quantitative"},
    "xOffset": {"field": "Type"}, // does not turn stacked into grouped
    "color": {"field": "Type"},
    "opacity": {"condition": {"param": "hover", "value": 1}, "value": 0.1}
  },
  "title": {"text": "Ben's Diff"},
  "params": [
    {
      "name": "hover",
      "bind": "legend",
      "select": {"type": "point", "fields": ["symbol"]}
    }
  ]
}
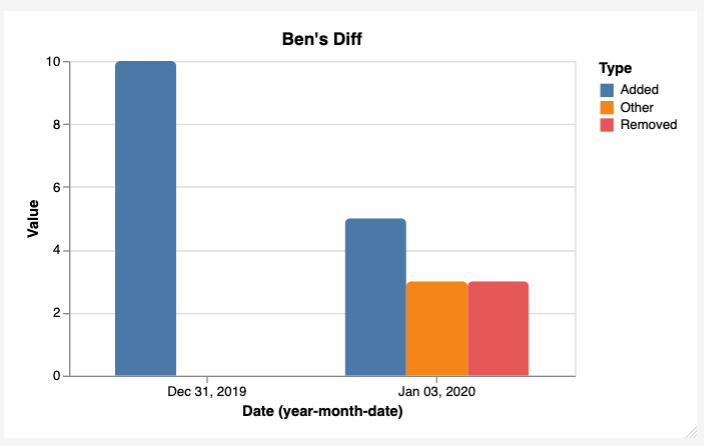
If I switch the x type to moninal, the xOffset works, but the legend doesn't work...
{
  "$schema": "https://vega.github.io/schema/vega-lite/v5.json",
  "description": "Ben's Diff",
  "data": {
    "values": [
      {"Date": "2020-01-01", "Type": "Added", "Value": 10},
      {"Date": "2020-01-04", "Type": "Added", "Value": 5},
      {"Date": "2020-01-04", "Type": "Removed", "Value": 3},
      {"Date": "2020-01-04", "Type": "Other", "Value": 3}
    ]
  },
  "mark": {"type": "bar", "tooltip": true, "point": true, "cornerRadiusEnd": 4},
  "height": "container",
  "width": "container",
  "encoding": {
    "x": {
      "field": "Date",
      "type": "nominal", // changed to nominal
      "timeUnit": "utcyearmonthdate",
      "scale": {"type": "utc"}
    },
    "y": {"field": "Value", "type": "quantitative"},
    "xOffset": {"field": "Type"},
    "color": {"field": "Type"},
    "opacity": {"condition": {"param": "hover", "value": 1}, "value": 0.1}
  },
  "title": {"text": "Ben's Diff"},
  "params": [
    {
      "name": "hover",
      "bind": "legend",
      "select": {"type": "point", "fields": ["symbol"]}
    }
  ]
}
Let's try the facet approach:
{
  "$schema": "https://vega.github.io/schema/vega-lite/v5.json",
  "description": "Ben's Diff",
  "data": {
    "values": [
      {"Date": "2020-01-01", "Type": "Added", "Value": 10},
      {"Date": "2020-01-04", "Type": "Added", "Value": 5},
      {"Date": "2020-01-04", "Type": "Removed", "Value": 3},
      {"Date": "2020-01-04", "Type": "Other", "Value": 3}
    ]
  },
  "mark": {"type": "bar", "tooltip": true, "point": true, "cornerRadiusEnd": 4},
  "height": "container",
  "width": "container",
  "encoding": {
    "column": {
      "field": "Type",
      "header": {"orient": "bottom"}
    },
    "x": {
      "axis": null,
      "field": "Date",
      "type": "quantitative",
      "timeUnit": "utcyearmonthdate",
      "scale": {"type": "utc"}
    },
    "y": {"field": "Value", "type": "quantitative"},
    "color": {"field": "Type"},
    "opacity": {"condition": {"param": "hover", "value": 1}, "value": 0.1}
  },
  "config": {
    "view": {
      "stroke": "transparent"
    }
  },
  "title": {"text": "Ben's Diff"},
  "params": [
    {
      "name": "hover",
      "bind": "legend",
      "select": {"type": "point", "fields": ["symbol"]}
    }
  ]
}
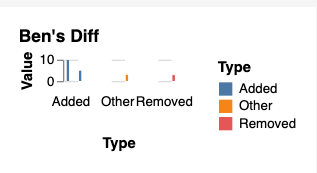
That REALLY didn't work...
TODO: ask on Slack once vega/vega-lite#8171 is resolved, or open an issue in a few days.
$ cat tmp.csv | go run . graph --fieldnames firstline > ./vega-lite/07_line_from_tablegraph/data.json
This seems to work. Let's refactor some and parameterize it
Add the time stuff
$ cat tmp.csv | go run . graph --fieldnames firstline --type line --y-type quantitative --x-type temporal --x-time-unit utcyear > ./vega-lite/07_line_from_tablegraph/data.json


