setigen is a Python library for generating and injecting artificial narrow-band signals into radio frequency data, by way of data formats used extensively by the Breakthrough Listen (BL) team @ Berkeley.
The main module of setigen is based on creating synthetic spectrogram (dynamic spectra) data, showing intensity as a function of time and frequency. Observational data saved in filterbank files can be loaded into setigen, and synthetic signals can be easily injected on top and saved out to file. setigen works well with file handling via BL's blimpy package.
The setigen.voltage module enables the synthesis of GUPPI RAW files via synthetic real voltage “observations” and a software signal processing pipeline that implements a polyphase filterbank, mirroring actual BL hardware. The voltage module supports single and multi-antenna RAW files, and can be GPU accelerated via CuPy.
You can use pip to install the package automatically:
pip install setigen
Alternately, you can clone the repository and install it directly. At the command line, execute:
git clone git@github.com:bbrzycki/setigen.git
python setup.py install
The setigen.voltage module specifically can be GPU accelerated, via CuPy (https://docs.cupy.dev/en/stable/install.html). CuPy is not strictly required to use the voltage module, but it reduces compute time significantly. If CuPy is installed, enable setigen GPU usage either by setting the SETIGEN_ENABLE_GPU environmental variable to 1 or doing so in Python:
import os
os.environ['SETIGEN_ENABLE_GPU'] = '1'
os.environ['CUDA_VISIBLE_DEVICES'] = '0'
While it isn’t used directly by setigen, you may also find it helpful to install cusignal for access to CUDA-enabled versions of scipy functions when writing custom voltage signal source functions.
Injecting an artificial signal is as simple as adding it to the data. To fully describe an artificial signal, we need the following:
- Start and stop times (in most cases, this would probably be the beginning and end of the observation, assuming the signal is "on" continuously)
- Frequency center of signal as a function of time sample
- Intensity modulation of signal as a function of time sample
- Frequency structure within each time sample
- Overall intensity modulation as a function of frequency (bandpass)
setigen provides sample functions and shapes for each of these parameters. These all contribute to the final structure of the signal - the goal is to empower the user to generate artificial signals that are as simple or complex as one would like.
Here's an example of synthetic signal generation, using astropy.units to express frame parameters:
from astropy import units as u
import setigen as stg
import matplotlib.pyplot as plt

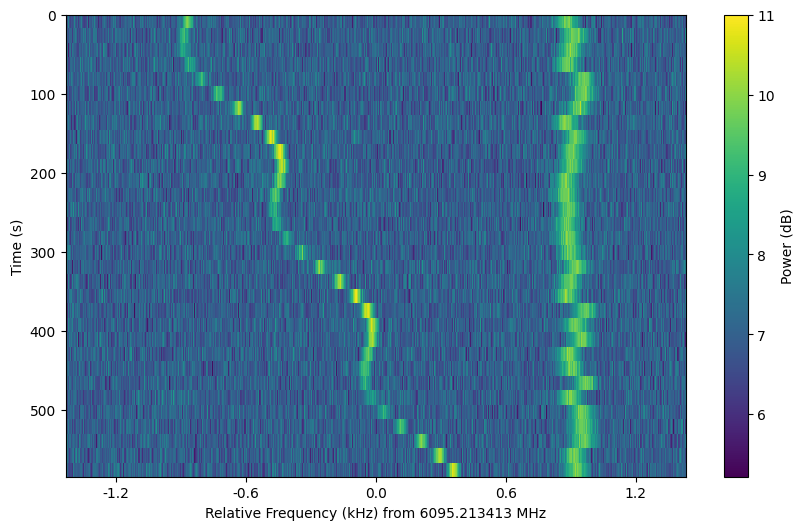
frame = stg.Frame(fchans=1024,
                  tchans=32,
                  df=2.7939677238464355*u.Hz,
                  dt=18.253611008*u.s,
                  fch1=6095.214842353016*u.MHz)
noise = frame.add_noise(x_mean=10, noise_type='chi2')
signal = frame.add_signal(stg.constant_path(f_start=frame.get_frequency(index=200),
                                            drift_rate=2*u.Hz/u.s),
                          stg.constant_t_profile(level=frame.get_intensity(snr=30)),
                          stg.gaussian_f_profile(width=40*u.Hz),
                          stg.constant_bp_profile(level=1))

fig = plt.figure(figsize=(10, 6))
frame.plot()
plt.savefig('example.png', bbox_inches='tight')
plt.show()
This first adds chi-squared noise to the frame, and adds a constant intensity signal at 30 SNR (relative to the background noise). The result is:
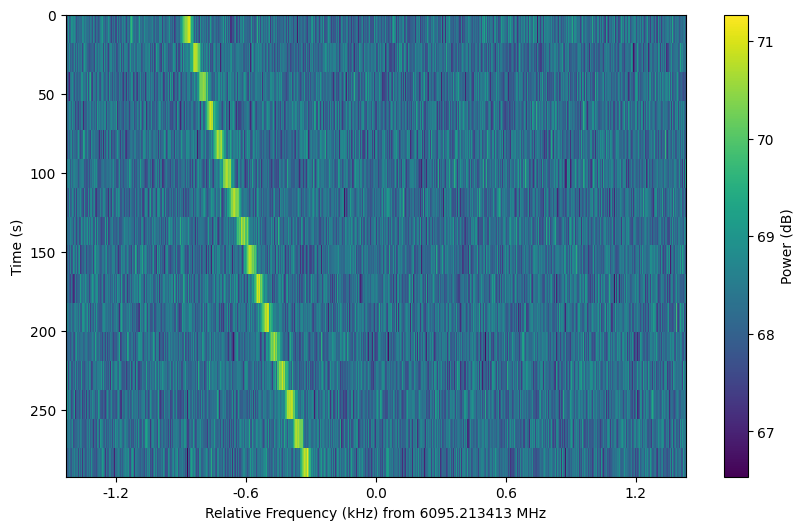
Another example, using values found in real observations and visualized in the style of blimpy:
from astropy import units as u
import setigen as stg
import matplotlib.pyplot as plt

frame = stg.Frame(fchans=1024,
                  tchans=16,
                  df=2.7939677238464355*u.Hz,
                  dt=18.253611008*u.s,
                  fch1=6095.214842353016*u.MHz)
noise = frame.add_noise_from_obs()
signal = frame.add_signal(stg.constant_path(f_start=frame.get_frequency(index=200),
                                            drift_rate=2*u.Hz/u.s),
                          stg.constant_t_profile(level=frame.get_intensity(snr=30)),
                          stg.gaussian_f_profile(width=40*u.Hz),
                          stg.constant_bp_profile(level=1))

fig = plt.figure(figsize=(10, 6))
frame.plot()
plt.show()
We can arrange a collection of frames as a setigen.Cadence object. This
allows one to add noise and signals to multiple frames conveniently and to
create publication-ready plots of observational cadences.
Cadence objects support list operations such as slicing and appending. This can be used to manage injection and analysis steps.
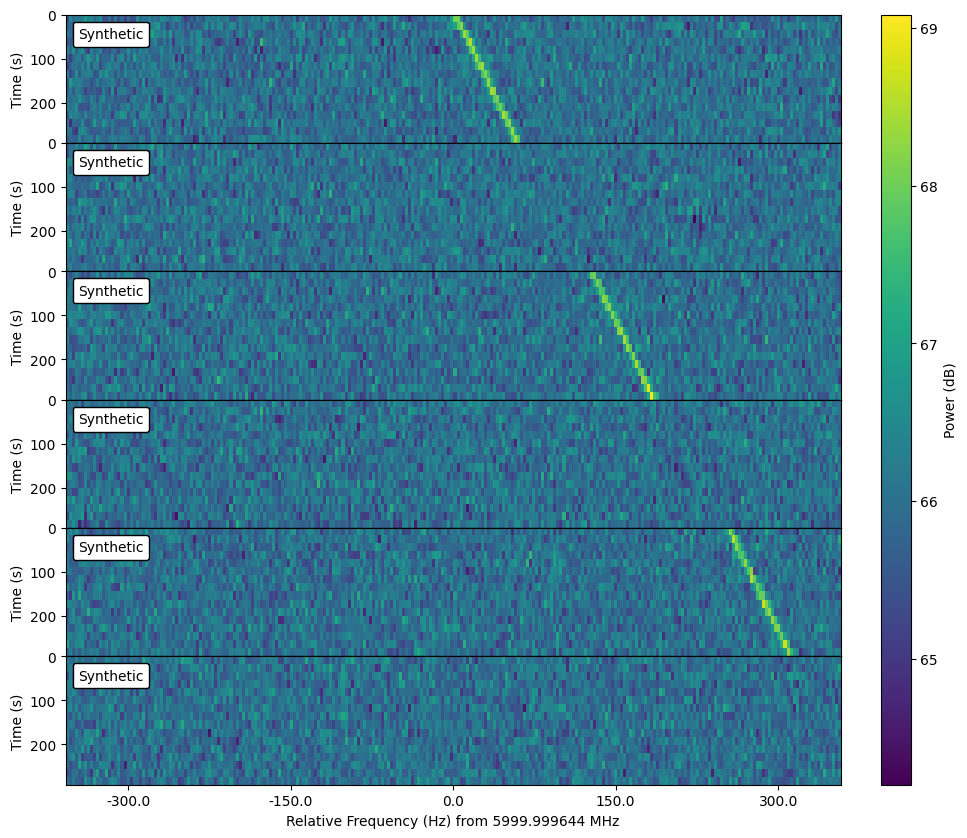
As a simple example with fully synthetic frames:
mjd_start = 56789
obs_length = 300
slew_time = 15

t_start_arr = [Time(mjd_start, format='mjd').unix]
for i in range(1, 6):
    t_start_arr.append(t_start_arr[i - 1] + obs_length + slew_time)
frame_list = [stg.Frame(tchans=16, fchans=256, t_start=t_start_arr[i])
              for i in range(6)]

c = stg.Cadence(frame_list=frame_list)
c.apply(lambda fr: fr.add_noise(4e6))
c[0::2].add_signal(stg.constant_path(f_start=c[0].get_frequency(index=128),
                                     drift_rate=0.2*u.Hz/u.s),
                   stg.constant_t_profile(level=c[0].get_intensity(snr=30)),
                   stg.sinc2_f_profile(width=2*c[0].df*u.Hz),
                   stg.constant_bp_profile(level=1),
                   doppler_smearing=True)

fig = plt.figure(figsize=(10, 10))
c.plot()
plt.show()
Note that cadence objects don't have an imposed order -- they serve as a bare-bones
organizational structure for frames. If you would like to impose an order,
use the OrderedCadence:
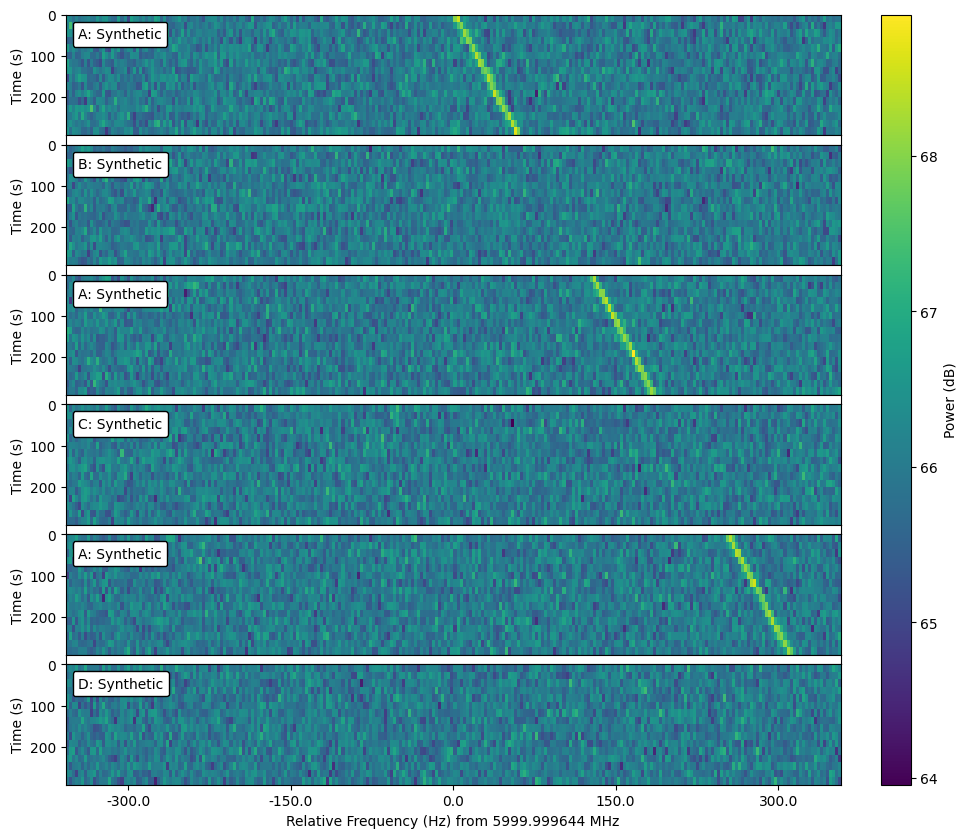
c = stg.OrderedCadence(frame_list,
                       order="ABACAD")
Ordered cadences additionally allow you to slice cadences by order label:
c.by_label("A")
If cadence frames are in chronological order, when plotting, you may spread subplots in the vertical direction proportionally to slew time with:
c.plot(slew_times=True)
The setigen.voltage module extends setigen to the voltage regime. Instead of directly synthesizing spectrogram data, we can produce real voltages, pass them through a software pipeline based on a polyphase filterbank, and record to file in GUPPI RAW format. In turn, this data can then be reduced as usual using rawspec. As this process models actual hardware used by Breakthrough Listen for recording raw voltages, this enables lower level testing and experimentation. The basic layout of a setigen.voltage pipeline is shown above.
A simple example implementation may be written as follows. For more information, check out the docs.
from astropy import units as u
import setigen as stg

antenna = stg.voltage.Antenna(sample_rate=3e9*u.Hz,
                              fch1=6000e6*u.Hz,
                              ascending=True,
                              num_pols=1)

antenna.x.add_noise(v_mean=0,
                    v_std=1)

antenna.x.add_constant_signal(f_start=6002.2e6*u.Hz,
                              drift_rate=-2*u.Hz/u.s,
                              level=0.002)

digitizer = stg.voltage.RealQuantizer(target_fwhm=32,
                                      num_bits=8)

filterbank = stg.voltage.PolyphaseFilterbank(num_taps=8,
                                             num_branches=1024)

requantizer = stg.voltage.ComplexQuantizer(target_fwhm=32,
                                           num_bits=8)

rvb = stg.voltage.RawVoltageBackend(antenna,
                                    digitizer=digitizer,
                                    filterbank=filterbank,
                                    requantizer=requantizer,
                                    start_chan=0,
                                    num_chans=64,
                                    block_size=134217728,
                                    blocks_per_file=128,
                                    num_subblocks=32)

rvb.record(output_file_stem='example_1block',
           num_blocks=1,
           length_mode='num_blocks',
           header_dict={'HELLO': 'test_value',
                        'TELESCOP': 'GBT'},
           verbose=True)
A set of tutorial walkthroughs can be found at: https://github.com/bbrzycki/setigen/tree/main/jupyter-notebooks/voltage.
One unique application of the setigen.voltage pipeline is to ingest IQ data collected from an RTL-SDR dongle and create GUPPI RAW files accordingly: https://github.com/bbrzycki/rtlsdr-to-setigen.


