The diffraction library is a collection of MATLAB scripts used for the modeling of various diffraction geometries for diffraction of x-rays or electrons from crystals. The library was developed with the Ultrafast Science community in mind, with an emphasis on ease of customization and use. This Quick Intro is targeted towards experienced MATLAB users who wish to quickly learn the key functionalities of the library. It is not intended as an expansive documentation of the library. Further information and examples may be found in the help feature of the respective scripts. The examples below use graphite as the template crystal to showcase the capabilities of the library.
The library currently offers several diffraction scripts corresponding to various diffraction geometries. The minimum information neccessary to run a diffraction script is a properly defined lattice structure and a probe beam (x-rays or electrons). A lattice is constructed by defining the molecular symbol, the lattice system type, the corresponding lattice constants (dimensions in Ångströms and angles in degrees), and the positions of atoms in the lattice (in the reference frame of the lattice system coordinate). The following example shows how to define graphite:
>> Lattice.Symbol = 'C';
>> Lattice.Type = 'hexagonal';
>> Lattice.a = 2.4560;
>> Lattice.c = 6.6960;
>> Lattice.AtomicPositions = [0 0 0 ; 0 0 1/2 ; 1/3 2/3 0 ; 2/3 1/3 1/2];
Once defined, the user can save the lattice structure as a MATLAB file so as not to have to redefine it again in the future. This is done by using the save commad in MATLAB:
>> save('graphite_hexagonal.mat', 'Lattice'); All other lattice properties, if not defined in the structure file, are automatically calculated by the library (e.g. lattice volume, density, etc.).
The probe is the incident beam. It may currently be defined as either 'xrays' or 'electrons', along with its Energy (in eV). For non-coplanar diffraction, there are additional parameters on the geometry of the incident beam (to be described later). For powder diffraction, only two parameters are required as shown in this example:
>> Probe.Type = 'xrays';
>> Probe.Energy = 8048.3;With 'Lattice' and 'Probe' defined, one can now run the powder diffraction simulation with the above inputs via the MATLAB command-line:
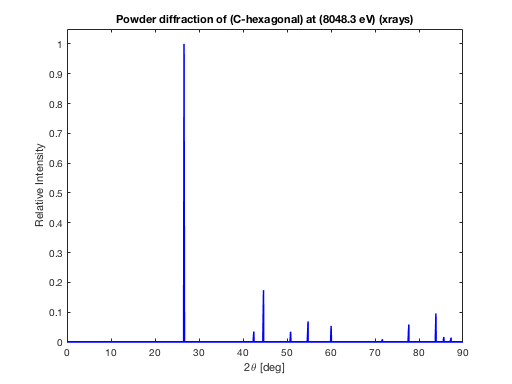
>> I = GenerateIntensity2theta(Lattice, Probe);GenerateIntensity2theta outputs two figures: The first, shown above, is an Intensity vs. 2theta plot for the given lattice structure and probe beam. The second (not shown) is a scatter plot in which the multiplicity term was not factored into the Intensity calculation as to highlight the individual contributions of a single plane in contrast to the summation of intensities across a family of planes.
In addition to these figures, the main output is a table that contains useful diffraction information such as the diffracted peak intensities, the diffraction angles, the scattering vectors, and the d-spacings. The table below shows information on the diffraction peaks of graphite up to hkl range of 2 (the hkl range is an optional parameter to the GenerateIntensity2theta function).
>> I

    h    k     l    BraggAngle    TwoTheta    Intensity    RelativeIntensity       d         Q          S       m
    0     0    2    13.301        26.602       21066           100                3.348    1.8767    0.29869     2
    1     0    0    21.232        42.463      744.99        3.5364                2.127    2.9541    0.47015     6
    1     0    1    22.332        44.663        3667        17.407               2.0271    3.0995     0.4933    12
    1     0    2    25.406        50.813      731.86        3.4741               1.7953    3.4998    0.55701    12
    0     0    4    27.395         54.79      1445.3        6.8607                1.674    3.7534    0.59737     2
    1     0    3    30.015        60.031      1136.3        5.3941               1.5398    4.0806    0.64944    12
    1     0    4    35.841        71.683      198.67       0.94305               1.3154    4.7765     0.7602    12
    2    -1    0    38.847        77.694      1235.3        5.8638                1.228    5.1166    0.81433     6
    2    -1    2    41.921        83.841      2019.4        9.5858               1.1529    5.4499    0.86738    12
    1     0    5    42.818        85.636      360.76        1.7125               1.1333    5.5443     0.8824    12
    0     0    6    43.645         87.29      307.96        1.4619                1.116    5.6301    0.89606     2
    2     0    0    46.409        92.817      51.876       0.24625               1.0635    5.9081    0.94031     6
    2     0    1    47.168        94.336      304.44        1.4452               1.0503    5.9822     0.9521    12
    2     0    2    49.459        98.917      96.653       0.45881               1.0136     6.199    0.98661    12
    2    -1    4     51.07        102.14      1517.4        7.2032              0.99015    6.3457     1.0099    12
    1     0    6    51.208        102.42       94.74       0.44972              0.98823     6.358     1.0119    12
    2     0    3    53.349         106.7      282.56        1.3413              0.96007    6.5445     1.0416    12
    2     0    4    59.101         118.2      101.09       0.47987              0.89765    6.9996      1.114    12
    2     0    5    67.648         135.3       403.6        1.9159              0.83282    7.5444     1.2007    12
    2    -1    6    68.848         137.7      2274.8        10.798              0.82589    7.6077     1.2108    12
    3    -1    0     73.36        146.72      181.71       0.86255              0.80391    7.8157     1.2439    12
    3    -1    1    74.798         149.6      1196.5        5.6796              0.79818    7.8719     1.2528    24
    3    -1    2    80.184        160.37      624.09        2.9625               0.7817    8.0379     1.2793    24
In addition, the table above may be saved as a .txt, .xlsx, .xls, .dat, or .csv depending on the end user's preference.
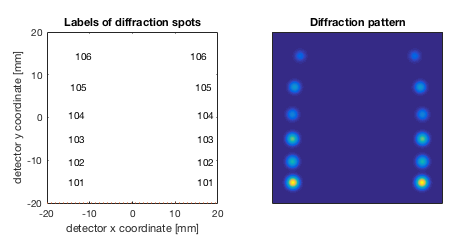
This script is useful for simulating the diffraction pattern for 2D layered structures with preferred orientation. The template example is Highly oriented pyrolytic graphite (HOPG), in which the sample surface corresponds to the [001] direction, but in-plane, domains are randomly oriented. The example below is a simulation of the geometrical diffraction pattern under grazing incidence off an HOPG crystal. Here, one sees both the brightness and positions of the possible diffraction spots over a range of miller indices for a given detector geometry. The additional inputs consist of defining the surface normal of the crystal, specifying that the probe is incident in a noncoplanar geometry at some incidence angle, psi, in degrees relative to the surface, and, finally, specifying the detector shape and dimensions (in mm):
>> load('graphite_hexagonal.mat');
>> Lattice.Normal = [0 0 1];

>> Probe.Type = 'xrays';
>> Probe.Energy = 20000;
>> Probe.DiffractionGeometry = 'noncoplanar';
>> Probe.psi = 0.1;

>> Detector.Shape = 'square';
>> Detector.Size = 40;
>> Detector.SpotFWHMx = 2;
>> Detector.SpotFWHMy = 2;
>> Detector.DistanceToSample = 50;
>> Detector.Offset = [0 20];
Next, the function generating the simulated diffraction pattern is called:
>> I = GeometricalSimulation1(Lattice, Probe, Detector, 0:6, 1);The output, I, is a 2D image corresponding to the diffraction pattern on the detector. This is shown below for the above example.
In addition to the simulated diffraction pattern, the noncoplanar script outputs a table listing useful diffraction information on the noncoplanar geometry. This information includes the incident and reflected angles both azimuthally and relative to the sample surface. An example of calling this function is shown below (because of the limited space, only a snippet of the table for miller indices range up to 6 is included).
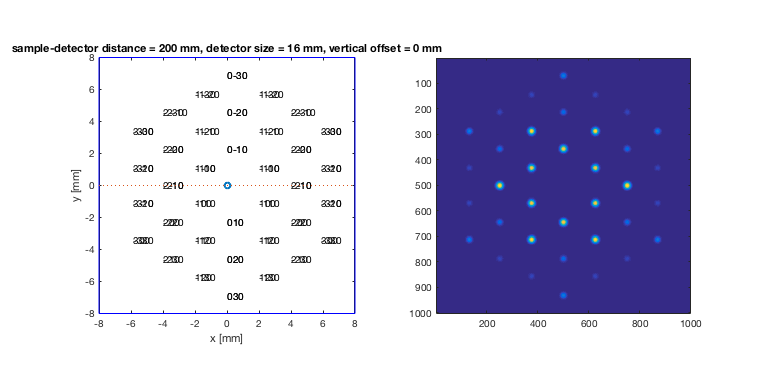
This script is used for simulating geometrical pattern for electron diffraction in a transmission geometry as shown below. The syntax is very similar to the noncoplanar geometry.
>> load('graphite_hexagonal.mat');
>> Lattice.Normal = [0 0 1];

>> Probe.Type = 'electrons';
>> Probe.Energy = 60000;

>> Detector.Shape = 'square';
>> Detector.Size = 16;
>> Detector.SpotFWHMx = 0.3;
>> Detector.SpotFWHMy = 0.3;
>> Detector.DistanceToSample = 200;
>> Detector.Offset = [0 0];
Next, the function generating the simulated diffraction pattern is called:
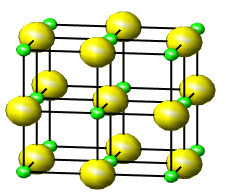
>> I = GeometricalSimulation2(Lattice,Probe,Detector, 0:6,1);As a diagnostic tool, one may also generate a 3D rendering of a lattice structure such as the one shown below for sodium cloride:
>> Lattice.Symbol = 'NaCl';
>> Lattice.Type = 'cubic';
>> Lattice.a = 5.6402;
>> Lattice.AtomicTypes = [1,1,1,1,2,2,2,2]
>> AtomicPositions = [ 0 0 0 ; 1/2 1/2 0 ; 1/2 0 1/2 ; 0 1/2 1/2 ; 1/2 1/2 1/2 ; 0 0 1/2 ; 0 1/2 0 ; 1/2 0 0 ]

>> VisualizeCrystal(Lattice)


