This repository is intended to help Azure users to gather information from Azure Compute and trigger an action against the VM. We are going to implement an agent written in python, which will send telemetric data to InfluxDB. From influxdb, Grafana will be leaveraged as visualization tool. Grafana will monitor basic components like cpu, memory, disk iops and network, and also can monitor special components like Nvidia GPU. Grafana also provide sophisticated alerting mechanism, where the message could be propagated to diverse messaging systems. For this demonstation, the message will be delivered to an Azure runbook with webhook, which will stop the Azure compute when GPU is idle.
There are several options to deploy influxDB and I have chosen this docker image since it has admin UI and InfluxDB altogether. Note that local drive is mounted for backup and data transfer.
$ docker pull tutum/influxdb
$ docker run -d -p 8083:8083 -p 8086:8086 -v influxdb:/var/lib/influxdb tutum/influxdb:latest
Following are description on ports.
- 8086 : HTTP API port
- 8083 : WEB ADMIN UI port
Installing pip3, ifstat and sysstat as dependencies on the system where we're going to pull metrics. Note that InfluxDB has no authentication setup to receive monitoring data.
sudo apt install -y python3-pip ifstat sysstat
pip3 install influxdb
With the dependencies installed, run following command to test monitoring agent. This should display all monitored components in json format every 5 seconds. Please run python3 machine.py --help to find out the parameters for setting up credentials on connections, how to relax monitoring interval, and how to disable console logging.
python3 machine.pyTo run agent in the background, execute with following command.
nohup python3 machine.py --ip IP_ADDRESS_OF_INFLUXDB & To verify that the process is up and running with parent PID is not your session PID,
ps -ef | grep -i python
tail -f nohup.out
to see console output in real time.
-
Create an Automation account in your subscription.
-
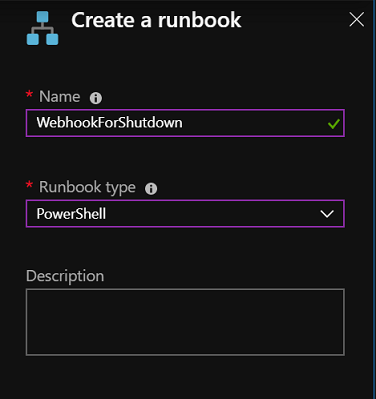
Create a PowerShell Runbook.
-
Edit, paste from workbook.ps1, save and publish.
-
Create a webhook. Give a name and please take a note of the url generated. No need to specify anything for the parameters and just click OK and create.
Visit Grafana website for more information.
$ docker pull grafana/grafana
$ docker run -d -p 3000:3000 --name=grafana grafana/grafana
Following are description on ports.
- 3000 : Grafana port
The initial username and password is admin/admin. Once logged in follow the guidline to create a dashboard. To configure InfluxDB as data source, uncheck everything for AUTH and put machine_information as Databasename. Once you have the data source configured, it would be very intuitive to create generic panels in dashboard, which will be omitted in this article. We are going to up jump right into how to setup alerting.
First we need to configure a notification channel in Alerting.
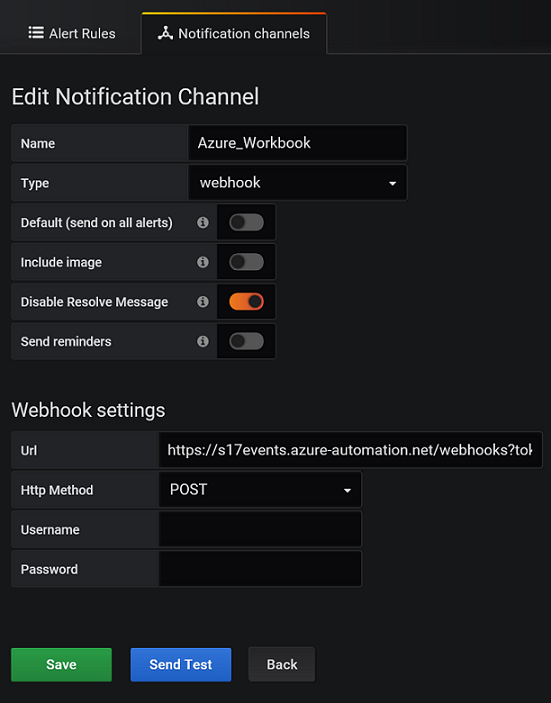
Note that "Include image" is unchecked and "Disable Resolve Message" is also unchecked. For webhook URL, no credential is provided but user-agent header and contents of POST have to match in order to trigger the Stop command against the virtual machine.
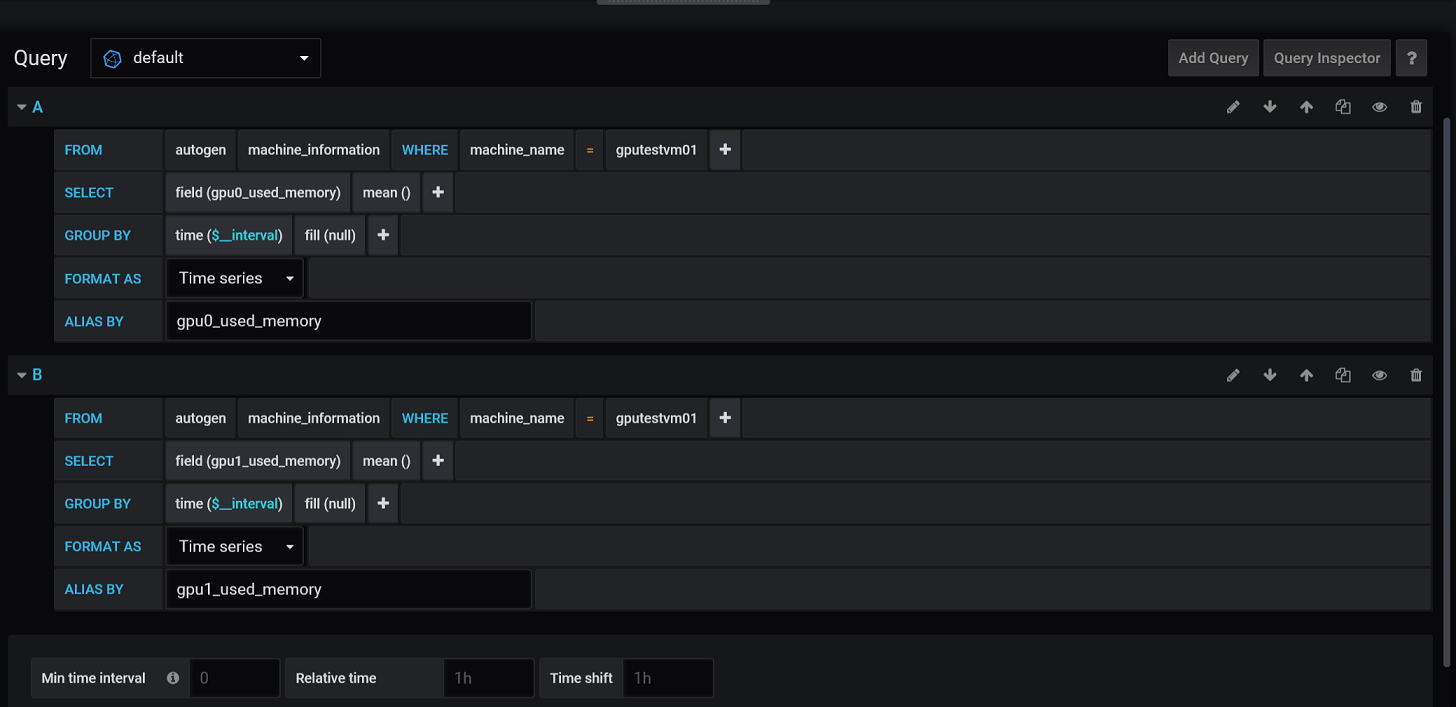
Now that we have notification channel established, we can setup an alert on GPU monitoring panel. The sample query is taken from a machine with 2 GPUs installed. Note that you have to monitor for each GPU installed and we are going to monitor GPU memory consumption rather than GPU utilization.
Here's the screenshot of actual alert. s
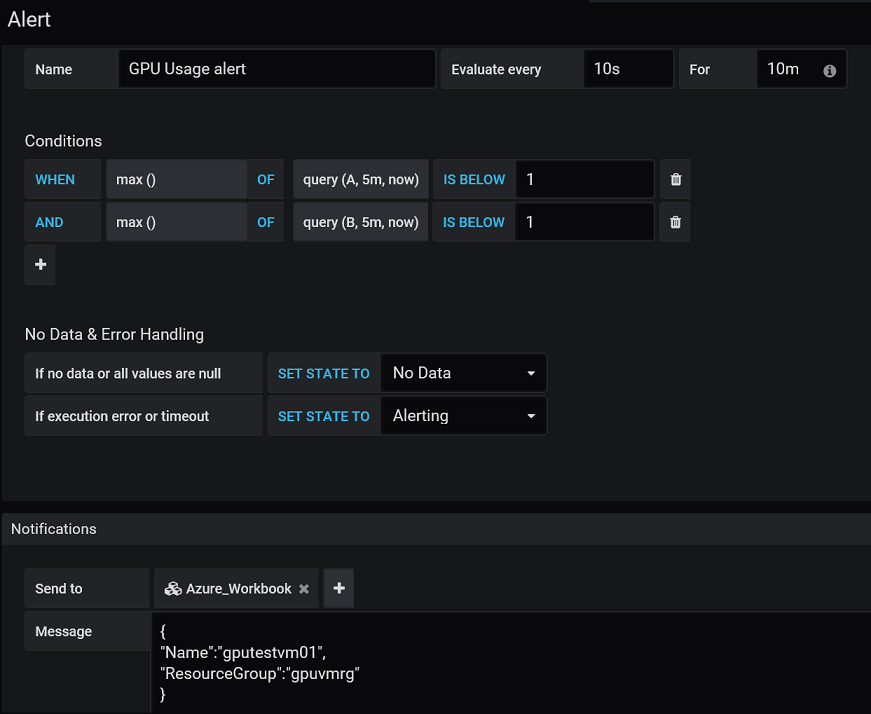
On the contents of the POST body, name and resource group must be specified in json format. During my investigation, variables in alert wasn't supported from Grafana at the time of writing this article.
{
"Name":"gputestvm01",
"ResourceGroup":"gpuvmrg"
}
Sample dashboard could be found here.
- Backup Please specify the database name in backup command.
$ influxd backup -database machine_information 20190621_machine_information- Restore Please specify the database anme and place to restore the files.
$ influxd restore -database machine_information -datadir ./data 20190621_machine_information