This repository contains performance tests to be executed by TestKube. Publishing test results to Prometheus and visualizing them in Grafana is supported.
MacOS
brew install k6check version
k6 versionCheck the releases page for different versions of k6.
Run K6 scripts to publish metrics to Prometheus
K6_PROMETHEUS_RW_SERVER_URL=http://localhost:9090/api/v1/write \
K6_PROMETHEUS_RW_TREND_AS_NATIVE_HISTOGRAM=true \
K6_PROMETHEUS_RW_INSECURE_SKIP_TLS_VERIFY=true \
K6_PROMETHEUS_RW_STALE_MARKERS=true \
k6 run \
-o experimental-prometheus-rw \
--log-output=loki=http://localhost:3100/loki/api/v1/push,label.loadtest=k6,limit=1000,pushPeriod=1m,msgMaxSize=1231,level=trace \
tests/script.js
# Prometheus URL to write metrics from K6 to Prometheus
K6_PROMETHEUS_RW_SERVER_URLmore details here how to write metrics from K6 to Prometheus
more details here how to write logs from K6 to Loki
Run K6 browser based scripts to publish metrics to Prometheus
K6_PROMETHEUS_RW_SERVER_URL=http://localhost:9090/api/v1/write \
K6_PROMETHEUS_RW_TREND_AS_NATIVE_HISTOGRAM=true \
K6_PROMETHEUS_RW_INSECURE_SKIP_TLS_VERIFY=true \
K6_PROMETHEUS_RW_STALE_MARKERS=true \
K6_BROWSER_HEADLESS=false
k6 run \
-o experimental-prometheus-rw \
tests/browser-test.js
K6 browser tests documentation
https://github.com/grafana/xk6-browser
Before you begin, ensure you have the following installed:
- Docker
- Docker Compose
You can download Docker here and it includes Docker Compose in most installation packages.
docker-compose up -dThis will pull the required Docker images, create volumes, and start the Prometheus and Grafana containers.
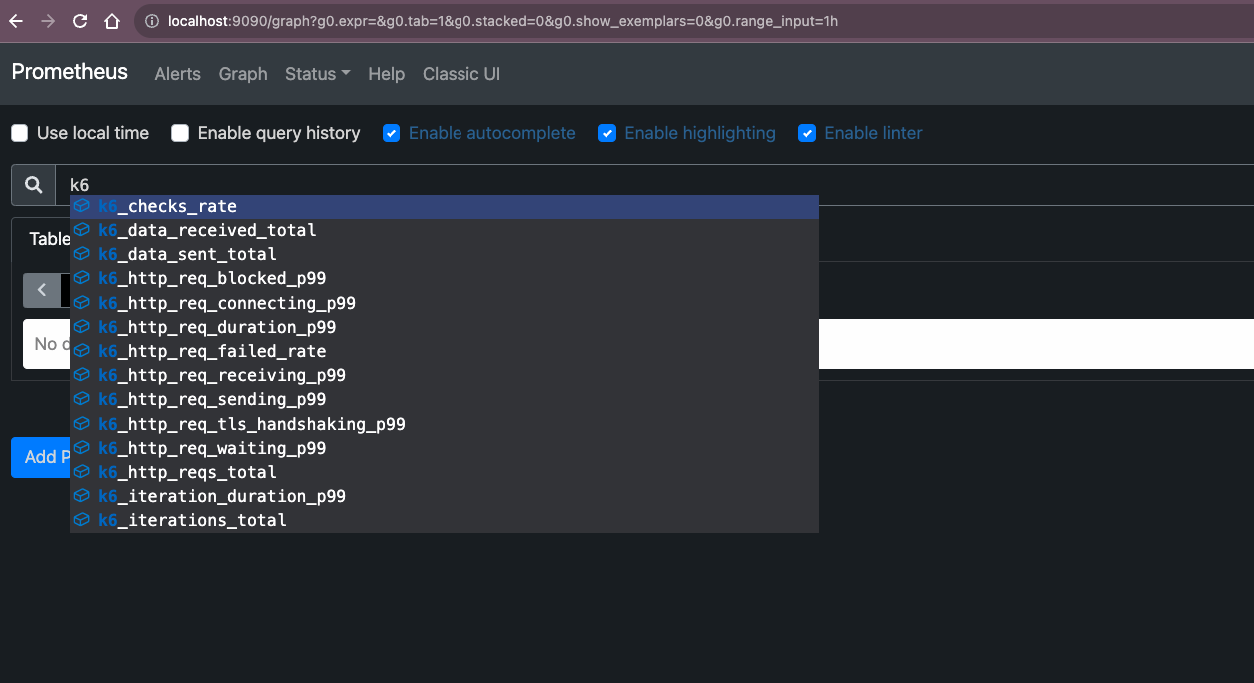
Once the services are up and running, you can access the Prometheus web UI by opening your browser and going to:
http://localhost:9090/metrics
Here you can execute queries to explore your metrics and see the health of your monitoring system.
- Visualize your results to analyze performance during the test run or over multiple test runs.
- Correlate test results with application and system metrics in the same dashboard to get a holistic overview of your system's performance and quickly find the root causes of performance issues.
Grafana will be available by navigating to the following URL in your browser:
http://localhost:3000
By default, the login credentials are set to admin for the username and admin for the password. It's strongly recommended to change these credentials upon first login.


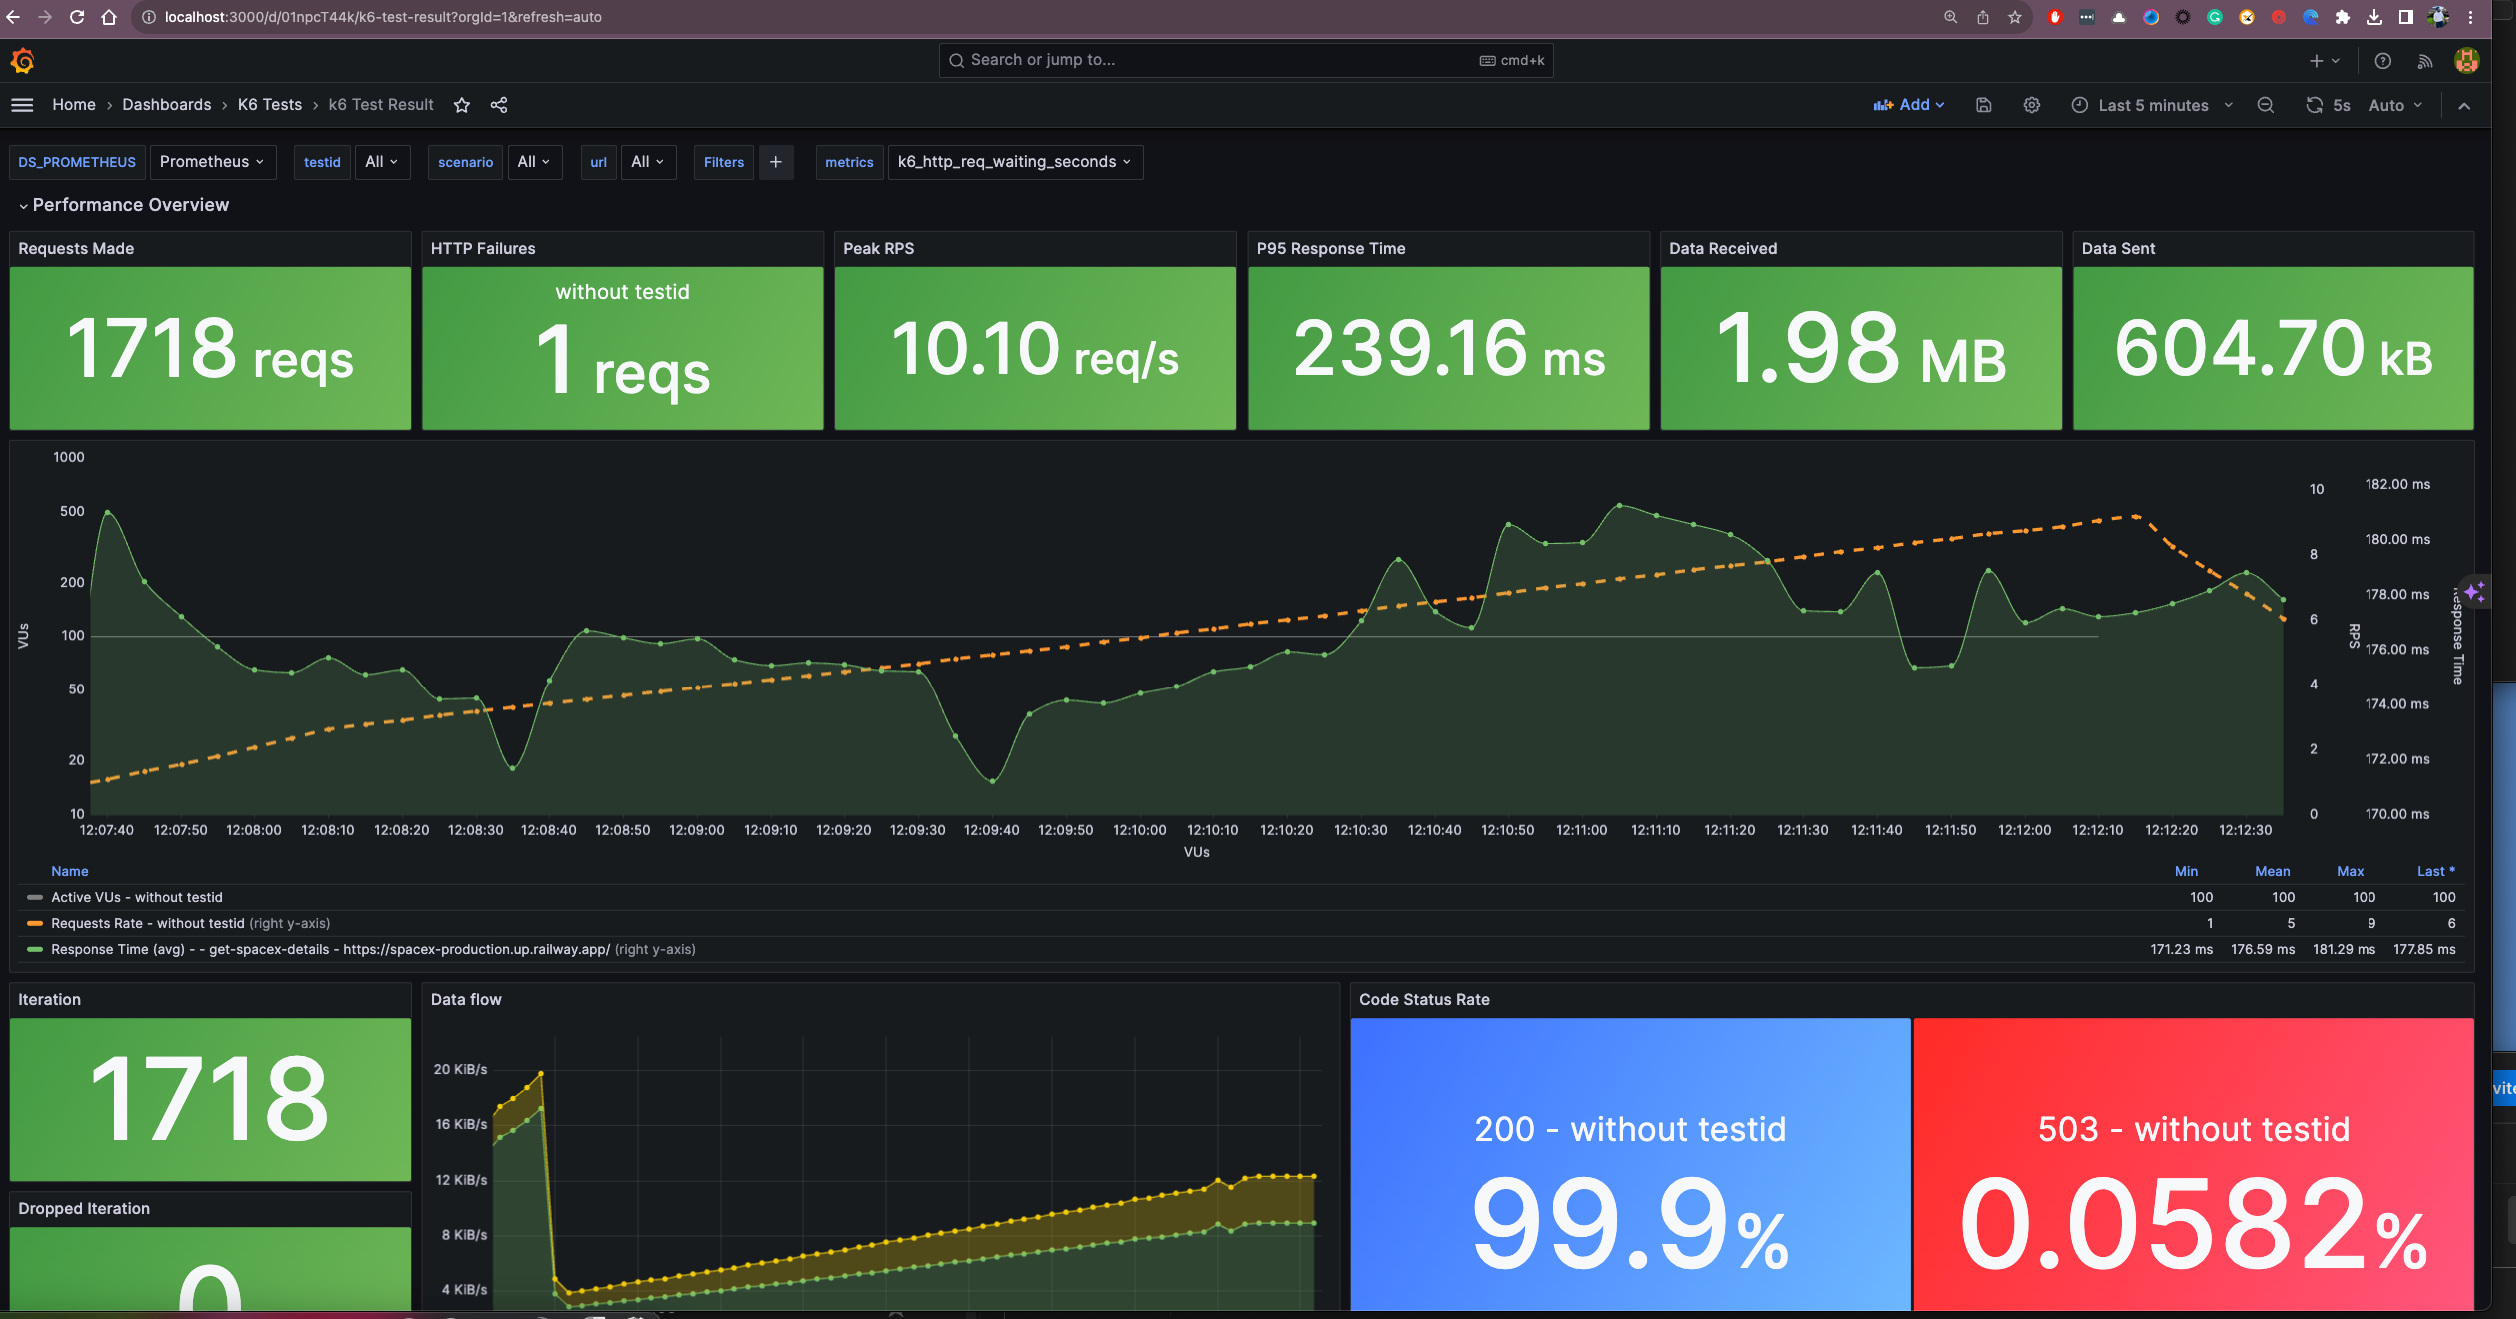
By default, k6 dashboard is available in Grafana. You can access it by navigating to the Grafana dashboard
Available dashboard resources:
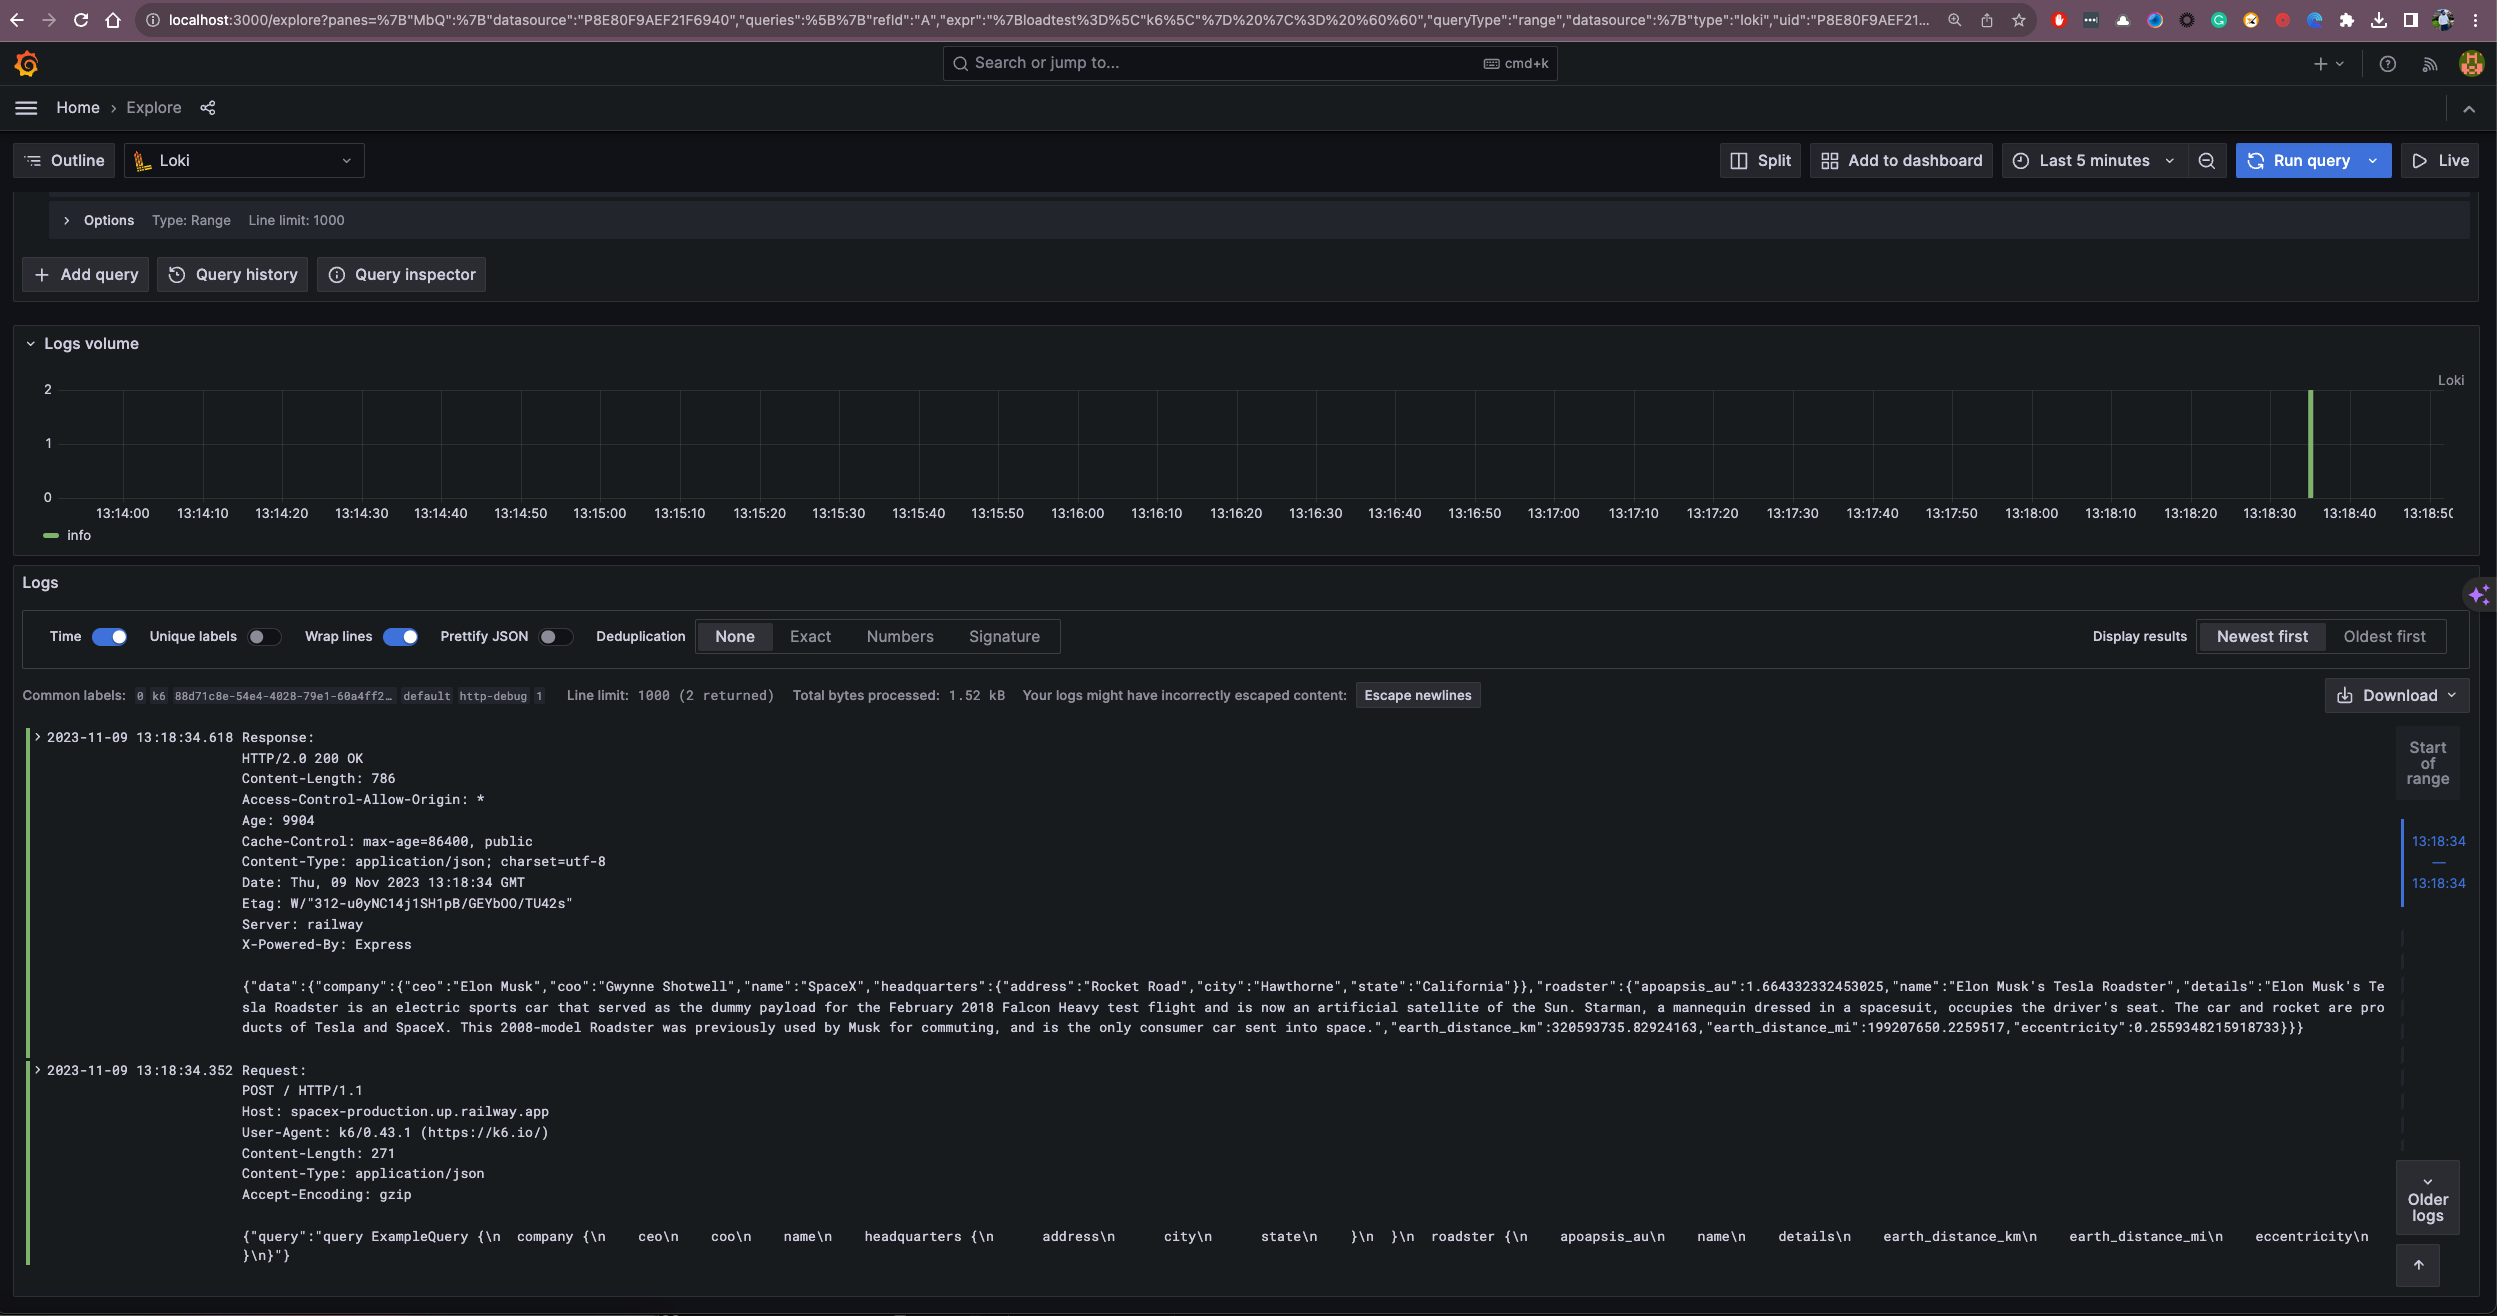
Loki will be available by navigating to the Grafana under explorer section.
To stop the services, run the following command:
docker-compose downdocker kill $(docker ps -q)If you want to remove the volumes along with the containers, use:
docker-compose down -vNote: This will delete your data in Prometheus and Grafana.

