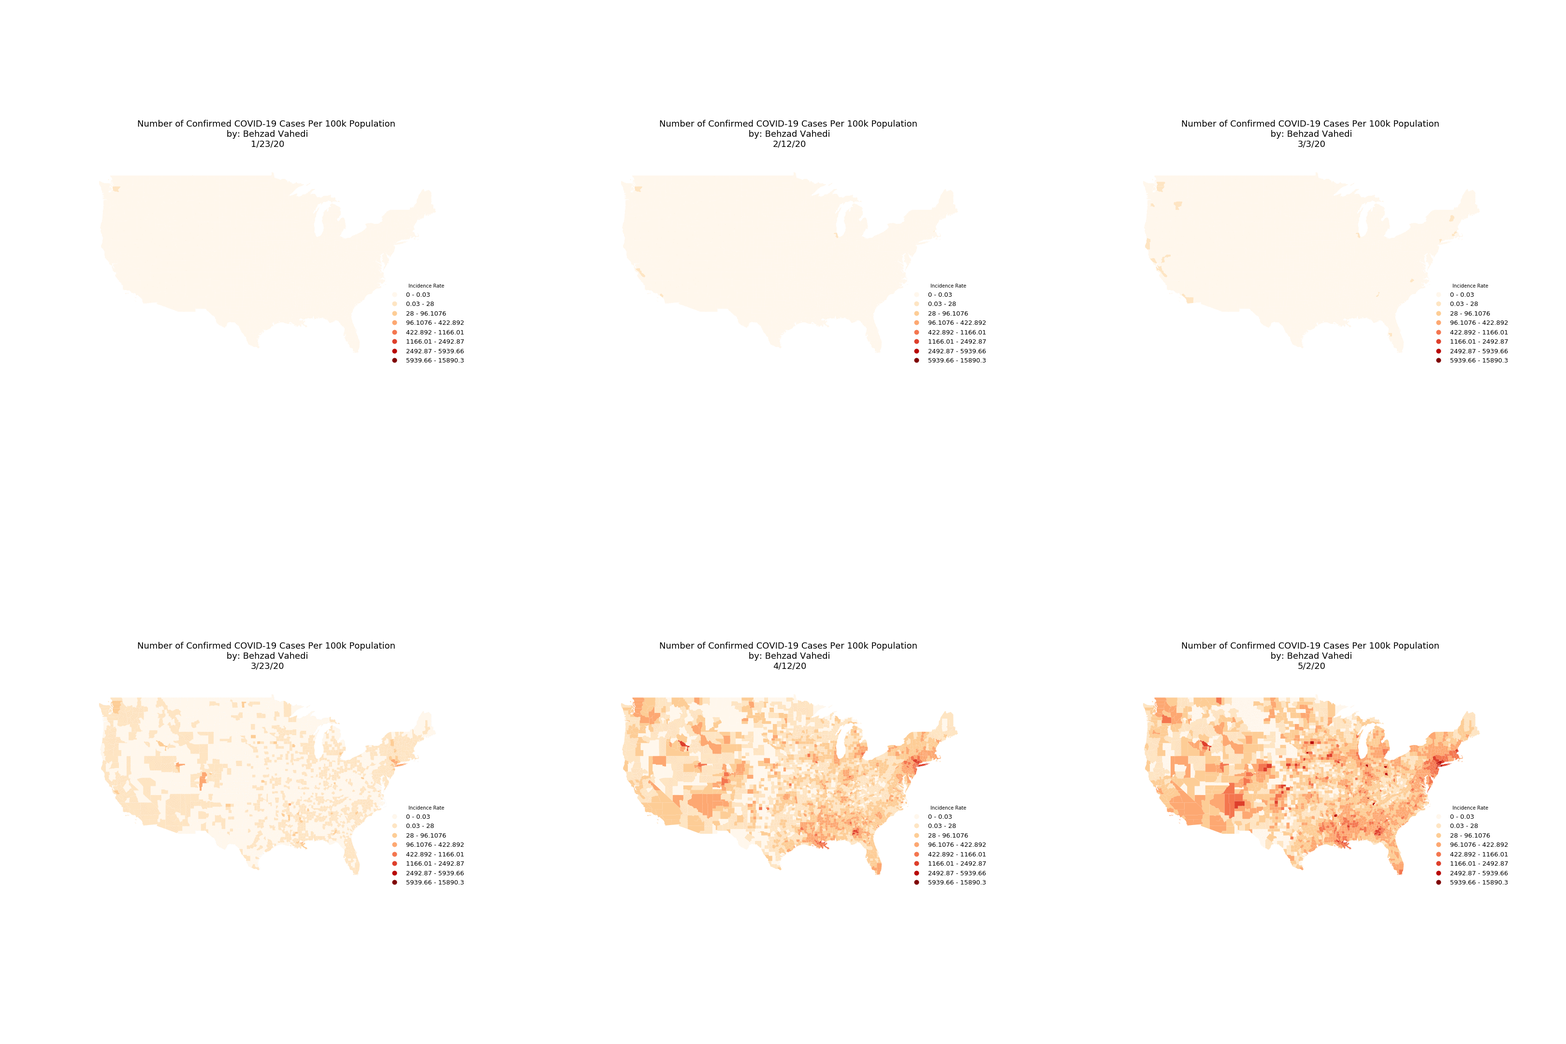
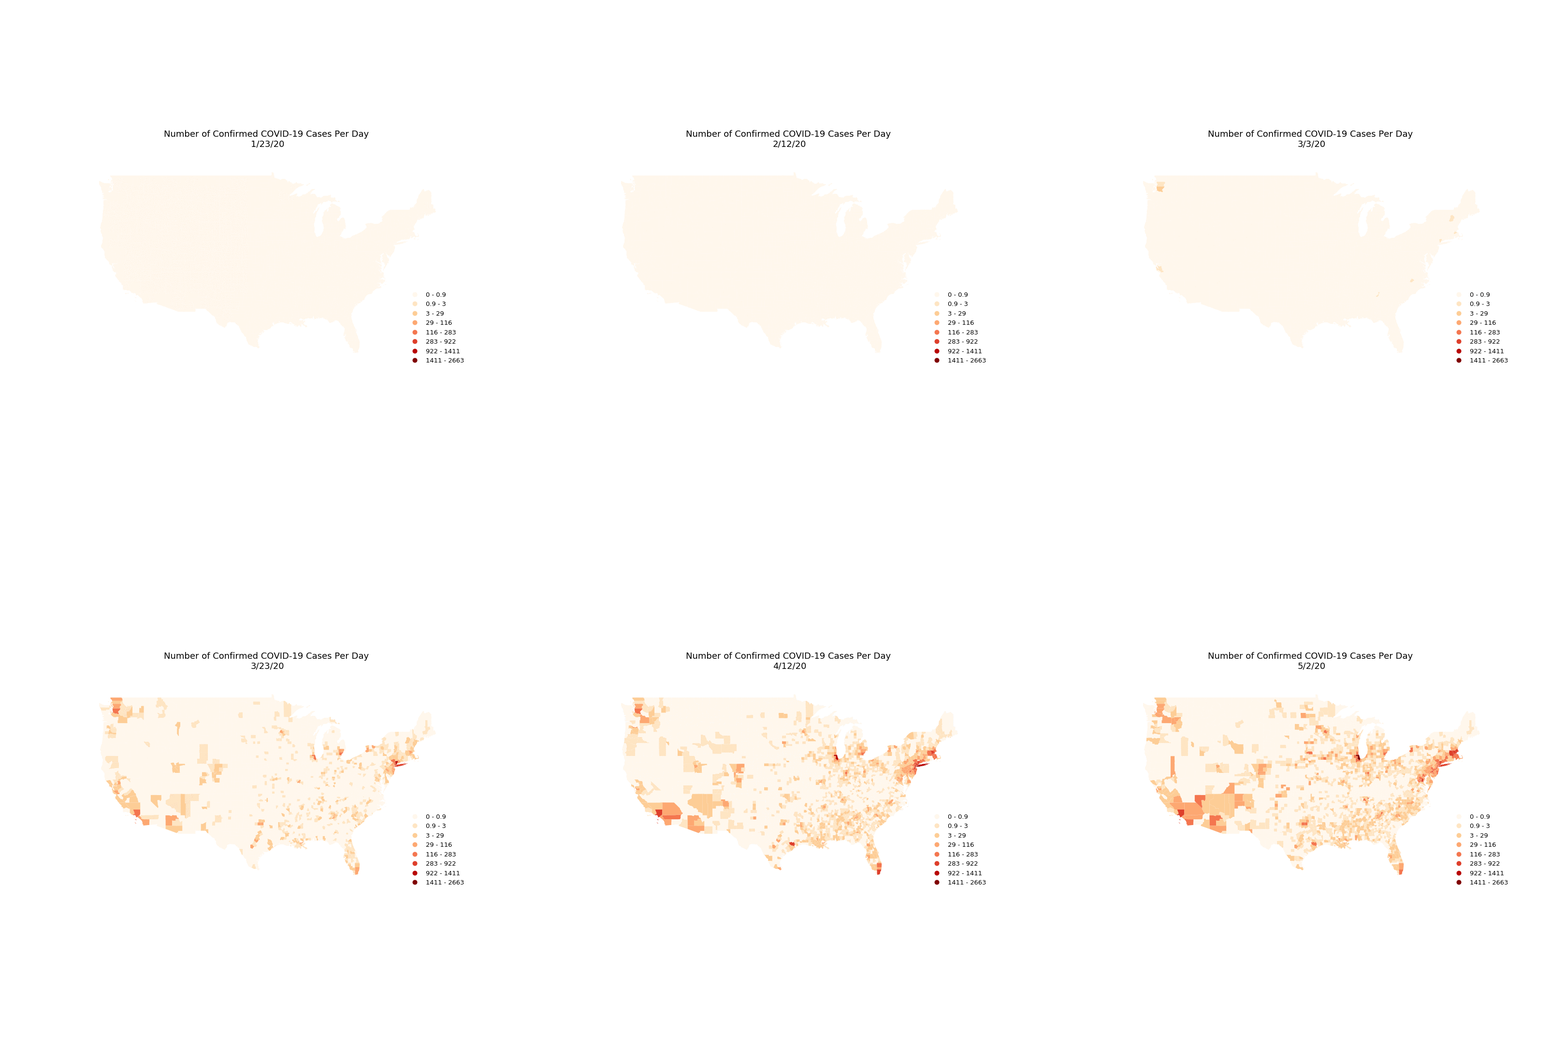
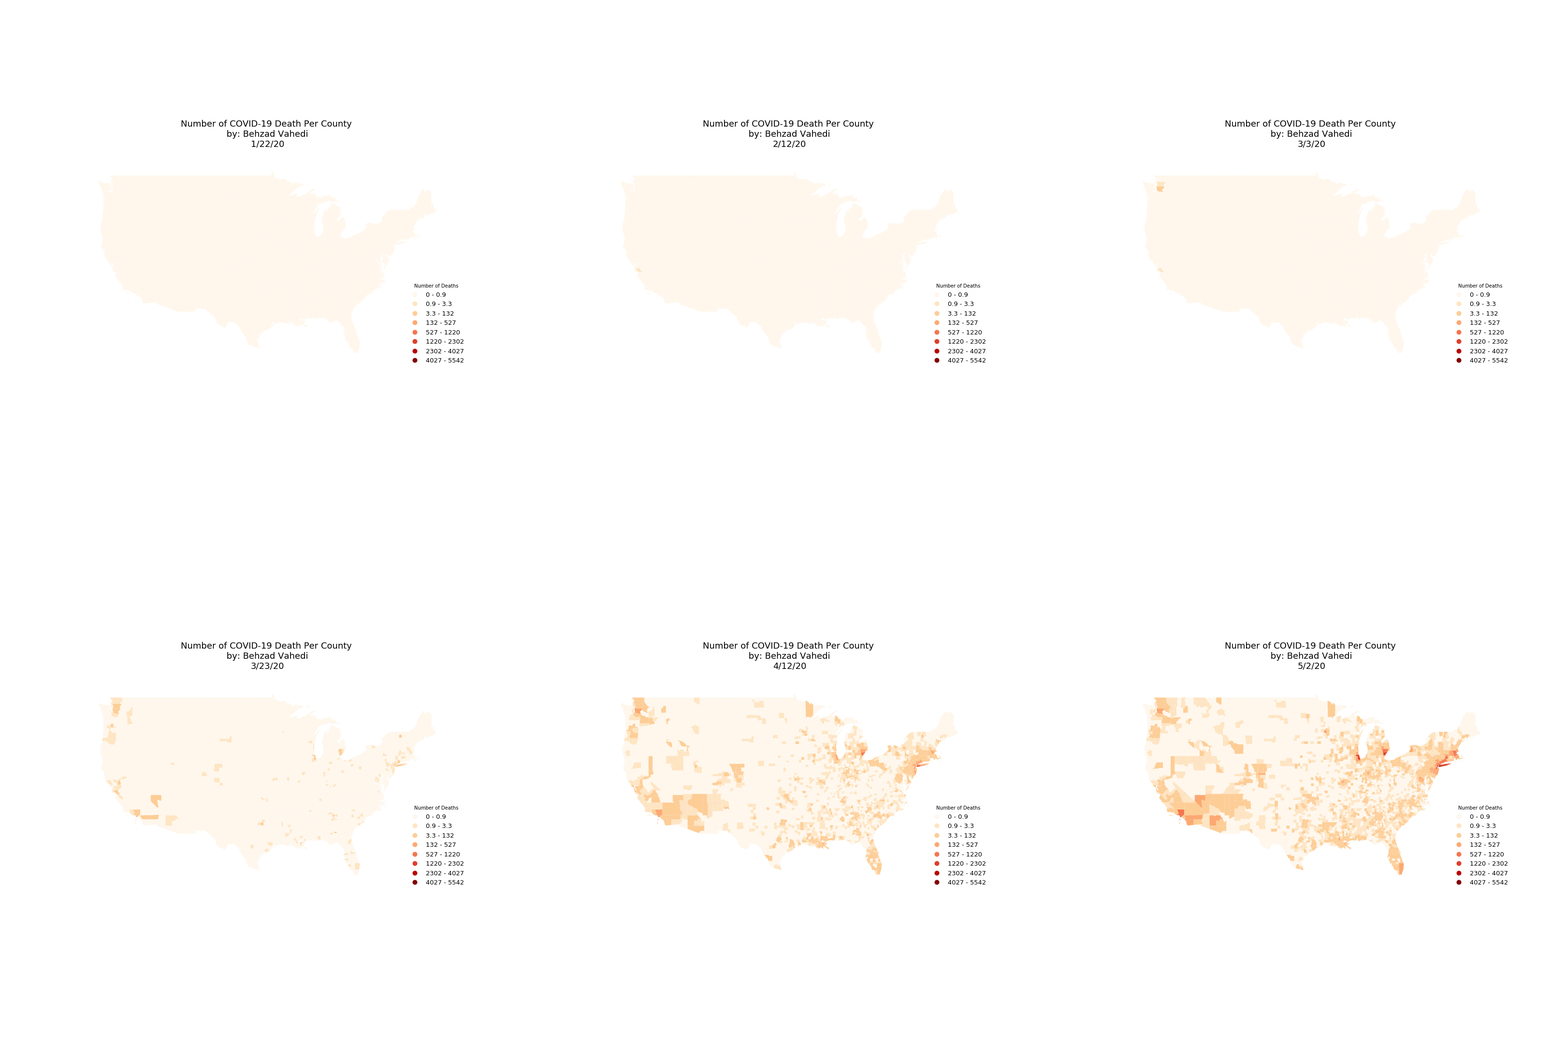
This repository contains the code for mapping spatiotemporal patters of COVID-19 cases and deaths in the contiguous US and at county level. Analysis and mapping performed in Python using geopandas and geoplot libraries. The iPython notebook is available in notebook folder.
County Level COVID-19 data are downloaded from usafacts.org on May 2nd, 2020.
Created by Behzad Vahedi (vahedi.behzad@gmail.com)


