rsbeat - The Beat used to collect and analyze redis slow log.
Production ready, Forked from https://github.com/Yourdream/rsbeat. Add support for redis server which enables authentication.
The current version is 5.3.0.
- Golang 1.7
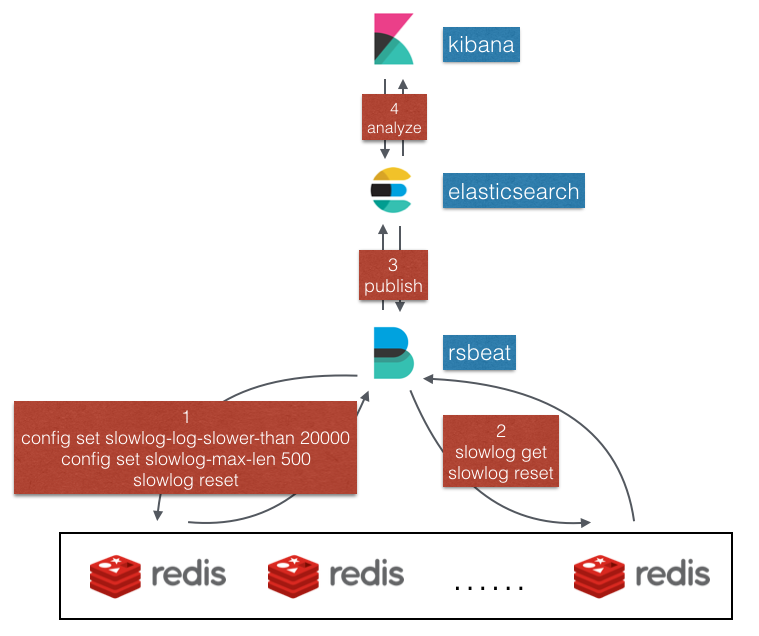
Rsbeat use slowlog get command to read slow log. The following image shows the key flow.
- Rsbeat connects to every redis server and send the following commands.
config set slowlog-log-slower-than 20000 # tell redis to log all commands whose execution time exceeds this time in microseconds
config set slowlog-max-len 500 # tell redis to just record recent 500 slow logs
slowlog reset #tell redis to clear current slow log records- Rsbeat periodically pull slow log from redis.
- Rsbeat publish all slow log events to elasticsearch.
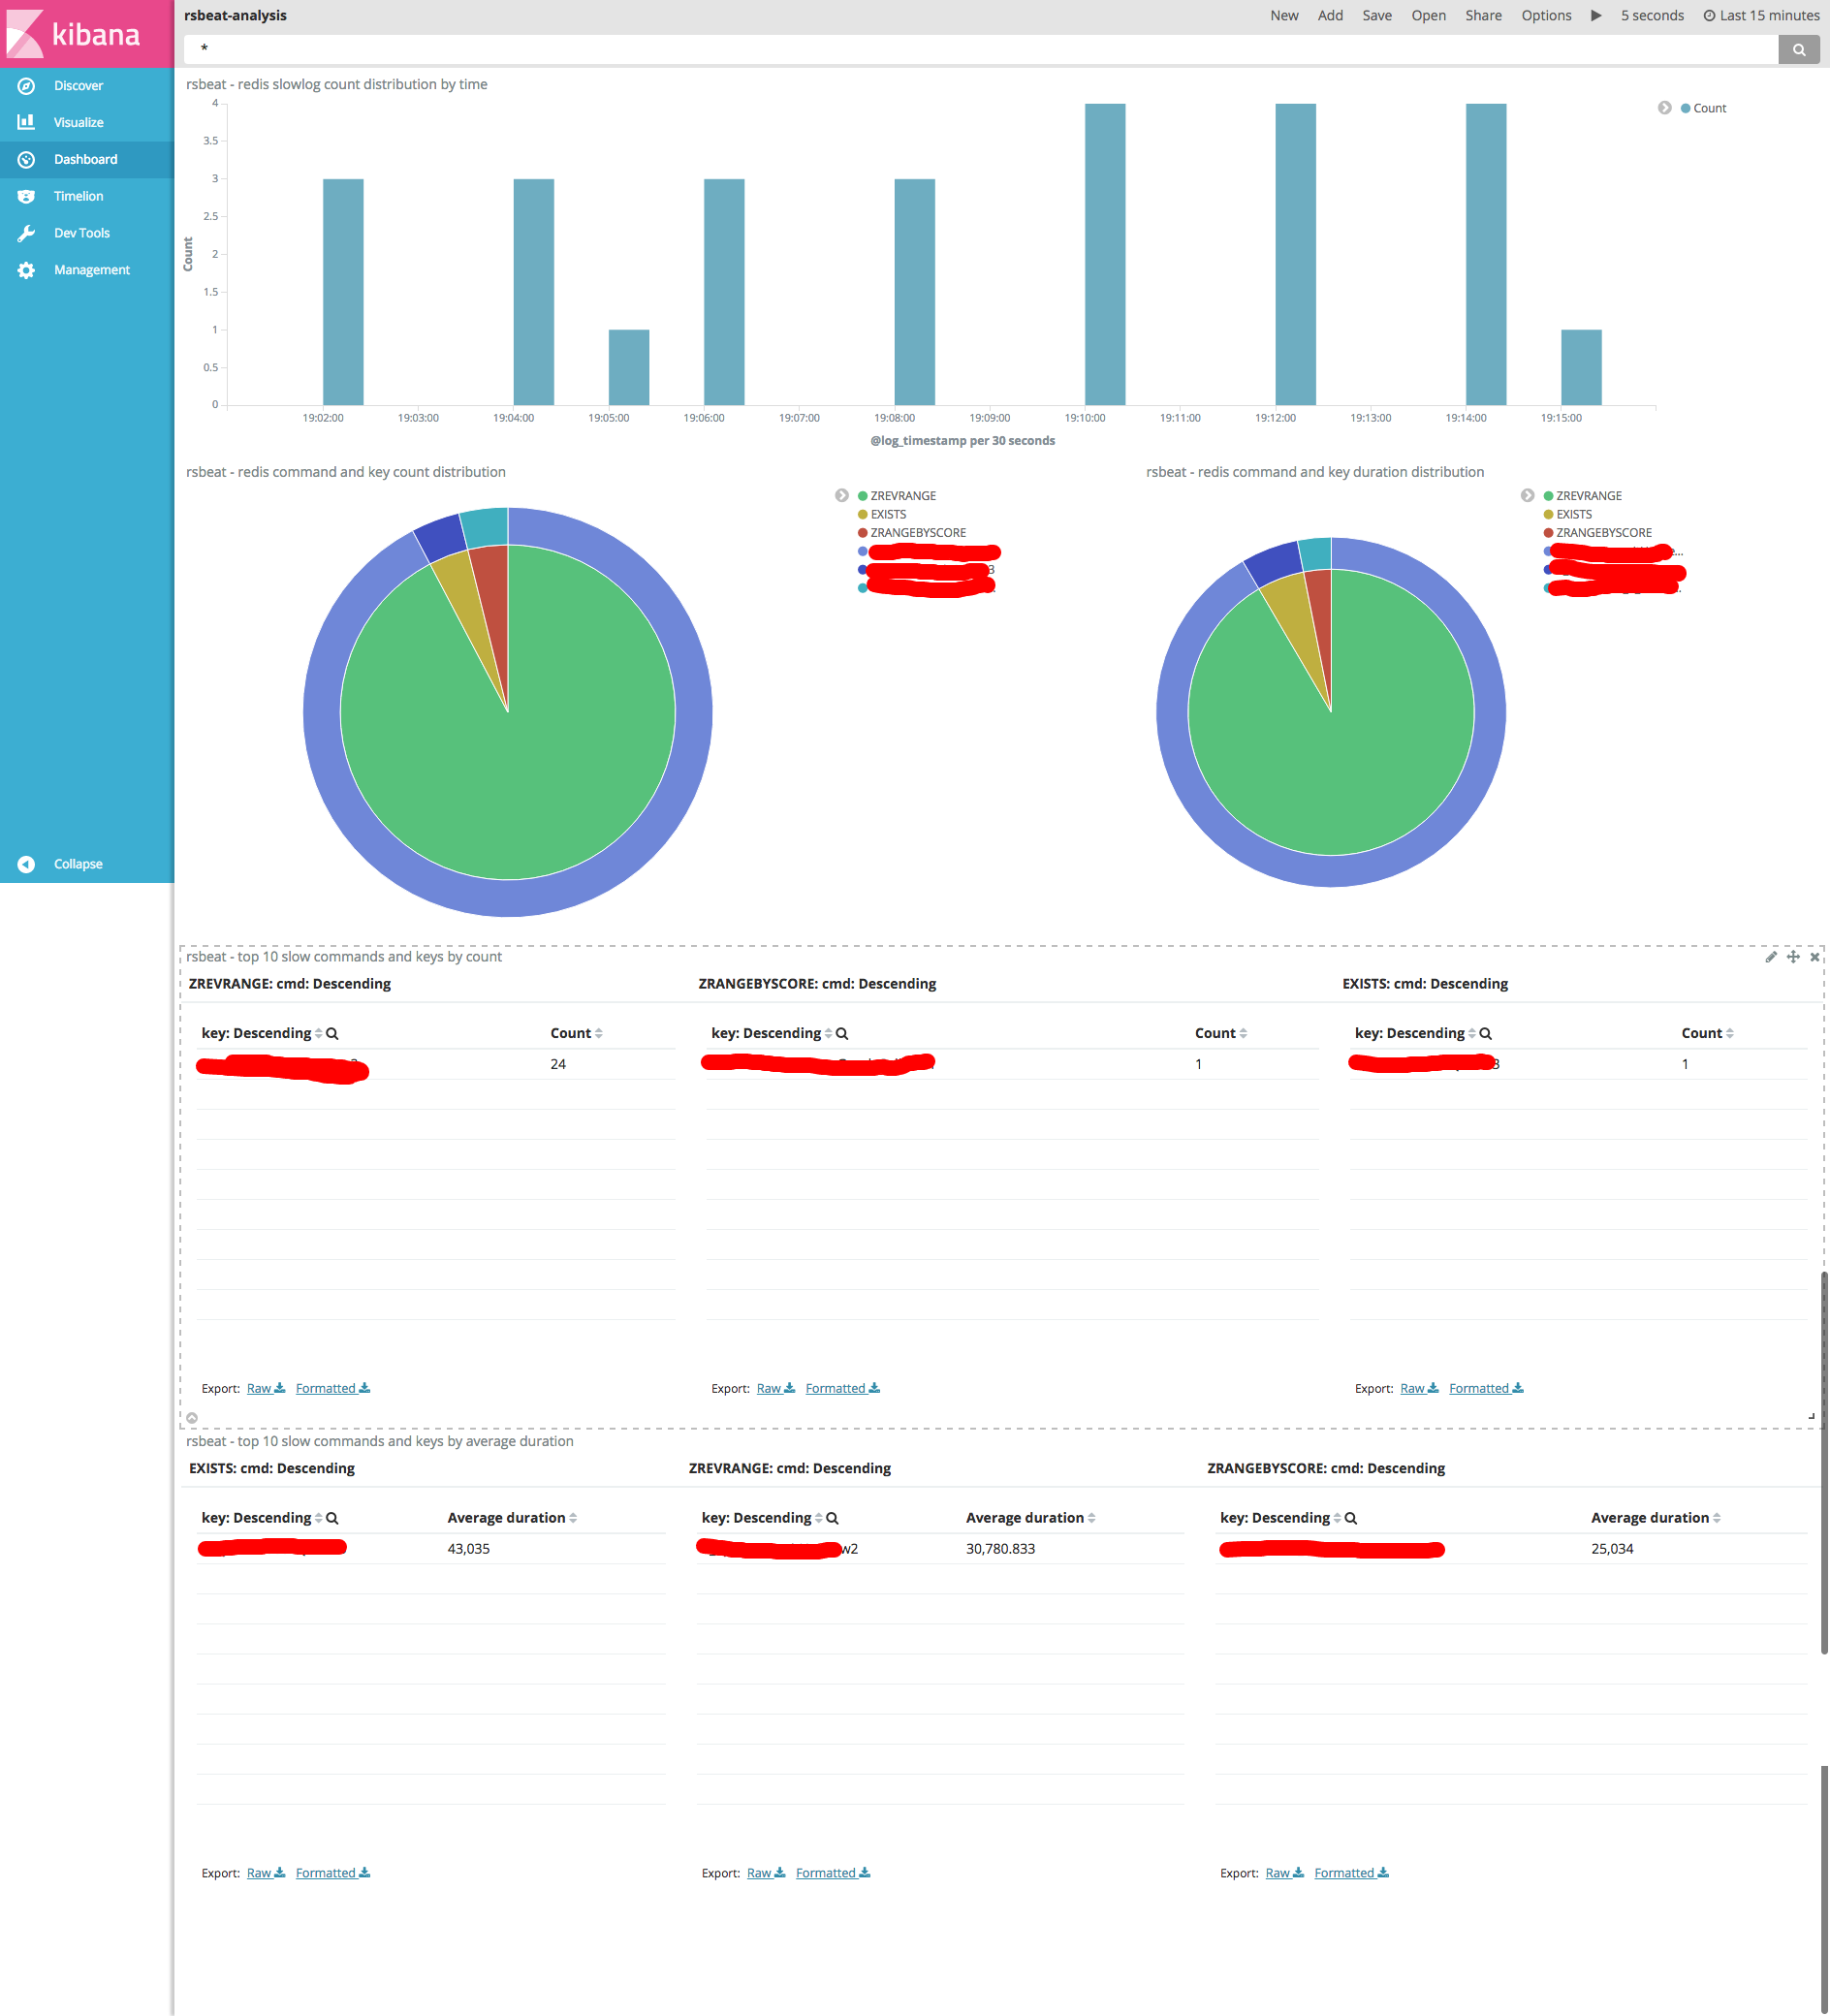
- User can analyze all slow log events through Kibana. Rsbeat has already provided a useful kibana dashboard which user can import directly to kibana.
Like the other beats, rsbeat is easy to use.
To build the binary for rsbeat run the command below. This will generate a binary in the same directory with the name rsbeat.
export GOPATH=${PWD}/gopath
rm -rf ${GOPATH}
rm -rf vendor
mkdir -p vendor
curl -fsSL "https://github.com/elastic/beats/archive/v5.3.0.tar.gz" -o vendor/beats-v5.3.0.tar.gz
curl -fsSL "https://github.com/garyburd/redigo/archive/v1.6.0.tar.gz" -o vendor/redigo-v1.6.0.tar.gz

mkdir -p ${GOPATH}/src/github.com/elastic
mkdir -p ${GOPATH}/src/github.com/garyburd

tar zxf vendor/beats-v5.3.0.tar.gz -C ${GOPATH}/src/github.com/elastic
mv ${GOPATH}/src/github.com/elastic/beats-5.3.0 ${GOPATH}/src/github.com/elastic/beats

tar zxf vendor/redigo-v1.6.0.tar.gz -C ${GOPATH}/src/github.com/garyburd
mv ${GOPATH}/src/github.com/garyburd/redigo-1.6.0 ${GOPATH}/src/github.com/garyburd/redigo

#go get github.com/elastic/beats/libbeat/beat
#go get github.com/garyburd/redigo/redis

if [ ! -h gopath/src/github.com/benamazing/rsbeat ]; then
    mkdir -p gopath/src/github.com/benamazing
    ln -s ../../../.. gopath/src/github.com/benamazing/rsbeat
fi
go build
rm -rf ${GOPATH}
rm -rf vendor
Alternatively, you can download the binary file from release page.
To run rsbeat with debugging output enabled, run:
./rsbeat -c rsbeat.yml -e -d "*"
Rsbeat has the following config fields.
rsbeat:
  period: 1s
  redis: ["192.168.33.10:6379"]
slowerThan: 100 - rsbeat.period: Defines how often an event is sent to the output.
- rsbeat.redis: Defines redis server list, if redis server has authentication, specifies the redis string as "ip:port,password", which separated by comma.
- rsbeat.slowerThan: Defines time in microseconds which is sent to redis server by command
config set slowlog-log-slower-than.
Firstly, run rsbeat.
./rsbeat -c rsbeat.yml
Secondly, import kibana dashboard.
Enjoy your travel to redis slow log now!
We use docker-compose for our docker environment, so we have put a docker-compose.yml file under the project docker directory.
Usage is very simple.
First step: Start kibana
cd docker
docker-compose start kibana
Connect to http://127.0.0.1:5601, you should see kibana interface.
Second step: Download latest rsbeat and run rsbeat
cd docker
curl -fsSL 'https://github.com/Yourdream/rsbeat/releases/download/v5.3.2/rsbeat-linux-amd64' -o rsbeat-linux-amd64
docker-compose build rsbeat
docker-compose run -e "REDIS_LIST=\"10.0.0.40:6379\"" rsbeat
Now you should see logs in console output.
REDIS_LIST is the redis instance you wish to monitor. You can specify more instances like this REDIS_LIST=\"10.0.0.40:6379\",\"10.0.0.21:6379\". But DO NOT USE 127.0.0.1 or localhost host because the docker container network archetecture cannot connect to service in host machine.
The other environment variables are as belows:
PERIODdefines how often an event is sent to the output. For example-e "PERIOD=2s". The default value is1s.ES_URLspecify the elasticsearch url. For example-e "ES_URL=10.0.0.20:9200". The default value iselasticsearch:9200which is the elasticsearch service in docker.REDIS_SLOWER_THANdefines time in microseconds which is sent to redis server by commandconfig set slowlog-log-slower-than. The default value is100.
Third step: Configure kibana
- Add
rsbeat-*index template to kibana and use@log_timestampas theTime-field name. - Import rsbeat-dashboard.json in project root directory in kibana
Management->Saved Objectspage. - Go to dashboard and choose
rsbeat-analysis.
Enjoy it! Check about docker-compose cli reference, elasticsearch docker reference, kibana docker reference for more details.
Following is the exported fields.
{
    "@timestamp": "2017-04-24T04:51:59.000Z",
    "slowId": 717,
    "cmd": "SADD",
    "key": "pushUserId",
    "args": [
      "dfd60b06de3b102afcdcad12sad"
    ],
    "duration": 928,
    "ipPort": "127.0.0.1:6379",
    "extraTime": "2017-04-24T04:51:59Z",
    "beat": {
      "hostname": "localhost",
      "name": "localhost",
      "version": "5.1.3"
    },
    "type": "rsbeat"
  }
Compare to redis slowlog get output fields:
redis 127.0.0.1:6379> slowlog get
1)  1) (integer) 717
    2) (integer) 1493009519
    3) (integer) 928
    4) 1) "SADD"
       2) "pushUserId"
       3) "dfd60b06de3b102afcdcad12sad"
Every entry is composed of four fields coresponding to rsbeat exported fields:
slowId: A unique progressive identifier for every slow log entry.extraTime: The unix timestamp at which the logged command was processed.duration: The amount of time needed for its execution, in microseconds.cmdkeyargs: The array composing the arguments of the command.
Rsbeat has a prebuilt dashboard for you to analyze your slow log quickly.

Go to Kibana Management Menu and import rsbeat-dashboard.json to Saved Objects.
