Benchmarking
Purpose
This project is a benchmarking solution to:
- record system and docker metrics on a node (named
monitored_node)- this node has limited computing / memory (and maybe no LAN / Internet connectivity)
- exploit those metrics on another node (named
analysis_node) with dashboards for manual interpretation
Many use-case are possible, our first one was to record monitoring data on a Pi 3 (monitored_node)
running our offpost, while performing various activities on the web interface (browse Zims, ...).
Since the Pi 3 has limited computing power, we need a stack which is lightweight and capable to
record data for further analysis on any other machine with bigger CPU / RAM (analysis_node). This
is made even more important by the fact that we don't wan't to assume that the Pi has LAN connectivity
since we might need to use this benchmarking stack on the field.
Overview
Elastic metricbeat has been selected to record system and docker activity on the monitoring_node. It has the advantage
to be able to output recorded data in ndjson files, which can be saved on local storage for persistence and transfered afterwards to the analysis_node. It is also very efficient in terms of computing / memory requirements.
We had to compliment the monitored_node with a compactor which is responsible to compact rotated
ndjson files. Elastic metricbeat is capable to rotate files but does not compact rotated ones automatically.
These files are however very good candidates for compaction, achieving up to x10 compaction rate with default
GZip compaction.
On the analysis_node side, elasticsearch and kibana are the natural solution to easily exploit metricbeat data. Dashboards are ready to use to interpret most metricbeat datasets, and feeding ndjson files into elasticsearch is almost straightforward.
Howto
This section describes how to use the stack.
Retrieve source code
Retrieve this repo source code on monitored_node and analysis_node via git clone, curl a zip release, ...
If monitored_node has no Internet access, it is not straightforward. In our case, we simply get the SD Card from the Pi Zero and plug it to another Pi (3/4/...) with Internet access. Then we retrieve what is needed (do not forget also to pull Docker images) and re-plug the SD Card back into the Pi Zero.
Start the stack on monitored_node
Run the docker-compose stack:
cd monitored_node
docker compose -p bench up -d
By default, Metricbeat recorded data will be placed in monitored_node/output, and compressed by compactor in an monitored_node/output/compressed. Feel free to change this in monitored_node/docker-compose.yml.
Add systemctl services
If you want the stack to restart everytime the host starts, you might add systemctl services:
cp systemctl/benchmarking-compressor.service /etc/systemd/system/benchmarking-compressor.service
cp systemctl/benchmarking-metricbeat.service /etc/systemd/system/benchmarking-metricbeat.service
Start them:
systemctl start benchmarking-compressor.service
systemctl start benchmarking-metricbeat.service
Check their status:
systemctl status benchmarking-compressor.service
systemctl status benchmarking-metricbeat.service
Enable them for execution at every startup:
systemctl enable benchmarking-compressor.service
systemctl enable benchmarking-metricbeat.service
Stop the stack on monitored_node
Once monitoring is finished, stop the docker-compose stack:
cd monitored_node
docker compose -p bench down
or if you have installed systemctl services:
systemctl stop benchmarking-compressor.service
systemctl stop benchmarking-metricbeat.service
Start the stack on analysis_node
Change to appropriate directory:
cd analysis_node
Adapt environment variables in analysis_node/.env (e.g. passwords).
Load it into your shell session:
set -a; source .env; set +a
Run the docker-compose stack:
docker compose -p bench up -d
This will start:
es01: an elasticsearch node, accessible on http://localhost:9200kibana: a kibana node, accessible on http://localhost:5601 (use theelasticuser with appropriate password)- some setup containers:
manual-setup: container responsible to create thekibana_systemuser and passwordmetricbeat-setup: container responsible to setup metricbeat datastream and index template in ElasticSearch and dashboards in Kibana (this is done via metricbeat source code)wait-for-me: hack container to not consider that docker-compose stack is up until all others containers are healthy or succesfully completed
uploader: a helper container which will upload metricbeat data placed in theanalysis_node/inputfolder to elasticsearch through the appropriate datastream
Upload data
Once the stack is up and running, you have to load data from monitoring_node to Elasticsearch. Simply retrieve this data from monitored_node/output and copy it to the analysis_node/input folder. After at most 10 secs, uploader will start to push it to Elasticsearch. Everytime a file is uploaded, a companion file with the .done suffix is created, so that this file is not processed again.
Investigate dashboards
You can now investigate monitoring data through Kibana dashboards on http://localhost:5601 (use the elastic user with appropriate password).
Most usefull dashboard with default metricbeat configuration from this repo are:
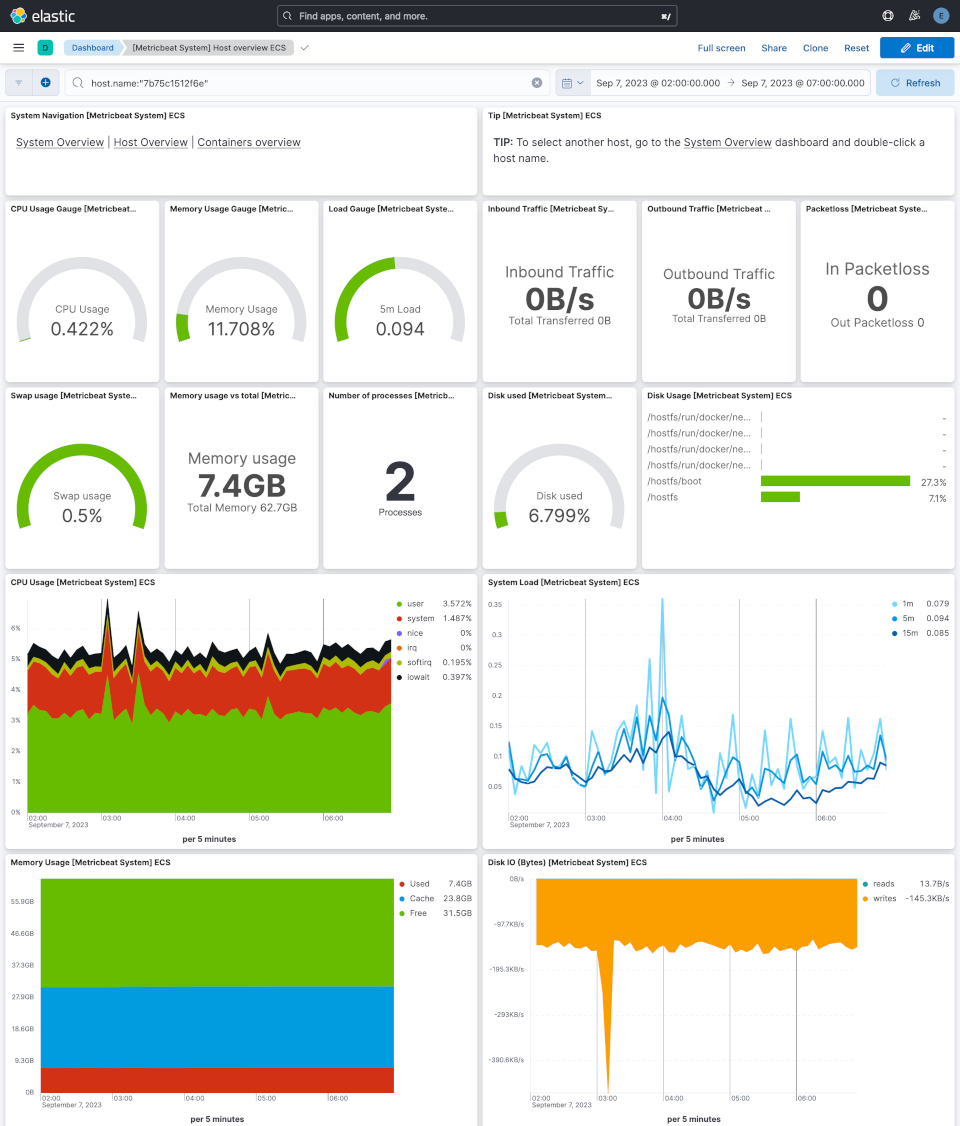
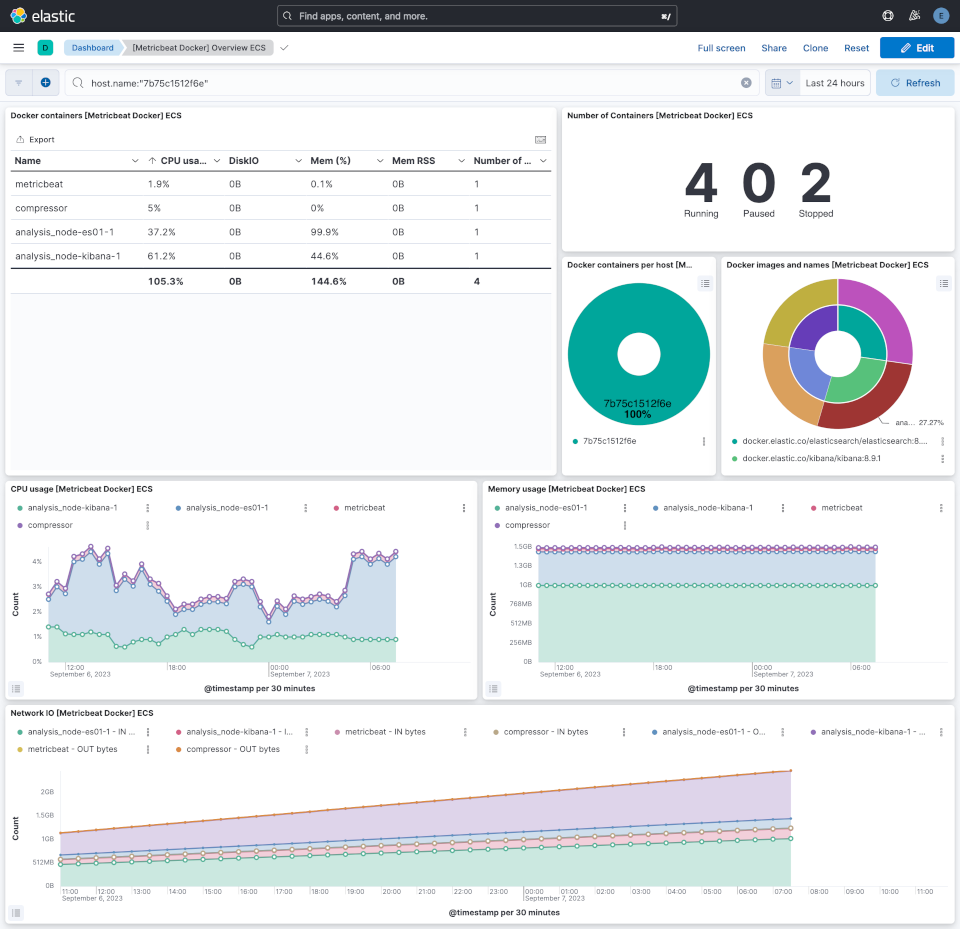
[Metricbeat System] Overview ECS: if you have multiple hosts that have been monitored, you will be able to focus on only one host[Metricbeat System] Host overview ECS: view details about one host activity[Metricbeat Docker] Overview ECS: view details about Docker containers activity
Stop the stack on analysis_node
Once monitoring is finished, stop the docker-compose stack:
cd analysis_node
docker compose -p bench down
or if you have installed systemctl services:
systemctl stop benchmarking-compressor.service
systemctl stop benchmarking-metricbeat.service
Delete all Docker data on analysis_node
docker volume rm bench_esdata01
docker volume rm bench_kibanadata

