tl;dr
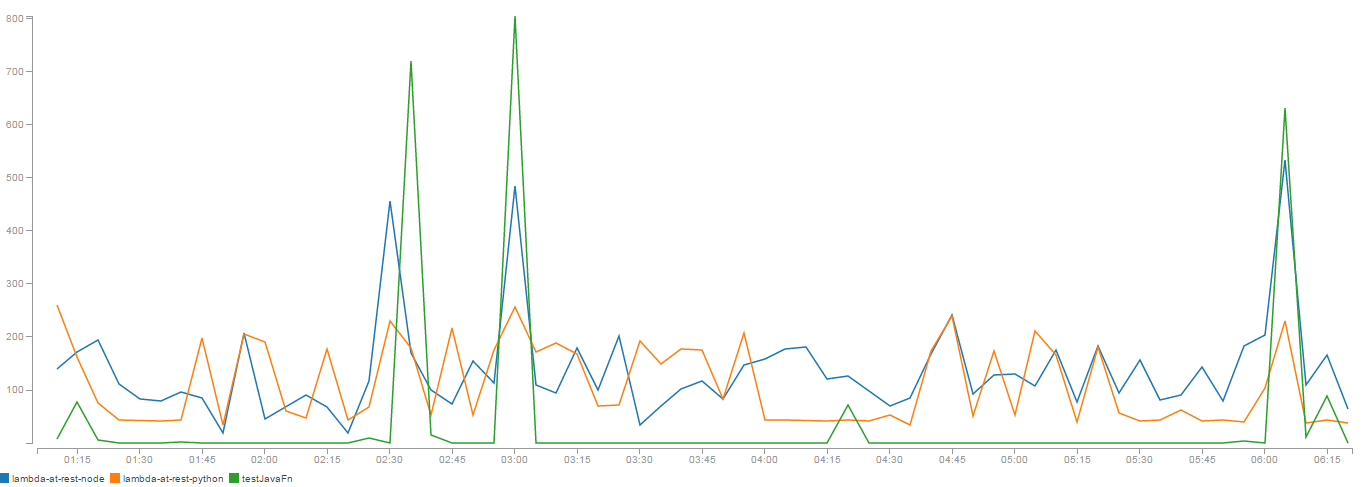
Maximum duration within a 5-minute interval:
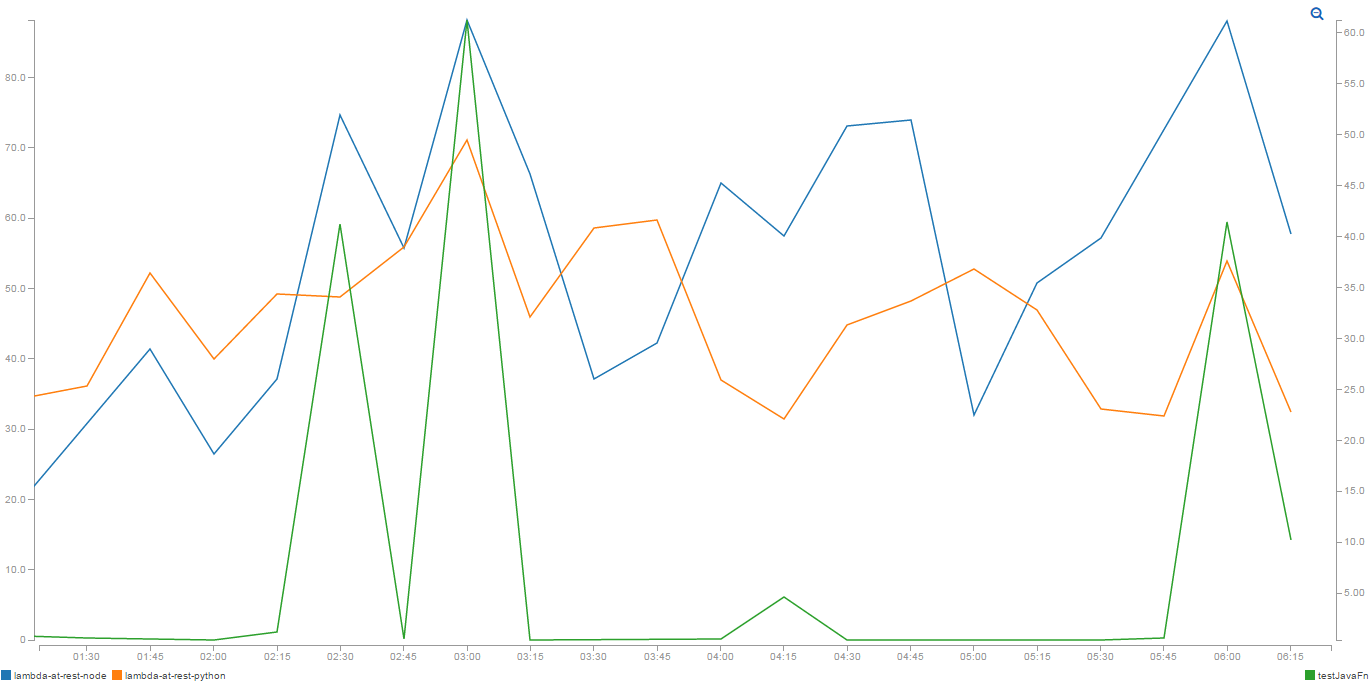
Average duration within a 15-minute interval:
Java wins by an order of magnitude in hot mode (even despite ugly byte-string-json-string-json transformation in the code), but has worst case cold start times roughly 4 times of Python. I attribute this to the size of the code bundle. After a few iterations, the jar file exploded to 6MB (things escalated pretty quickly!).
I have managed to reduce the file size down to 4MB by removing unused classes from a shaded jar file. And yes, it is dangerous.
Tests were run with a Python script: https://github.com/berezovskyi/lambda-test-runner
On AWS, I used standard "blueprints" for Node.js and Python (I did move dynamodb initialization out of the handler in Python code though). Repositories:
- https://github.com/berezovskyi/lambda-test-java
- https://github.com/berezovskyi/lambda-test-python
- https://github.com/berezovskyi/lambda-test-node
Python starts fastest (numbers below are for 100 invocations):
==> java.run <==

real	0m8.461s
user	0m6.365s
sys	    0m1.783s

==> nodejs.run <==

real	0m4.205s
user	0m3.043s
sys	    0m1.184s

==> python.run <==

real    0m1.457s
user    0m0.901s
sys     0m0.531s
Dummy (w/o "Hello world") programs were executed on Ubuntu 14.04.3 LTS inside Virtualbox using the following commands. For Python 2.7.6:
cd python
time (for i in $(seq 100); do python main.py; done) > ../python.run 2>&1
For Oracle Java 1.8.0_72:
cd java
javac main.java
time (for i in $(seq 100); do java Main; done) > ../java.run 2>&1
For Node.js 0.10.25:
cd nodejs/
time (for i in $(seq 100); do nodejs main; done) > ../nodejs.run 2>&1
For memory, the measurement was done even more naively (/usr/bin/time trick):
/usr/bin/time -v python main.py
        ...
        Maximum resident set size (kbytes): 4940
        ...

/usr/bin/time -v java Main
        ...
        Maximum resident set size (kbytes): 18388
        ...

/usr/bin/time -v nodejs main
        ...
        Maximum resident set size (kbytes): 8776
        ...
Results were concatenated using the following command (credit):
tail -n +1 *.run
Better (more representative) and/or more extensive (include native process invocation time and test C/C++/Go) measurements are more than welcome via pull requests!
Okay, numbers seem to be within the same order of magnitude, so the question is how does it look when converted to $$$?
- Memory has little or no effect as it is provisioned in chunks of 64MB, thus making the differences in startup memory consuption negligible.
- Startup time also has limited impact on the billing, as it is rounded up to the nearest 100ms.
- We can calculate, how much would it take to call 1MM functions if they were billed without run time rounding.
Base cost for 1MM function calls taking 128MB RAM and running for 1ms:
base = 1000000 * $0.00001667 / 1000 / 1024 * 128 = $0.00208375
I will calculate the cost for 1MM calls according to:
- 20ms startup time for Python ~ $0.041675
- 40ms startup time for Node.js ~ $0.08335
- 80ms startup time for Java ~ $0.1667
Additionally, every 1MM requests will incur in $0.20 charge by AWS. Taking into account that it looks negligible when compared to actual runtime costs, I think it's pretty safe to optimise function performance (or choose the runtime accordingly) instead of focusing on startup time unless you run into additional 100ms cost every function call.
Also, 1MM API Gateway requests would cost you $3.50, which means that this comparison is virtually useless if you're working on a dirt cheap API backend.
Actually, a feature request is under review.
==> output/c.run <==

real    0m0.040s
user    0m0.007s
sys 0m0.000s

==> output/go.run <==

real    0m0.081s
user    0m0.003s
sys 0m0.007s


