WIP...pre-spell check
Materials for the Deploy and Monitor ML Pipelines with Open Source and Free Applications workshop at the AI_dev 2024 conference in Paris, France.
When 📆: Wednesday, June 19th, 13:50 CEST
The workshop is based on the LinkedIn Learning course - Data Pipeline Automation with GitHub Actions, code is available here.
The workshop will focus on different deployment designs of machine learning pipelines using open-source applications and free-tier tools. We will use the US hourly demand for electricity data from the EIA API to demonstrate the deployment of a pipeline with GitHub Actions and Docker that fully automates the data refresh process and generates a forecast on a regular basis. This includes the use of open-source tools such as MLflow and YData Profiling to monitor the health of the data and the model's success. Last but not least, we will use Quarto doc to set up the monitoring dashboard and deploy it on GitHub Pages.
The Seine river, Paris (created with Midjourney)- Milestones
- Scope
- Set a Development Environment
- Data Pipeline
- Forecasting Models
- Metadata
- Dashboard
- Deployment
- License
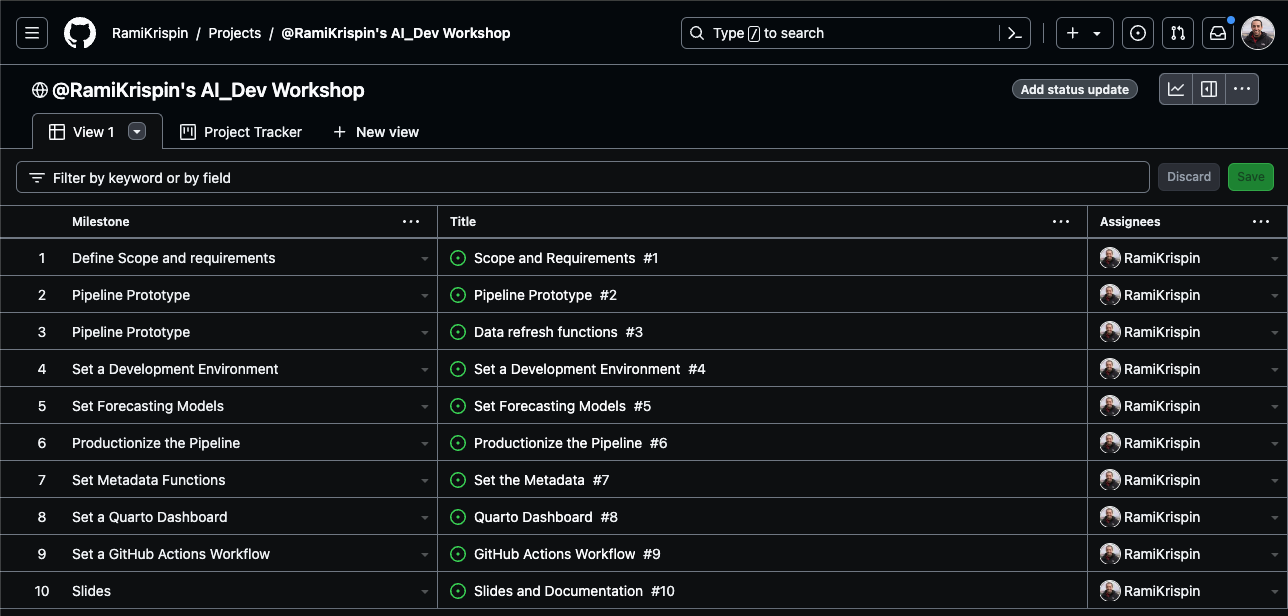
To organize and track the project requirements, we will set up a GitHub Project, create general milestones, and use issues to define sub-milestone. For setting up a data/ML pipeline, we will define the following milestones:
- Define scope and requirements:
- Pipeline scope
- Forecasting scope
- General tools and requirements
- Set a development environment:
- Set a Docker image
- Update the Dev Containers settings
- Data pipeline prototype:
- Create pipeline schema/draft
- Build a prototype
- Test deployment on GitHub Actions
- Set forecasting models:
- Create MLflow experiment
- Set backtesting function
- Define forecasting models
- Test and evaluate the models' performance
- Select the best model for deployment
- Set a Quarto dashboard:
- Create a Quarto dashboard
- Track the data and forecast
- Monitor performance
- Productionize the pipeline:
- Clean the code
- Define unit tests
- Deploy the pipeline and dashboard to GitHub Actions and GitHub Pages:
- Create a GitHub Actions workflow
- Refresh the data and forecast
- Update the dashboard
The milestones are available in the repository issues section, and you can track them on the project tracker.
The project trackerGoal: Forecast the hourly demand for electricity in the California Independent System Operator subregion (CISO).
This includes the following four providers:
- Pacific Gas and Electric (PGAE)
- Southern California Edison (SCE)
- San Diego Gas and Electric (SDGE)
- Valley Electric Association (VEA)
Forecast Horizon: 24 hours Refresh: Every 24 hours
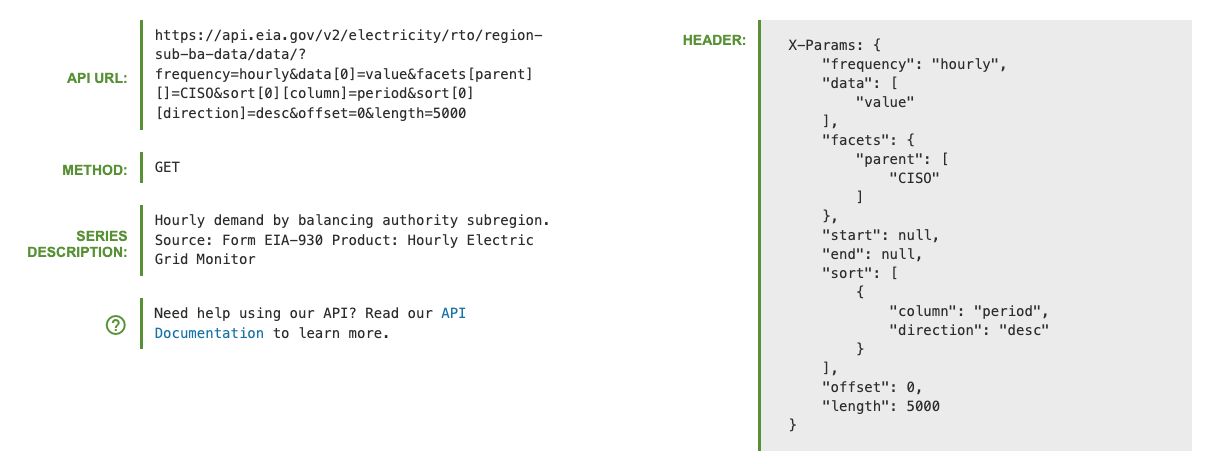
The data is available on the EIA API, the API dashboard provides the GET setting to pull the above series.
The GET request detials from the EIA API dashboard- The following functions:
- Data backfill function
- Data refresh function
- Forecast function
- Metadata function
- Docker image
- EIA API key


