This project welcomes contributions and suggestions. We are happy to have the Community involved via submission of Issues and Pull Requests (with substantive content or even just fixes). We are hoping for the documents, test framework, etc. to become a community process with active engagement. PRs can be reviewed by by any number of people, and a maintainer may accept.
See CONTRIBUTING and GitHub Basic Process for more details.
❗ docker-compose is deprecated. For details, see Migrate to Compose V2.
- Run
docker compose up -dordocker-compose up -d - Open
http://localhost:3000/explorefor querying InfluxDB - Open
http://localhost:9091/api/v1/query?query=dpu_bytes_readfor querying Prometheus
-
OPI adoped https://opentelemetry.io/ for DPUs
-
OPI goal is to pick 1 standard protocol that
- all vendors can implement (both linux and non-linux based)
- DPU consumers can integrate once in their existing monitoring systems and tools
-
OpenTemetry suports those data sources
- Traces
- Metrics
- Logs
-
OpenTemetry is made up of several main components:
- Specification
- Collector and Collector Contrib
- SDKs (different programming languages), for example Python, Java and Go
-
OPI is only mandating OTEL
Specification -
SDK and Collector specific implementation are left to the users
- They can be also from OTEL or other sources.
See https://opentelemetry.io/docs/collector/deployment
-
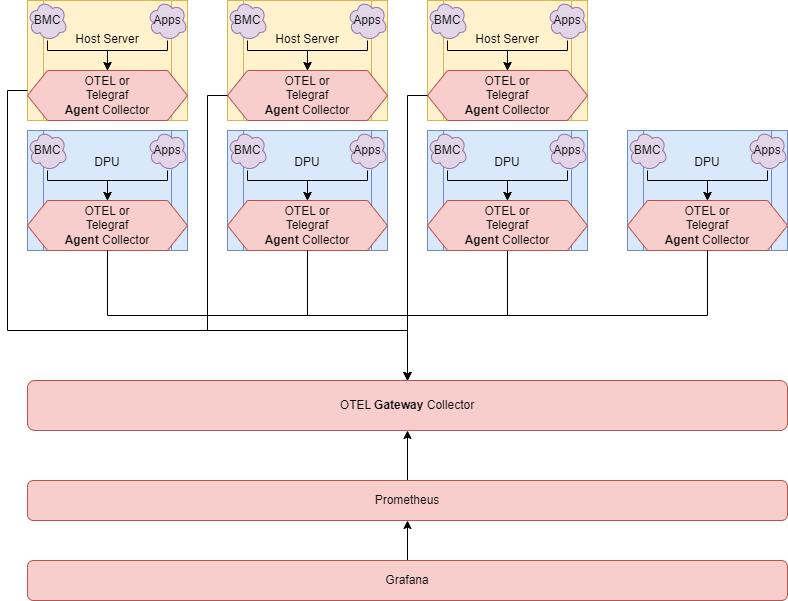
OpenTemetry collector supports several deployments:
- Deploy as side car inside every pod
- Deploy another one as aggregator per Node
- Deploy another one as super-aggregator per Cluster
-
The benefits of having multiple collectors at different levels are:
- Increased redundancy
- Enrichment
- Filtering
- Separating trust domains
- Batching
- Sanitization
-
Recommendation (reference)
- micro-aggregator inside each DPU/IPU
- macro-aggregator between DPUs
- macro-aggregator can run on the host with DPU/IPU or on a separate host
-
System monitoring (cpu,mem,nic,...)
-
BMC monitoring (temp, power)
- Redfish extention for OTEL collector can be used to collect HW/BMC related metrics like temperature, power and others...
- For testing using mockup :
docker run --rm dmtf/redfish-mockup-server:1.1.8
-
TBD
- OPI wants to define which telemetries are mandatory for each vendor to implement and which are optional
see https://spdk.io/doc/jsonrpc_proxy.html
Use this patch to handle chunked data https://review.spdk.io/gerrit/c/spdk/spdk/+/12082
sudo ./spdk/scripts/rpc_http_proxy.py 127.0.0.1 9009 spdkuser spdkpass
Test Proxy is running correctly
curl -k --user spdkuser:spdkpass -X POST -H "Content-Type: application/json" -d '{"id": 1, "method": "bdev_get_bdevs", "params": {"name": "Malloc0"}}' http://127.0.0.1:9009/
- Tracing inside DPU/IPU (more tight SDK integration into our service and IPDK), streaming to zipkin/jaeger
- TODO: need more details and examples
- For example https://github.com/open-telemetry/opentelemetry-collector-contrib/tree/main/receiver/syslogreceiver
- TODO: need more details and examples
curl --fail http://127.0.0.1:9091/api/v1/query?query=mem_free | grep mem_free
curl --fail http://127.0.0.1:9091/api/v1/query?query=cpu_usage_user | grep cpu_usage_user
curl --fail http://127.0.0.1:9091/api/v1/query?query=dpu_num_blocks | grep dpu_num_blocks
curl --fail http://127.0.0.1:9091/api/v1/query?query=net_bytes_recv_total | grep net_bytes_recv_total
curl --fail http://127.0.0.1:9091/api/v1/query?query=nginx_requests | grep nginx_requests
curl --fail http://127.0.0.1:9091/api/v1/query?query=redfish_thermal_fans_reading_rpm | grep redfish_thermal_fans_reading_rpm
$ docker run --rm --net=host -v $(pwd)/telegraf.conf:/etc/telegraf/telegraf.conf:ro telegraf:1.22
2022-03-29T18:47:11Z I! Using config file: /etc/telegraf/telegraf.conf
2022-03-29T18:47:11Z I! Starting Telegraf 1.22.0
2022-03-29T18:47:11Z I! Loaded inputs: http
2022-03-29T18:47:11Z I! Loaded aggregators:
2022-03-29T18:47:11Z I! Loaded processors:
2022-03-29T18:47:11Z W! Outputs are not used in testing mode!
2022-03-29T18:47:11Z I! Tags enabled: host=localhost

dpu,host=866da842daa4,name=Malloc0,url=http://spdk:9009 write_latency_ticks=0,num_unmap_ops=0,num_read_ops=2,num_write_ops=0,unmap_latency_ticks=0,bytes_read=36864,bytes_unmapped=0,read_latency_ticks=323535,bytes_written=0 1674846640000000000
dpu,host=866da842daa4,name=Malloc1,url=http://spdk:9009 bytes_read=36864,read_latency_ticks=92186,bytes_unmapped=0,num_unmap_ops=0,unmap_latency_ticks=0,write_latency_ticks=0,num_read_ops=2,bytes_written=0,num_write_ops=0 1674846640000000000

mem,host=52ee5c75df01 commit_limit=69312983040i,committed_as=13494636544i,huge_page_size=2097152i,used_percent=10.100053796757296,high_free=0i,inactive=13541511168i,low_free=0i,shared=3904901120i,sreclaimable=812650496i,swap_cached=0i,free=100370612224i,huge_pages_total=2048i,low_total=0i,page_tables=49500160i,used=13567504384i,huge_pages_free=1357i,mapped=901996544i,slab=2243977216i,swap_total=4294963200i,cached=20385955840i,vmalloc_chunk=0i,vmalloc_used=0i,write_back=0i,swap_free=4294963200i,high_total=0i,available_percent=86.20598148102354,available=115801366528i,sunreclaim=1431326720i,total=134331011072i,buffered=6938624i,dirty=856064i,vmalloc_total=14073748835531776i,write_back_tmp=0i,active=8859537408i 1650954170000000000

net,host=52ee5c75df01,interface=eth0 drop_in=0i,drop_out=0i,bytes_sent=16589i,bytes_recv=13986i,packets_sent=89i,packets_recv=110i,err_in=0i,err_out=0i 1650954170000000000

nginx,host=6465dac4e3a5,port=80,server=web waiting=0i,active=1i,accepts=1i,handled=1i,requests=2i,reading=0i,writing=1i 1677179010000000000

cpu,cpu=cpu0,host=52ee5c75df01 usage_user=99.6999999973923,usage_system=0.09999999999763531,usage_idle=0,usage_iowait=0,usage_softirq=0,usage_steal=0,usage_nice=0,usage_irq=0.19999999999527063,usage_guest=0,usage_guest_nice=0 1650954170000000000
cpu,cpu=cpu1,host=52ee5c75df01 usage_user=99.70000000204891,usage_system=0,usage_irq=0.2999999999974534,usage_steal=0,usage_idle=0,usage_nice=0,usage_iowait=0,usage_softirq=0,usage_guest=0,usage_guest_nice=0 1650954170000000000
cpu,cpu=cpu2,host=52ee5c75df01 usage_system=0,usage_idle=0,usage_iowait=0,usage_guest_nice=0,usage_user=99.79999999981374,usage_nice=0,usage_irq=0.20000000000436557,usage_softirq=0,usage_steal=0,usage_guest=0 1650954170000000000
cpu,cpu=cpu3,host=52ee5c75df01 usage_guest_nice=0,usage_user=99.79999999981374,usage_idle=0,usage_nice=0,usage_iowait=0,usage_guest=0,usage_system=0,usage_irq=0.20000000000436557,usage_softirq=0,usage_steal=0 1650954170000000000
cpu,cpu=cpu4,host=52ee5c75df01 usage_user=99.70029970233988,usage_guest=0,usage_steal=0,usage_guest_nice=0,usage_system=0.09990009990223975,usage_idle=0,usage_nice=0,usage_iowait=0,usage_irq=0.19980019979993657,usage_softirq=0 1650954170000000000
cpu,cpu=cpu5,host=52ee5c75df01 usage_nice=0,usage_iowait=0,usage_irq=0.2997002997044478,usage_softirq=0,usage_steal=0,usage_guest_nice=0,usage_user=99.70029970233988,usage_idle=0,usage_guest=0,usage_system=0 1650954170000000000

redfish_thermal_temperatures,address=bmc,health=OK,host=fd287855dfb3,member_id=0,name=CPU1\ Temp,rack=WEB43,row=North,source=web483,state=Enabled reading_celsius=41,upper_threshold_critical=45,upper_threshold_fatal=48 1659628400000000000
redfish_thermal_temperatures,address=bmc,host=fd287855dfb3,member_id=1,name=CPU2\ Temp,rack=WEB43,row=North,source=web483,state=Disabled upper_threshold_critical=45,upper_threshold_fatal=48 1659628400000000000
redfish_thermal_temperatures,address=bmc,health=OK,host=fd287855dfb3,member_id=2,name=Chassis\ Intake\ Temp,rack=WEB43,row=North,source=web483,state=Enabled reading_celsius=25,upper_threshold_critical=40,upper_threshold_fatal=50,lower_threshold_critical=5,lower_threshold_fatal=0 1659628400000000000

redfish_thermal_fans,address=bmc,health=OK,host=fd287855dfb3,member_id=0,name=BaseBoard\ System\ Fan,rack=WEB43,row=North,source=web483,state=Enabled lower_threshold_fatal=0i,reading_rpm=2100i 1659628400000000000
redfish_thermal_fans,address=bmc,health=OK,host=fd287855dfb3,member_id=1,name=BaseBoard\ System\ Fan\ Backup,rack=WEB43,row=North,source=web483,state=Enabled lower_threshold_fatal=0i,reading_rpm=2050i 1659628400000000000

redfish_power_powersupplies,address=bmc,health=Warning,host=fd287855dfb3,member_id=0,name=Power\ Supply\ Bay,rack=WEB43,row=North,source=web483,state=Enabled line_input_voltage=120,last_power_output_watts=325,power_capacity_watts=800 1659628400000000000

redfish_power_voltages,address=bmc,health=OK,host=fd287855dfb3,member_id=0,name=VRM1\ Voltage,rack=WEB43,row=North,source=web483,state=Enabled lower_threshold_critical=11,lower_threshold_fatal=10,reading_volts=12,upper_threshold_critical=13,upper_threshold_fatal=15 1659628400000000000
redfish_power_voltages,address=bmc,health=OK,host=fd287855dfb3,member_id=1,name=VRM2\ Voltage,rack=WEB43,row=North,source=web483,state=Enabled reading_volts=5,upper_threshold_critical=7,lower_threshold_critical=4.5 1659628400000000000

...
- Is there integration of OTEL with kvm or esx ?
- Use case of standalone DPU, not attached to server. Still runs OTEL collector
- #7 Starting new workstream to find out set of common metrics across vendors that OPI will mandate
- Action items on Marvell, Nvidia, Intell to come up with the list and present on the next meeting
- #6 Starting new POC with OTEL SDK and hello world app
- Action items on Nvidia to help compiling DOCA with OTEL SDK (i.e. https://github.com/open-telemetry/opentelemetry-cpp ) and hello world app to show metrics/traces streaming to standard ecosystem (zipkin/grafana/elastic/...)
- #5 Continue working on existing telegraf example and enhance with more metrics


