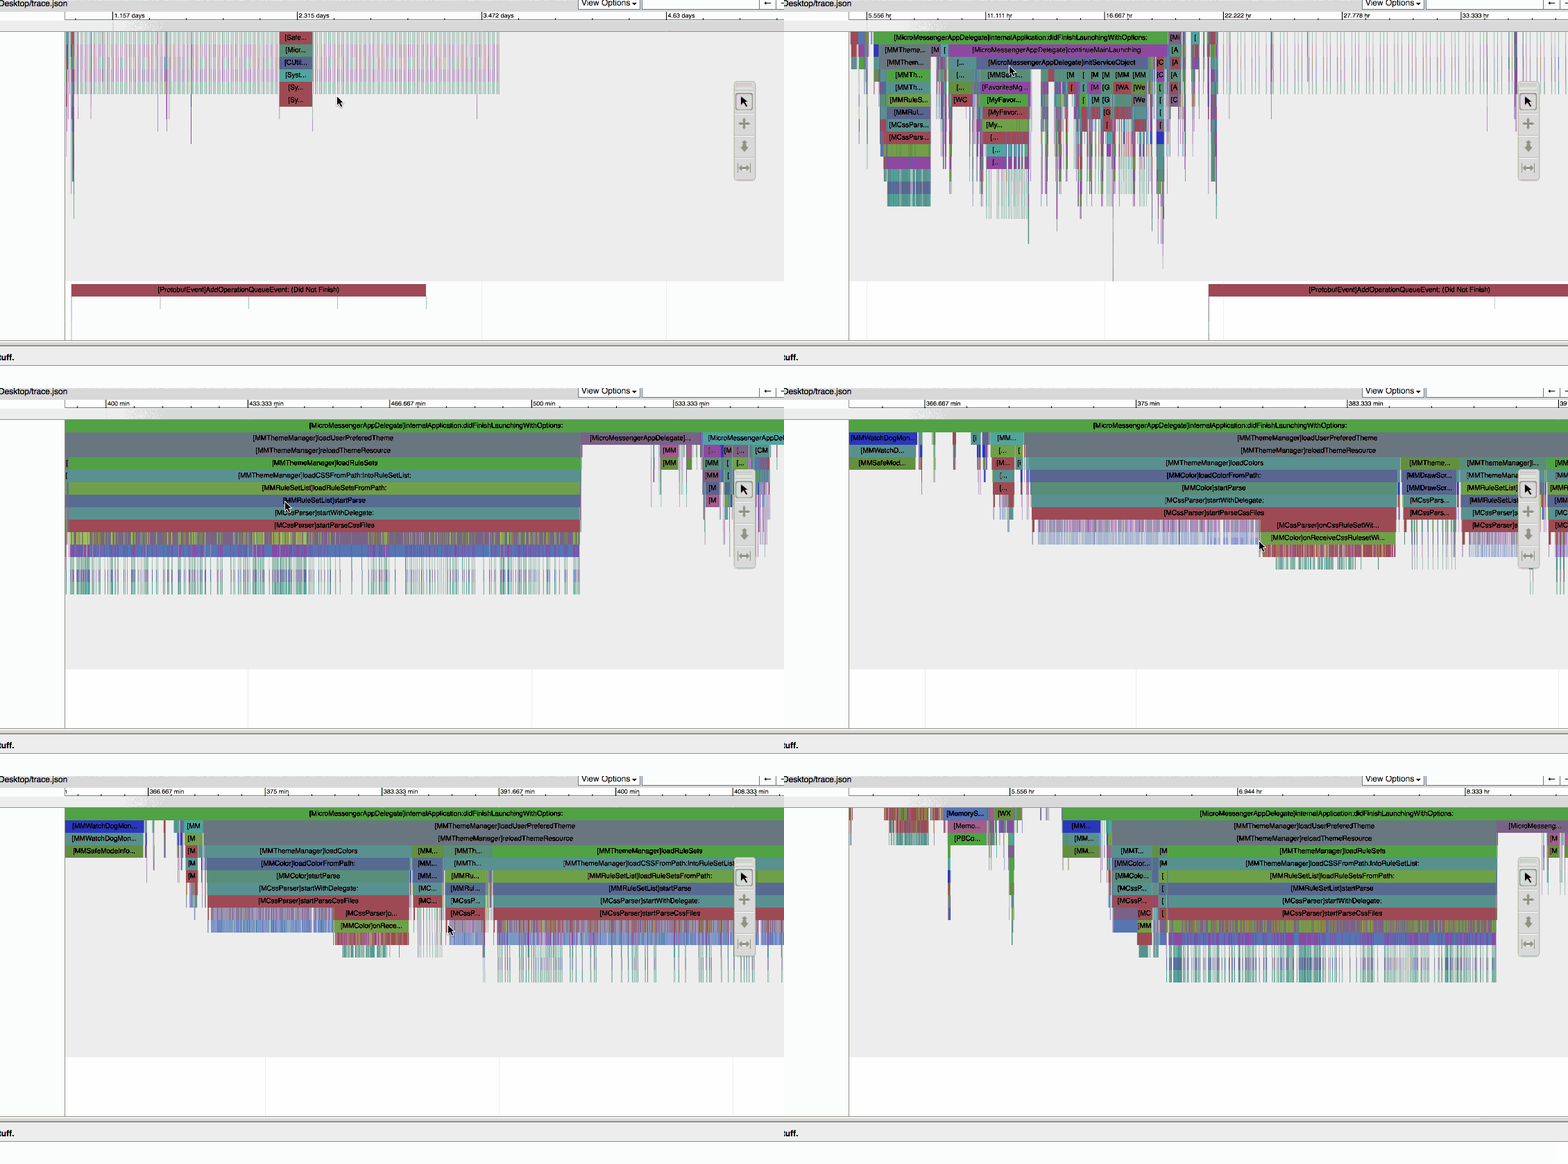
Trace tool for iOS/macOS
AppleTrace is developed for analyzing app's performance on iOS/macOS.
Let's talk in Gitter 或者加微信群(见页面最下面)
- User-defined trace section.
- [arm64 under debugger only] Trace all Objective C methods.
git clone --recursive https://github.com/everettjf/AppleTrace.git
For stable release , please refer to Releases
- Produce trace data.
- Copy from app's sandbox directory.
- Merge (all) trace data files into one file
trace.json. (There may be more than 1 trace file.) - Generate
trace.htmlbased ontrace.json.
See below for more detail.
Until now , there are 2 ways for generating trace data.
(1) Manual set section.
Call APTBeginSection at the beginning of method ,and APTEndSection at the end of method. For Objective C method (whether instance method or class method), there are APTBegin and APTEnd macro for easy coding.
void anyKindsOfMethod{
    APTBeginSection("process");
    // some code
    APTEndSection("process");
}

- (void)anyObjectiveCMethod{
    APTBegin;
    // some code
    APTEnd;
}
Sample app is sample/ManualSectionDemo.
(2) Dynamic library hooking all objc_msgSend.
Hooking all objc_msgSend methods (based on HookZz). This only support arm64 under debugger ( lldb).
Sample app is sample/TraceAllMsgDemo.
Using any kinds of method, copy <app's sandbox>/Library/appletracedata out of Simulator/RealDevice.
Merge/Preprocess the appletracedata.
python merge.py -d <appletracedata directory>
This will produce trace.json in appletracedata directory.
Generate trace.html using catapult.
python catapult/tracing/bin/trace2html appletracedata/trace.json --output=appletracedata/trace.html

open trace.html
trace.html only support Chrome
Open sampledata/trace.html using Chrome.
- dtrace as data source.
- Gitter
- 微信群(若过期请先加微信 everettjf)


