The plprofiler is an extension for the PostgreSQL database system to create performance profiles of PL/pgSQL functions and stored procedures. The included external Python class and command line utility can be used to easily control the extension, run arbitrary SQL commands (invoking PL/pgSQL functions), save and manage the resulting performance datasets and create HTML reports from them.
- Overview
- Installation
- Examples
- The example test case
- General command syntax
- Executing SQL using the plprofiler utility
- Analyzing the first profile
- Capturing profiling data by instrumenting the application
- Collecting statistics at a timed interval
- Collecting statistics via ALTER USER
- Profiling a live production system
- Fixing the performance problem
- plprofiler command reference
Finding performance problems within PL/pgSQL functions and stored procedures can be difficult, especially when the code is nested. This is because PL/pgSQL creates a cloak over whatever is happening inside. The only thing visible in system or extension views, such as pg_stat_activity or pg_stat_statements is the query, sent from the client. In the case of invoking a stored procedure, that is just the outermost stored procedure call.
The plprofiler extension can be used to quickly identify the most time consuming functions and then drill down to find the individual statements within them.
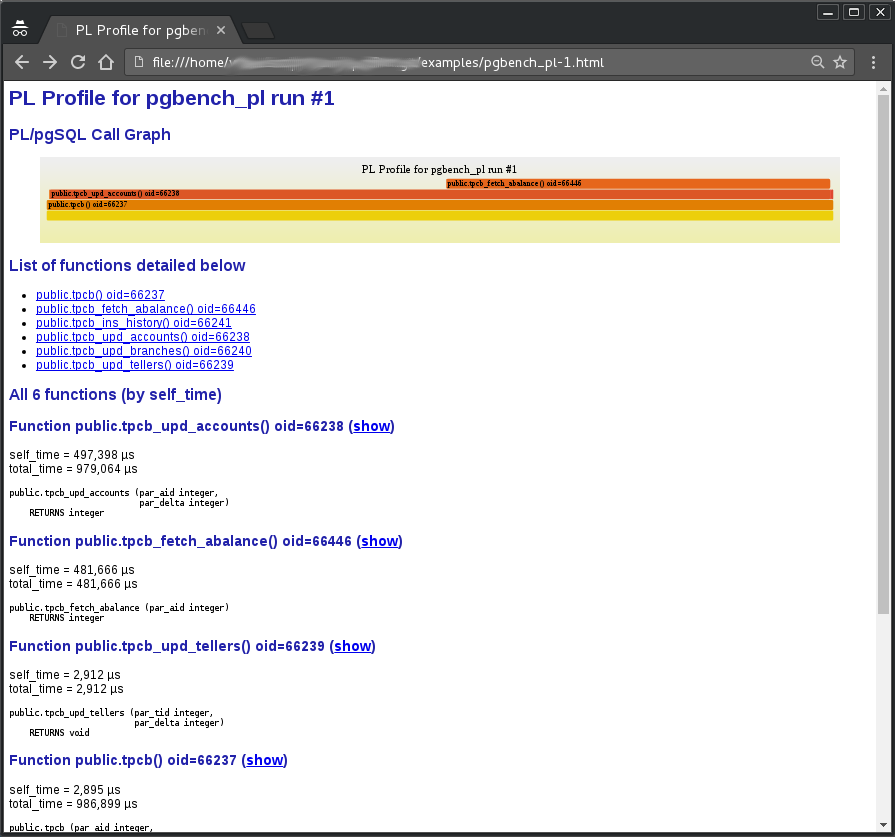
The output, generated by the plprofiler, is a self-contained HTML document. The document starts with a FlameGraph at the top, followed by details about functions in the profile. Unlike usual CPU FlameGraphs, the plprofiler FlameGraph is based on the actual Wall-Clock time, spent in the PL/pgSQL functions. By default, the top ten functions, based on their self_time (total_time - children_time), are detailed. This can be overridden by the user.
Click on the screenshot below to see the actual, interactive report in your browser.
Please see the Examples for more details about this interactive report.
Credits for the FlameGraph go to Brendan Gregg. His flamegraph.pl script is used by the plprofiler utility to generate these incredibly powerful, interactive SVGs.
#####Major Change History
- 2012 - Removed from PostgreSQL plDebugger Extension
- 2015 - Resurrected as standalone plProfiler by OpenSCG
- 2016 - Rewritten as v2 to use shared hash tables, have lower overhead
- 2016 - v3 Major performance improvements, flame graph UI
- 2019 - v3.5 Placed all extension objects under role plprofiler for easier grant
