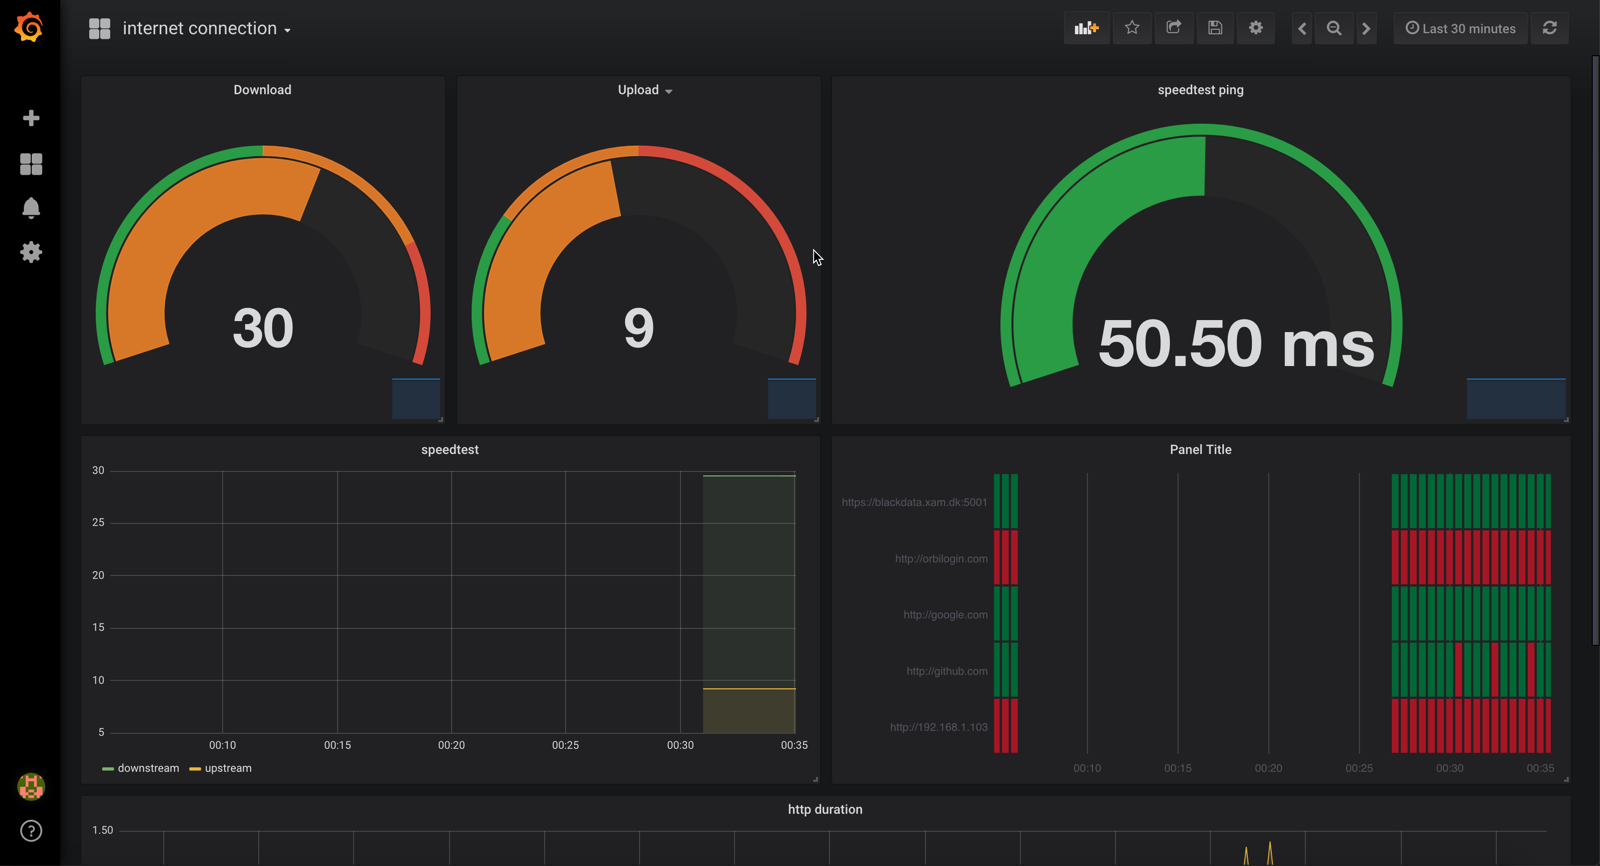
A Docker stack for monitoring network performance
This project offers a quick way (docker-compose) to stand-up a network performance monitoring solution using the following:
docker-compose
- Clone this repo
- Change directory to the cloned repo in a terminal
- Run
docker-compose up -d - Open a browser at http://localhost:3030 (or more directly, http://localhost:3030/d/o9mIe_Aik/internet-connection)
- username -
admin - password -
wonka(Password is stored in theconfig.monitoringenv file)
- username -
To change what hosts you ping you change the targets section in /prometheus/pinghosts.yaml file.
For speedtest the only relevant configuration is how often you want the check to happen. It is at 5 minutes by default which might be too much if you have limit on downloads. This is changed by editing scrape_interval under speedtest in /prometheus/prometheus.yml.
Any configuration changes will have to be following by bringing down the stack, and then bringing it back up:
$ docker-compose down
$ docker-compose up -d
- http://localhost:9090/targets - shows status of monitored targets as seen from prometheus - in this case which hosts being pinged and speedtest. note: speedtest will take a while before it shows as UP as it takes ~30s to respond.
- http://localhost:9090/graph?g0.expr=probe_http_status_code&g0.tab=1 - shows prometheus value for
probe_http_status_codefor each host. You can edit/play with additional values. Useful to check everything is okey in prometheus (in case Grafana is not showing the data you expect). - http://localhost:9115 - blackbox exporter endpoint. Lets you see what have failed/succeded.
- http://localhost:9696/metrics - speedtest exporter endpoint. Does take ~30 seconds to show its result as it runs an actual speedtest when requested.
