Flexible Monte Carlo simulator for personal finance with PDF output of charts and tables.
It's hard to make predictions - especially about the future. - Yogi Berra
A major financial goal that many people have is being able to afford to retire, broadly defined as being able to stop working and not run out of money before death. An easier goal is to be able to afford to work in an area you are passionate about but that might pay less. Another, related but more difficult goal to achieve is what I call 'Financial Escape Velocity', or being able to increase your net worth through passive and investment income. Those who achieve FEV will generally have their net worth increase with age.

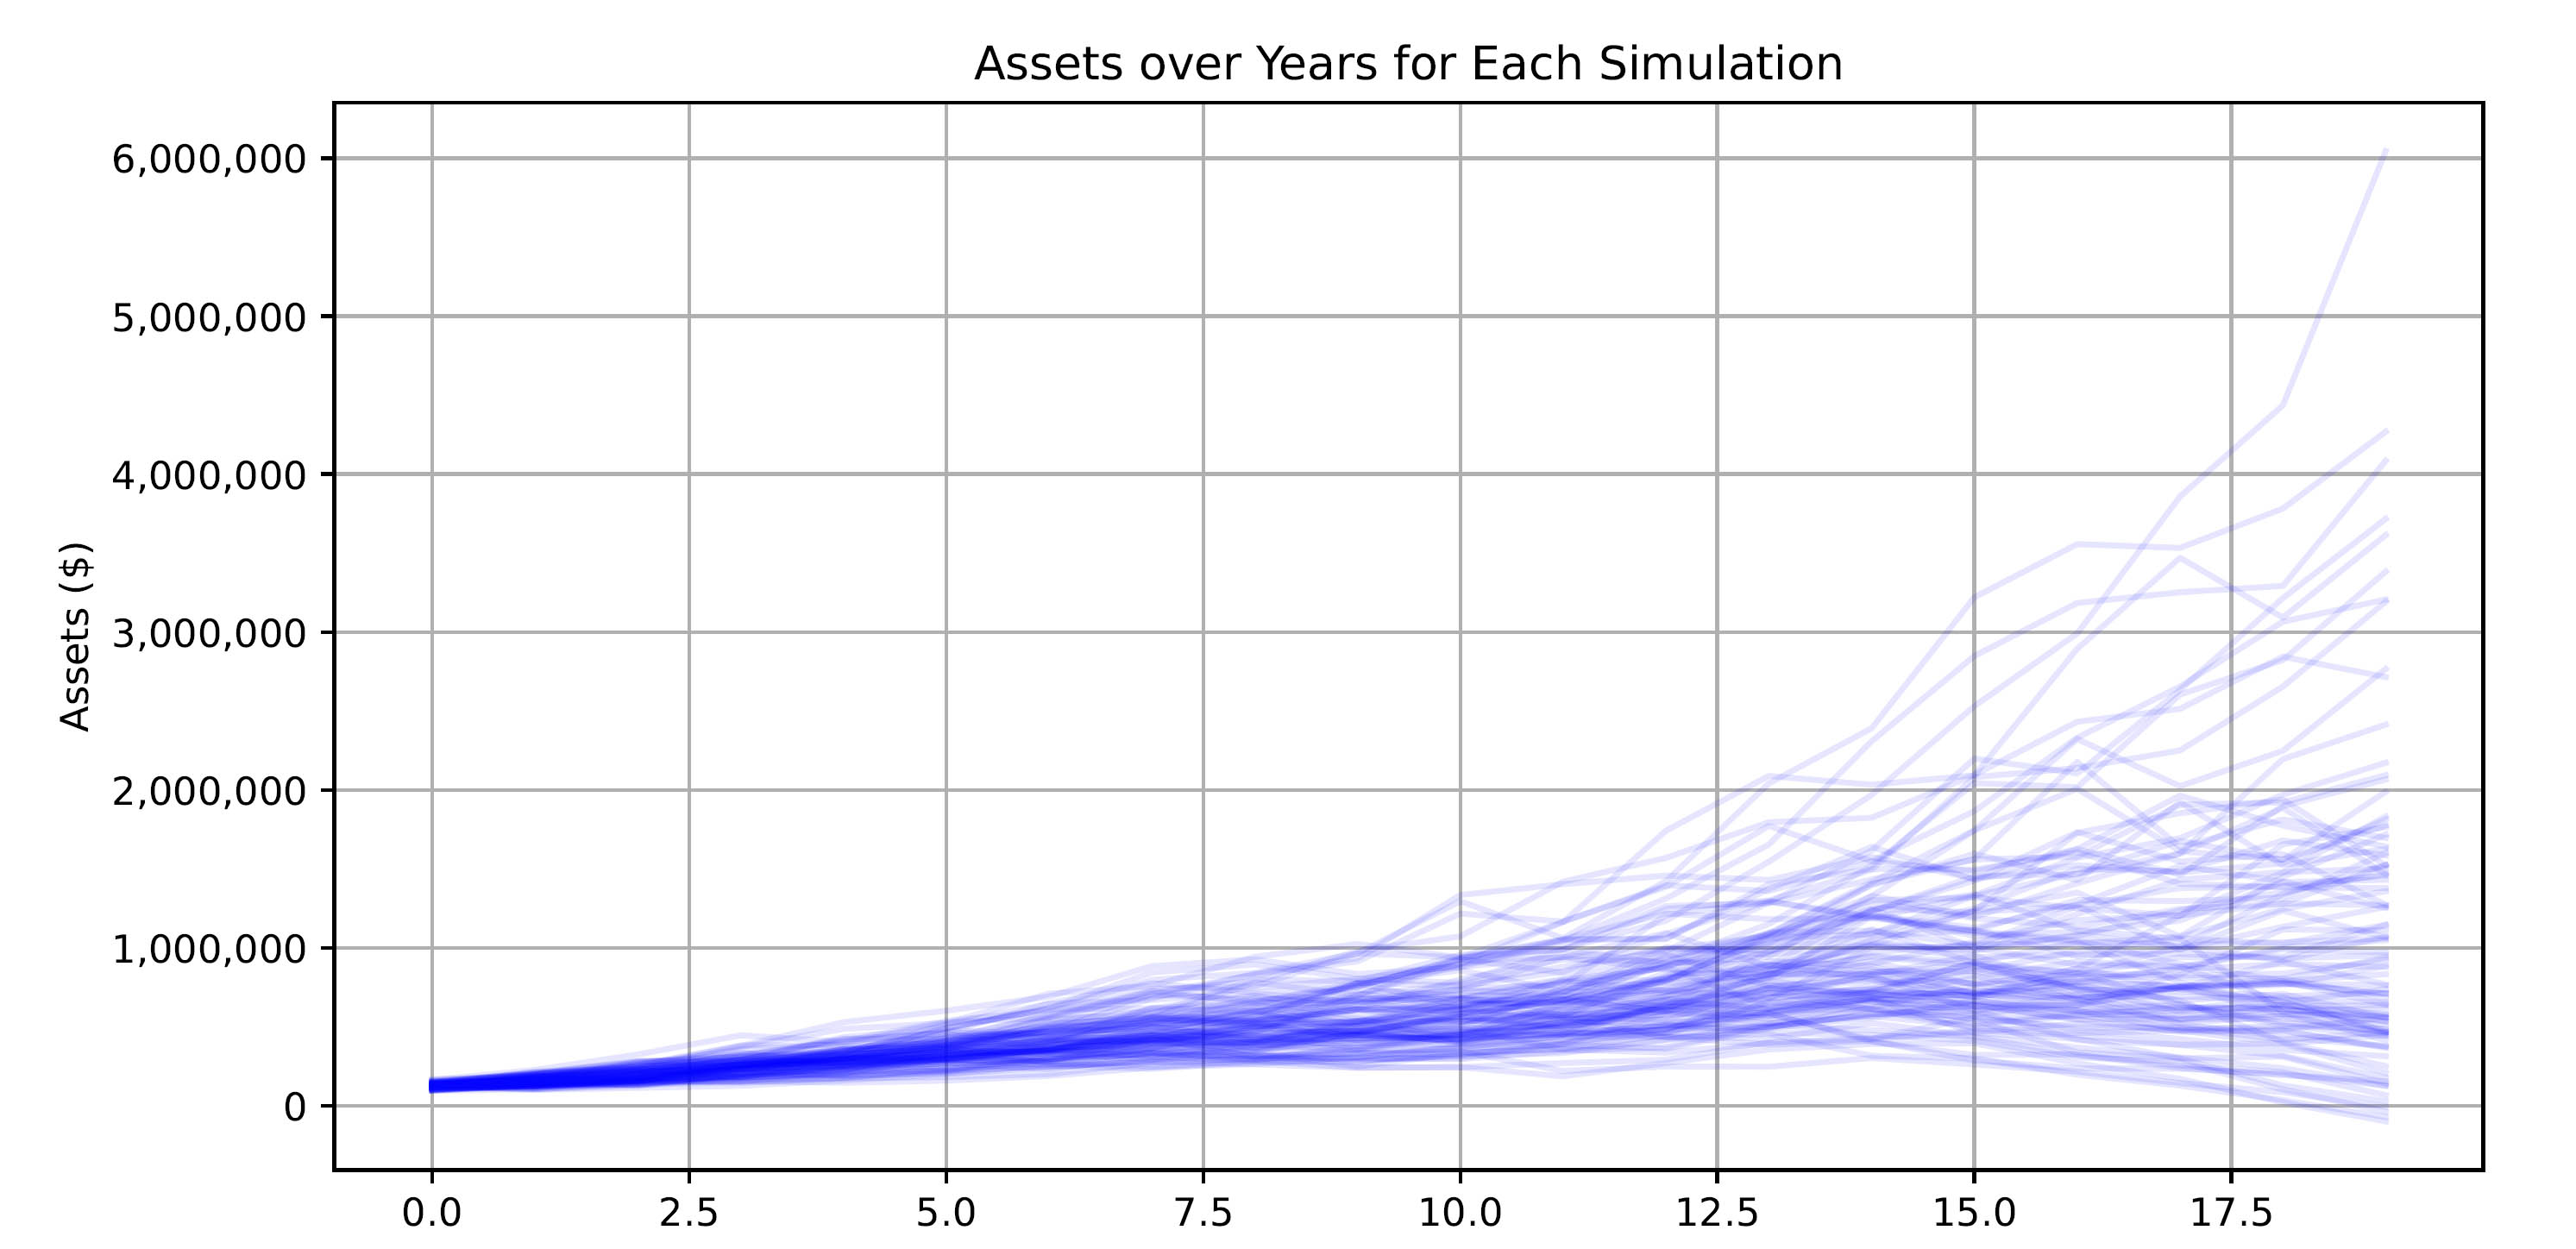
Sample of 100 different financial path trajectories. Note that best and worst case scenarious diverge more as time goes on
If no one ever had any unexpected expenses, and you could predict the return of every asset class perfectly, then personal finance would be easy because there would be one 'right' or 'best' answer. However, in the real world there is a lot of uncertainty. This program models this using a 'Monte Carlo' approach - basically running many random simulations and doing statistics on the result.
Most people would vary the input parameters and run multiple simulations. This could help you answer questions like:
- How many years will you need to work?
- How sensitive is your situation to unexpected expenses?
- How will refinancing your mortgage today affect your future 10 years from now?
- How much you will be able to afford to contribute to children's college expenses in 12 years?
- How will your situation change with 3% vs 5% inflation?
Edit the values in inputs.csv before running the simulation. Here is the meaning of each column:
| Item | Description |
|---|---|
| Random Seed | Change this value if you want to run the simulation again with the same parameters. |
| Years | The number of years you want to simulate. |
| Simulations | How many times to simulate. |
More simulations takes more computing time. 100 is instant on a modern computer.
| Item | Description |
|---|---|
| Investable Assets | The dollar amount of assets you start with. |
| Expected Return Mean | The average return your assets will achieve per year. |
| Expected Return SD | The volatility of your return. |
| Tax Rate | The percent that you will pay in taxes. |
The default uses the return mean and standard deviation of the SP500. If you have a blend of different assets, use weighted average here. This should not include assets such as a primary residence, but could include appreciation of rental properties.
Taxes - Taxes are paid only as necessary. For instance, if your active income from working (after tax) + passive income (after tax) is higher than your expenses for the year, no assets will be sold and you will pay no tax. Otherwise, assets will be sold. For example, if you earned $50,000, but spent $60,000, you will need to sell $11,764 of assets, which will include $10,000 to cover the shortfall and $1,764 in taxes (at 15% rate).
| Item | Description |
|---|---|
| Expected Expenses Mean | How much you plan to spend each year. |
| Expected Expenses SD | Volatility of your expenses. |
| Inflation | How much things will increase in price each year. |
| Unexpected Expense Amount | How much you would have to cover. |
| Unexpected Expense Chance | Chance unexpected expense happens. |
Everyone will have that one medical bill, broken [thing], need to help family, etc. The default values assume a 15% chance of a $10,000 expense each year.
| Item | Description |
|---|---|
| Additional Passive Income | Amount per year after tax. |
| Passive Income Growth Rate | Percent per year. Could be negative. |
| Active Income | Amount per year you earn for working after tax. |
| Active Income Growth Rate | Percent per year. |
| Years To Work | How many years you will earn active income. |
Passive Income could include things like Social Security, Pensions, Rental Property Income, etc. The Depletion Threshold is the point where you would consider yourself 'out of money'.
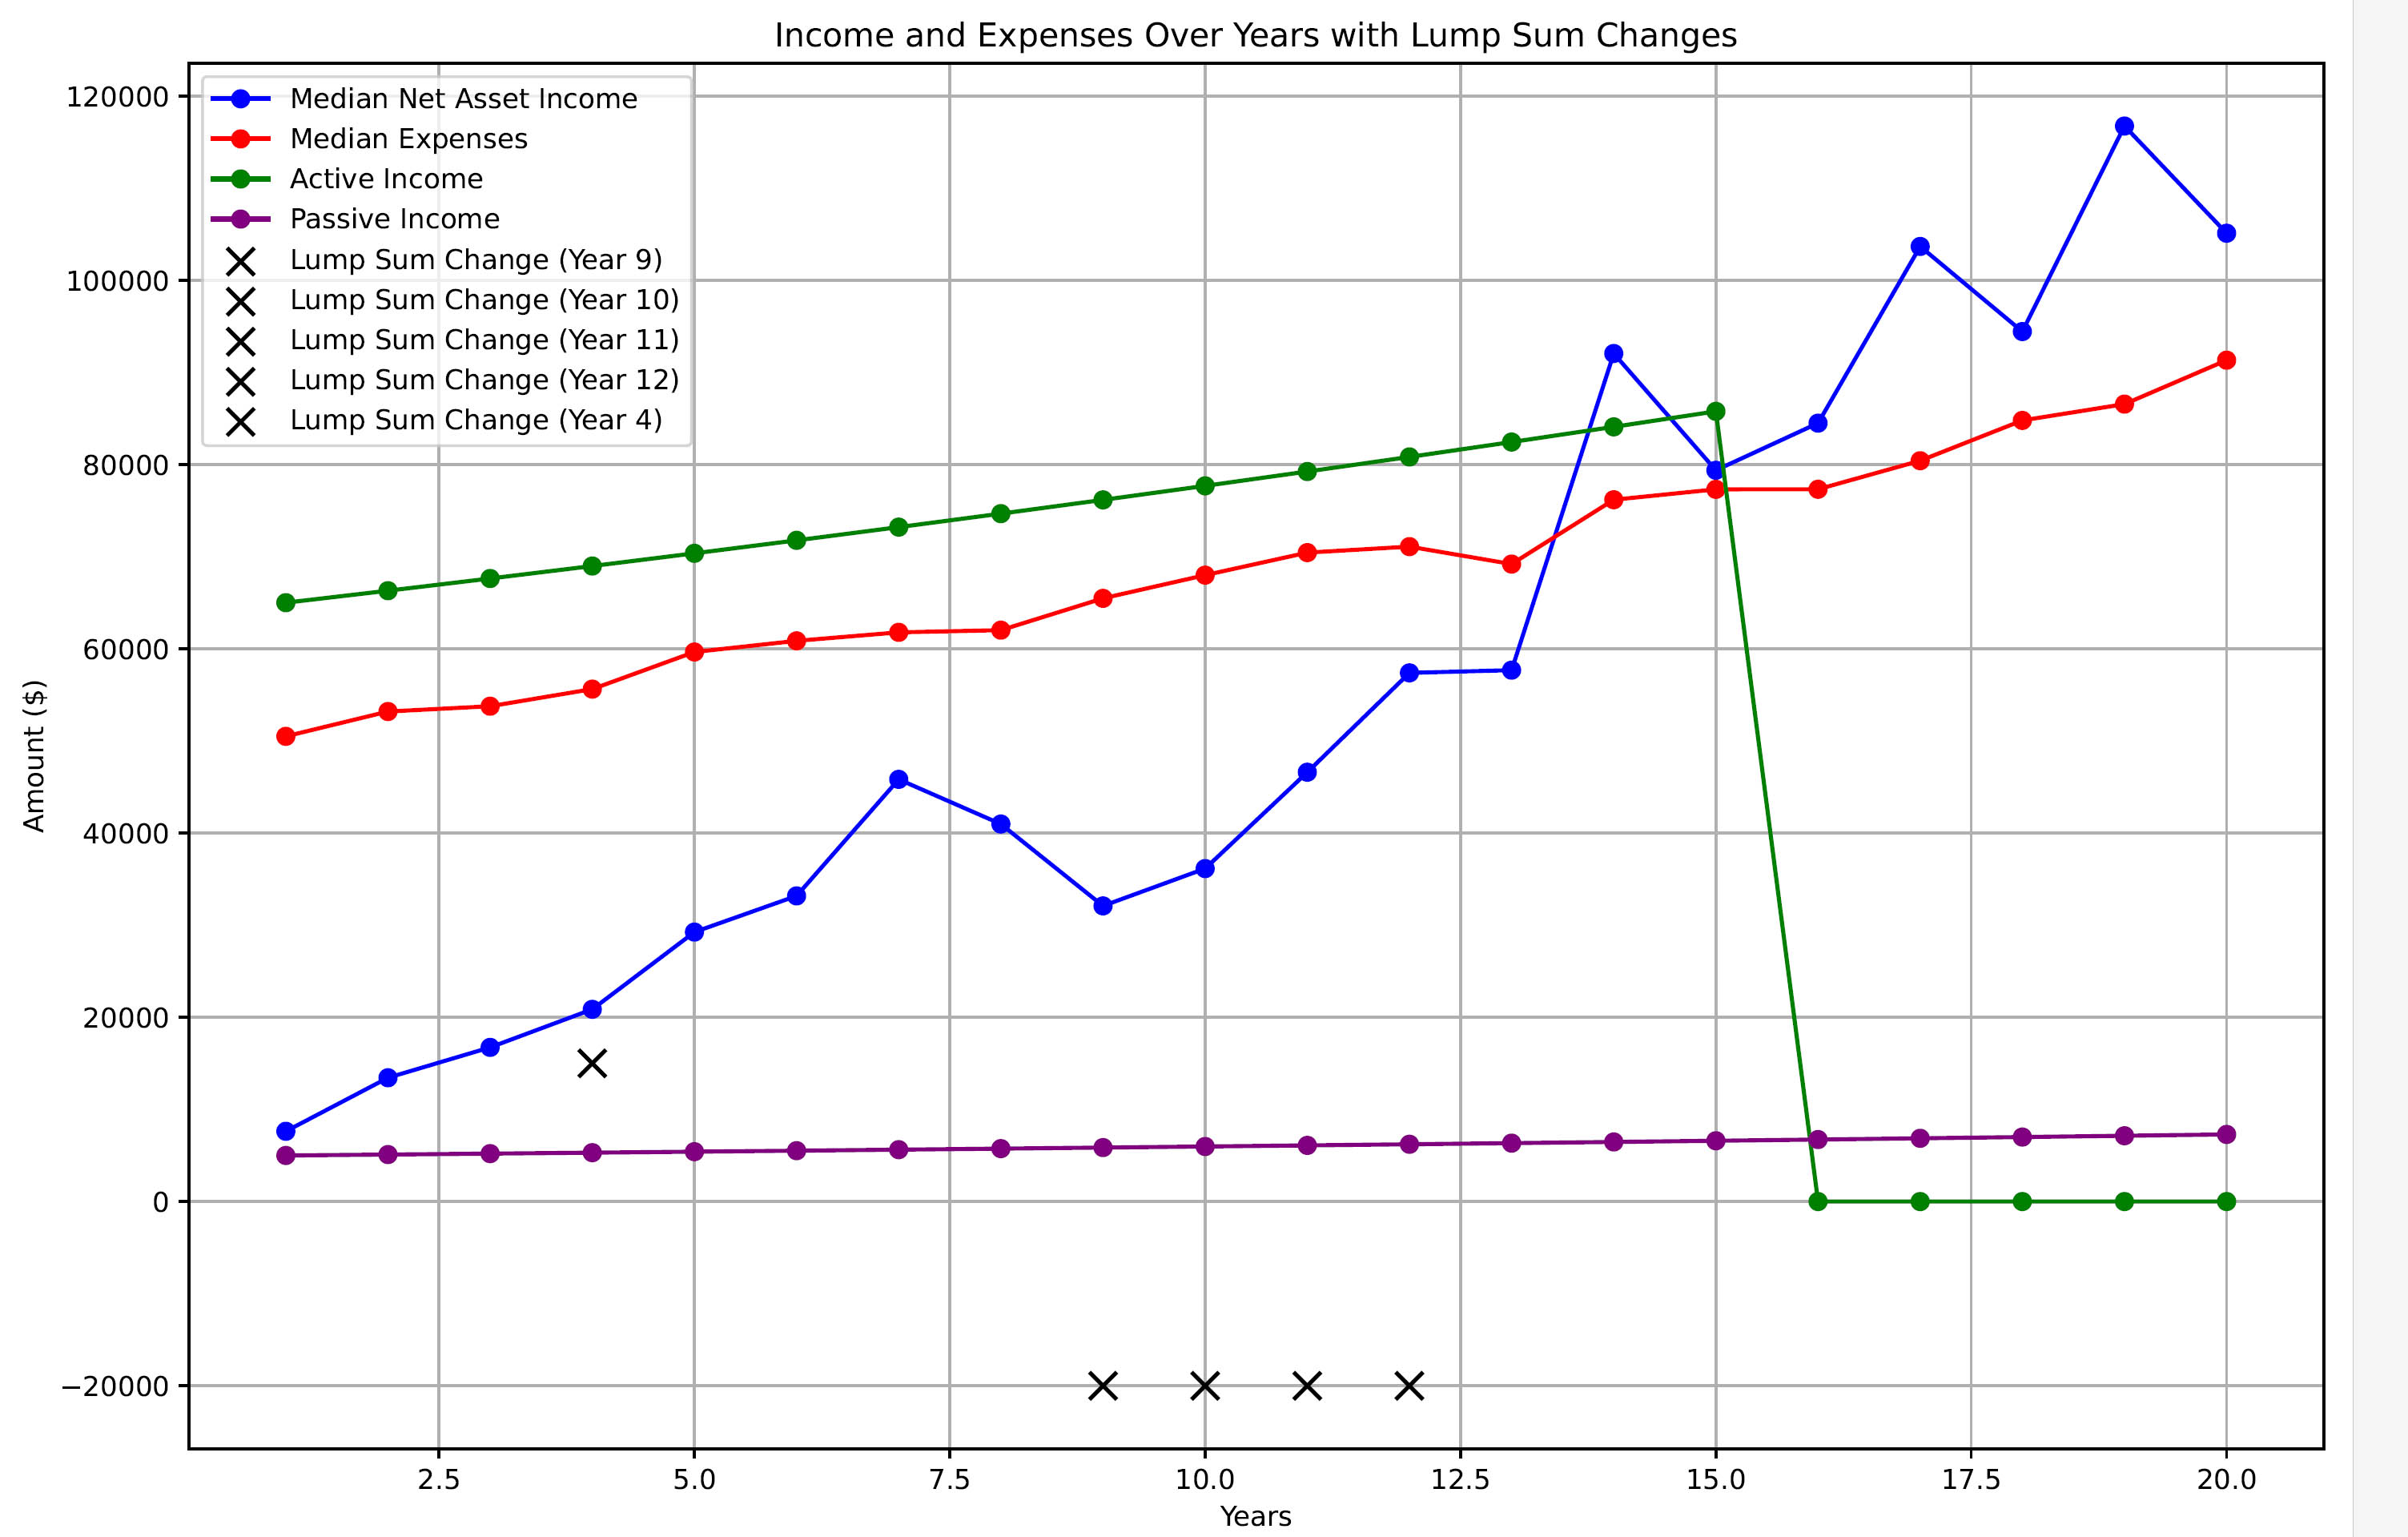
You can also edit the file lump_sums.csv if you would like to include lump sums in your calculations. Negative numbers indicate expenses. In the example, the user will pay $20,000 for college in years 9-12. Positive numbers indicate income - in our example the user will receive a $15,000 insurance settlement in year 4. Each year should have only the net amount.
If you have python installed locally, simply install the dependencies (once) and run the file (each time).
pip install matplotlib numpy pandas
python simulation.py
otherwise, simply click on simulation.exe (Windows Users).
In either case, make sure inputs.csv and lump_sums.csv are in the directory.
A pdf file will be generated in the same directory containing graphs and tables

The key insights table shows the chance of various scenarios. In this case, there is a 4% chance of running out of money entirely, and a
53% chance of achieving Financial Escape Velocity.
For the purpose of this simulation, Financial Escape Velocity is defined as once you started earning more from passive income and investments than your expenses, if that continued on average through the rest of the simulation. So, one bad year wouldn't knock you out as long as other years made up for it. Out of all the simulations that achieved this, the median first year is also reported.

Median values of several key parameters throughout the years

Same information as above but in chart form

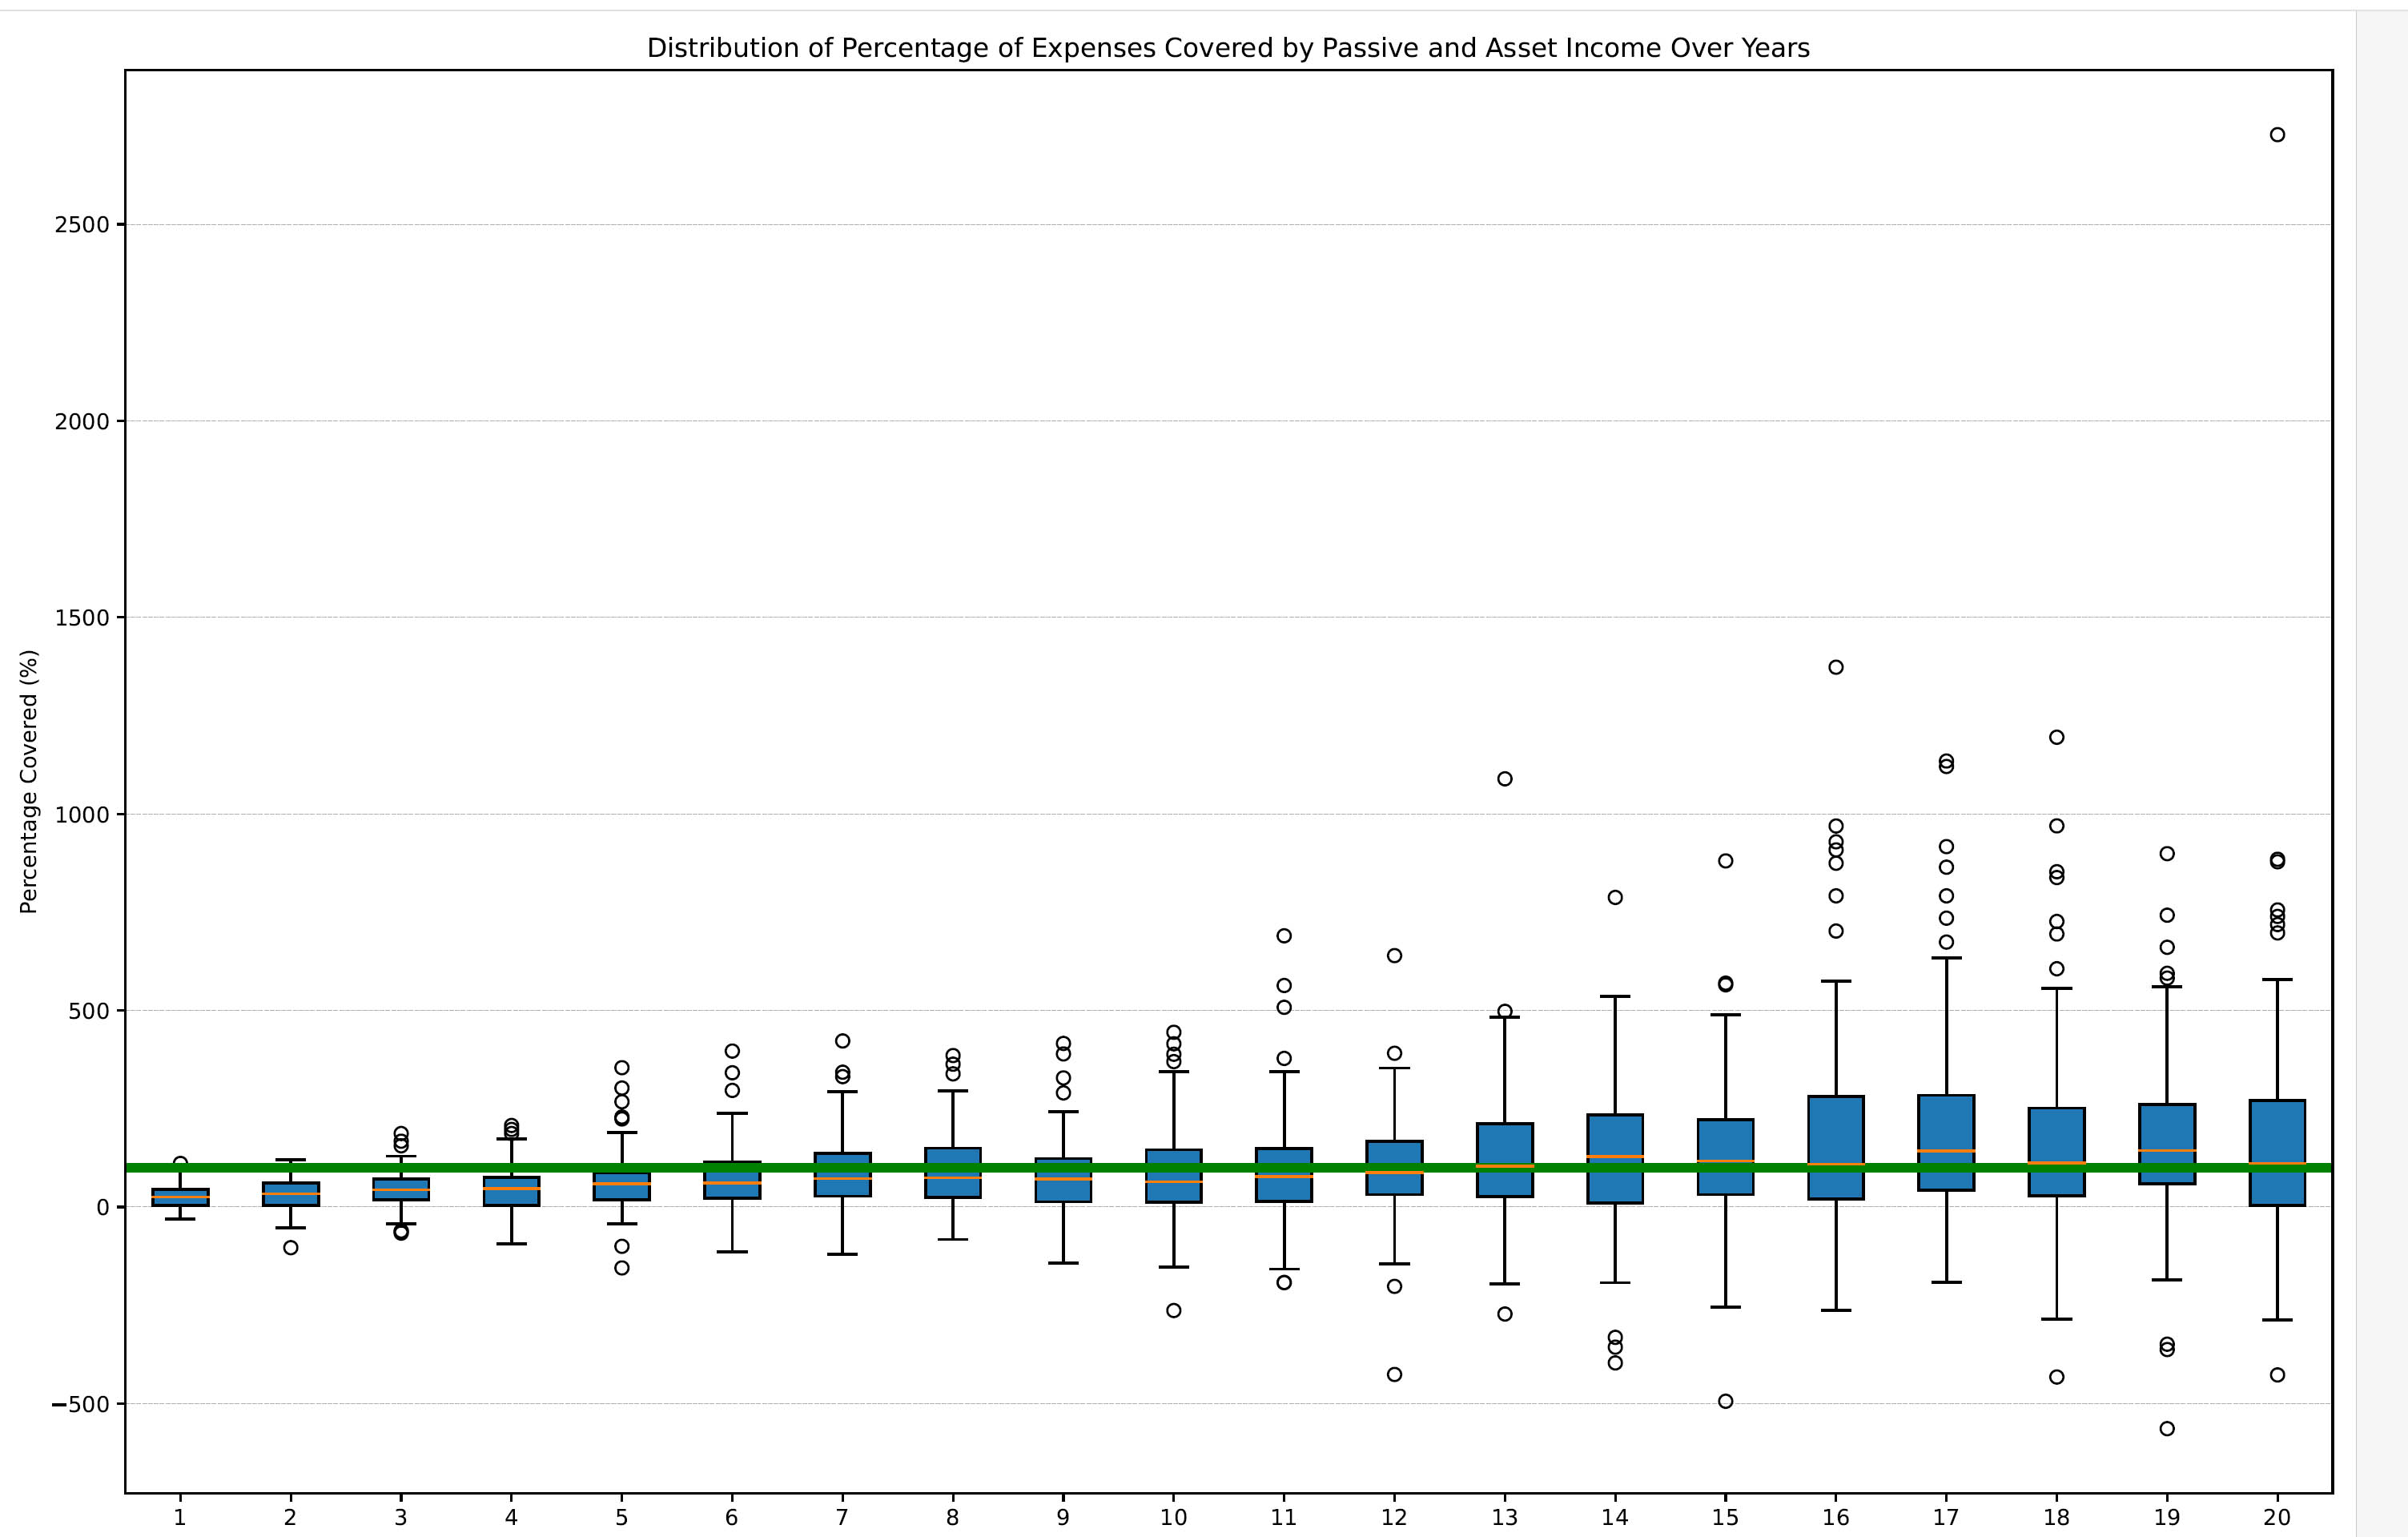
Percentage of expenses covered by income not from working
The green line represents covering 100% of your expenses without working. Being above the green line is considered achieving 'Financial Escape Velocity.' 50% of the values fall within the box plot
Made with help from GPT Code Intrepreter.