- Introduction
- transition_reveal()
- transition_states()
- transition_time() and shadow_wake()
- transition_states() and shadow_wake()
- transition_time() and shadow_mark()
- transition_layers()
-
This set of gganimate examples are adapted from the excellent slides tweeted here: https://twitter.com/mitchoharawild/status/1108913366100119553?s=12
-
You can view the slides here: https://mitchelloharawild.com/wombat-gganimate/#1
-
Code for the slides is here: https://github.com/numbats/gganimate-workshop
-
To help me understand intuitively how gganimate works with ggplot, I’ve re-created most of the examples from the slides below. First as a static ggplot plot, then as the gganimate version.
-
To make it clear which package each function comes from I have added ggnaimte:: or ggplot2:: before each function.
-
I’ve found the gganimate reference describes all its functions very clearly: https://gganimate.com/reference/index.html
library(ggplot2)
library(gganimate)
library(transformr) # devtools::install_github("thomasp85/transformr")
library(magick)
library(gifski)
library(png)
library(datasauRus)
library(gapminder)
library(kableExtra)

kable_table <- function(table, title) {
  kableExtra::kable(table, caption = title) %>%
    kable_styling(latex_options = "hold_position", full_width = F, bootstrap_options = c("striped", "condensed"), position = "left")
}Adapting this example: https://mitchelloharawild.com/wombat-gganimate/#37
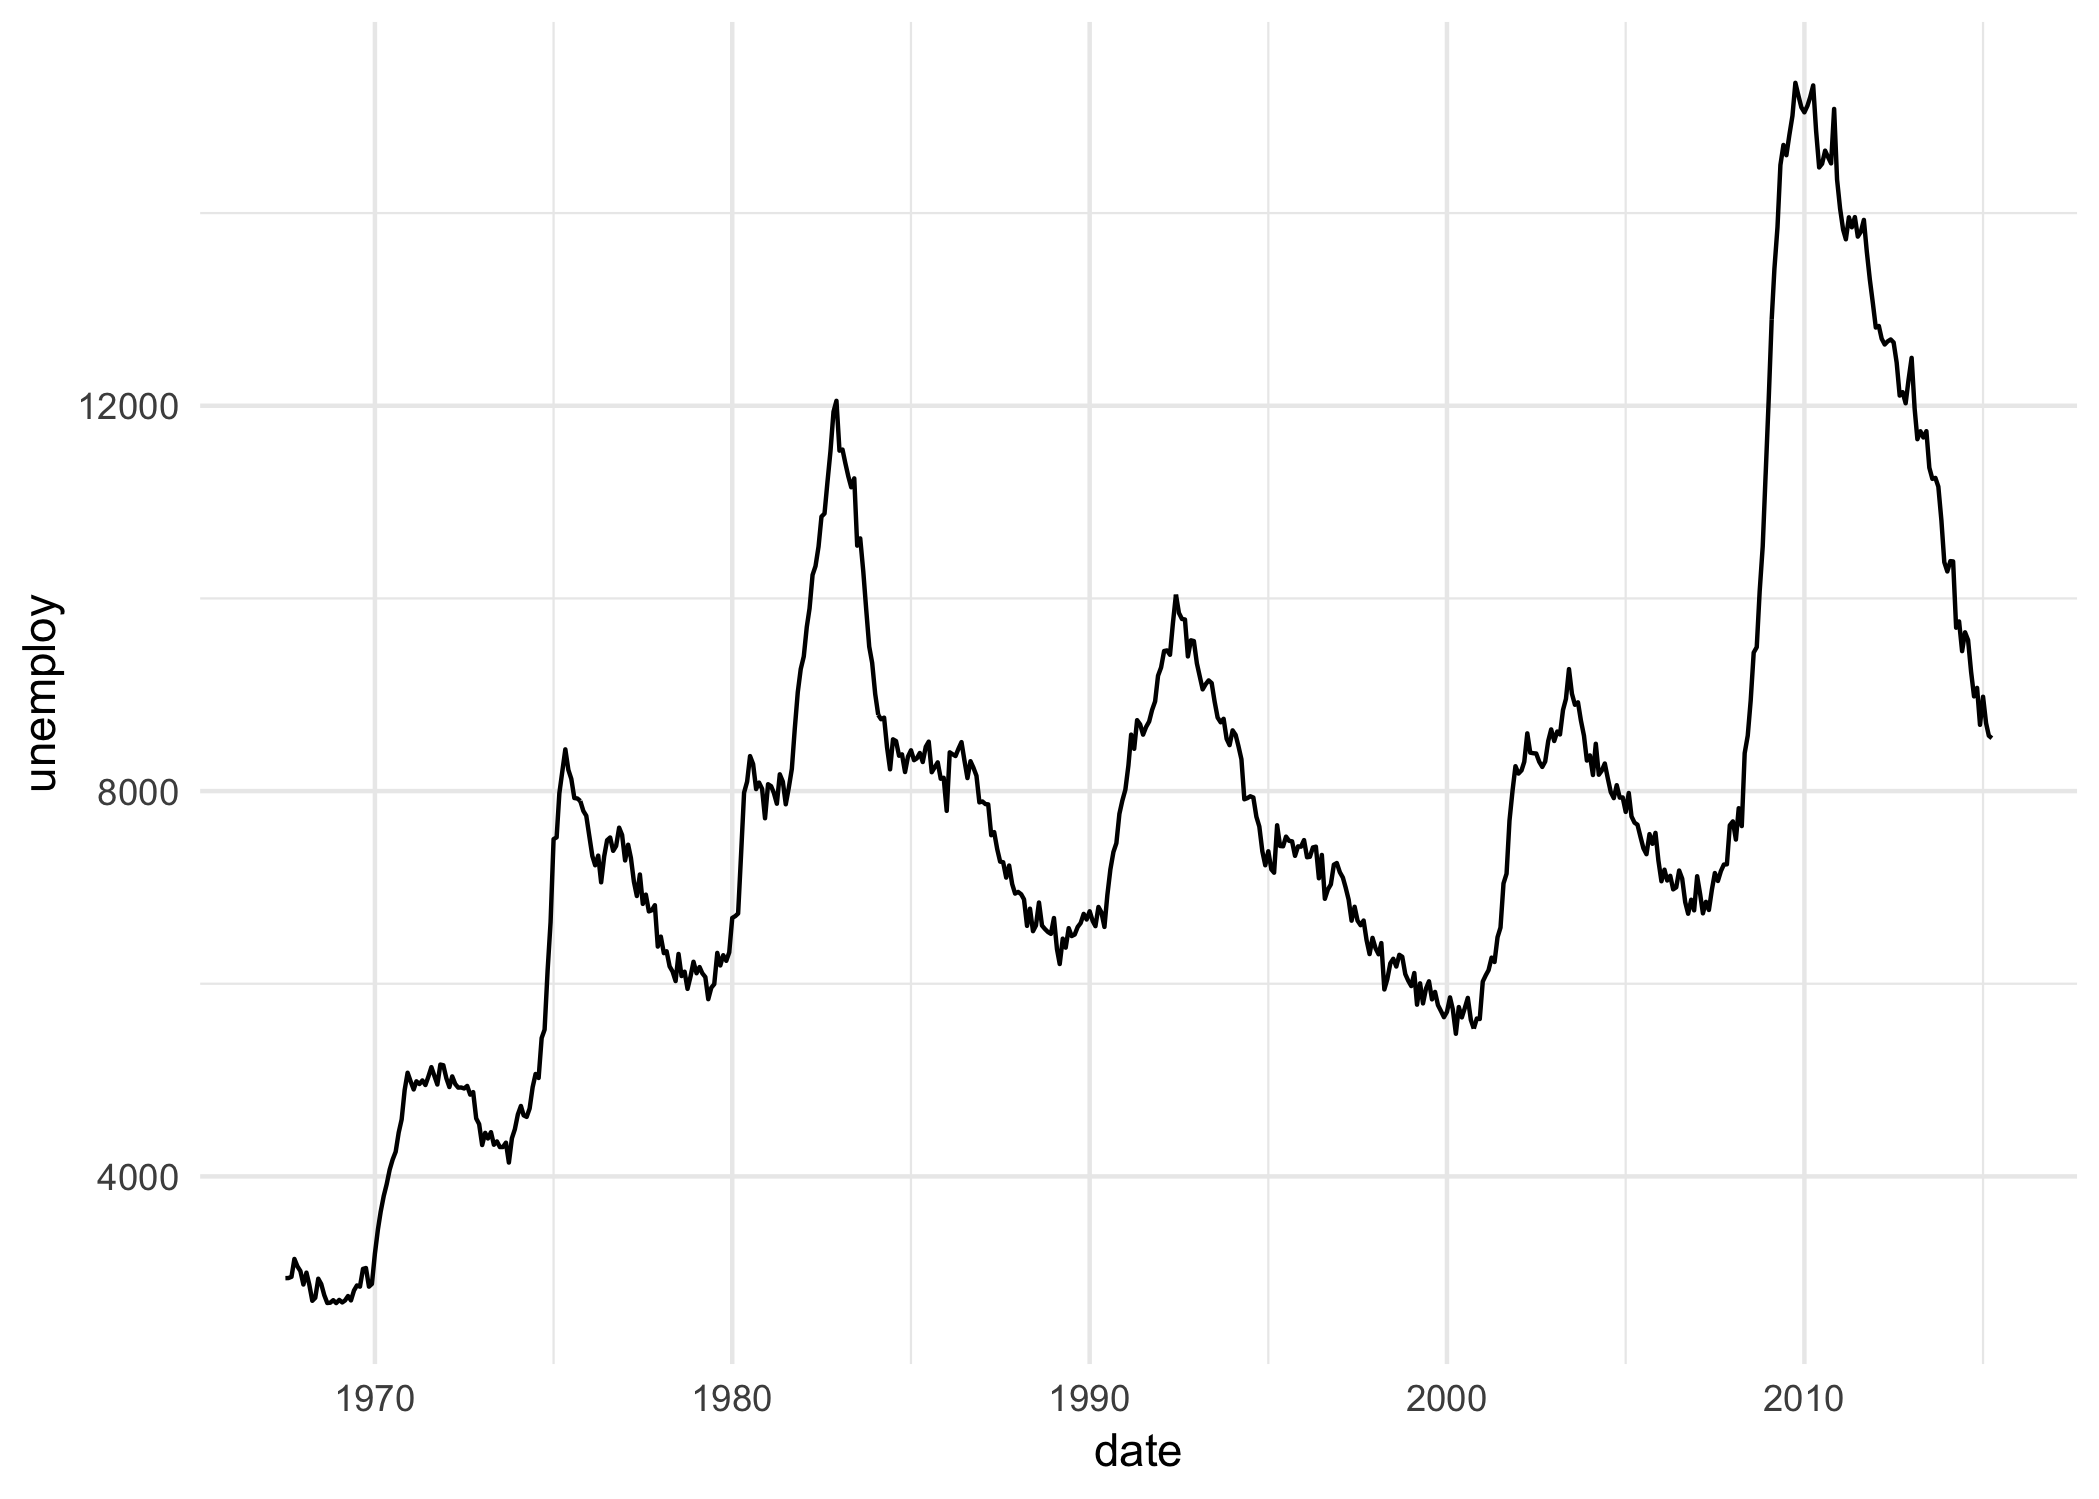
kable_table(head(economics), "Top few rows of ggplot2::economics data in plots below")Top few rows of ggplot2::economics data in plots below
|
date |
pce |
pop |
psavert |
uempmed |
unemploy |
|---|---|---|---|---|---|
|
1967-07-01 |
506.7 |
198712 |
12.6 |
4.5 |
2944 |
|
1967-08-01 |
509.8 |
198911 |
12.6 |
4.7 |
2945 |
|
1967-09-01 |
515.6 |
199113 |
11.9 |
4.6 |
2958 |
|
1967-10-01 |
512.2 |
199311 |
12.9 |
4.9 |
3143 |
|
1967-11-01 |
517.4 |
199498 |
12.8 |
4.7 |
3066 |
|
1967-12-01 |
525.1 |
199657 |
11.8 |
4.8 |
3018 |
Static ggplot plot
p <-
  ggplot2::ggplot(data = ggplot2::economics) +
  ggplot2::aes(x = date, y = unemploy) +
  ggplot2::geom_line() +
  ggplot2::theme_minimal()
ggplot2::ggsave(filename = "./images/economics.png", plot = p)
knitr::include_graphics("images/economics.png")
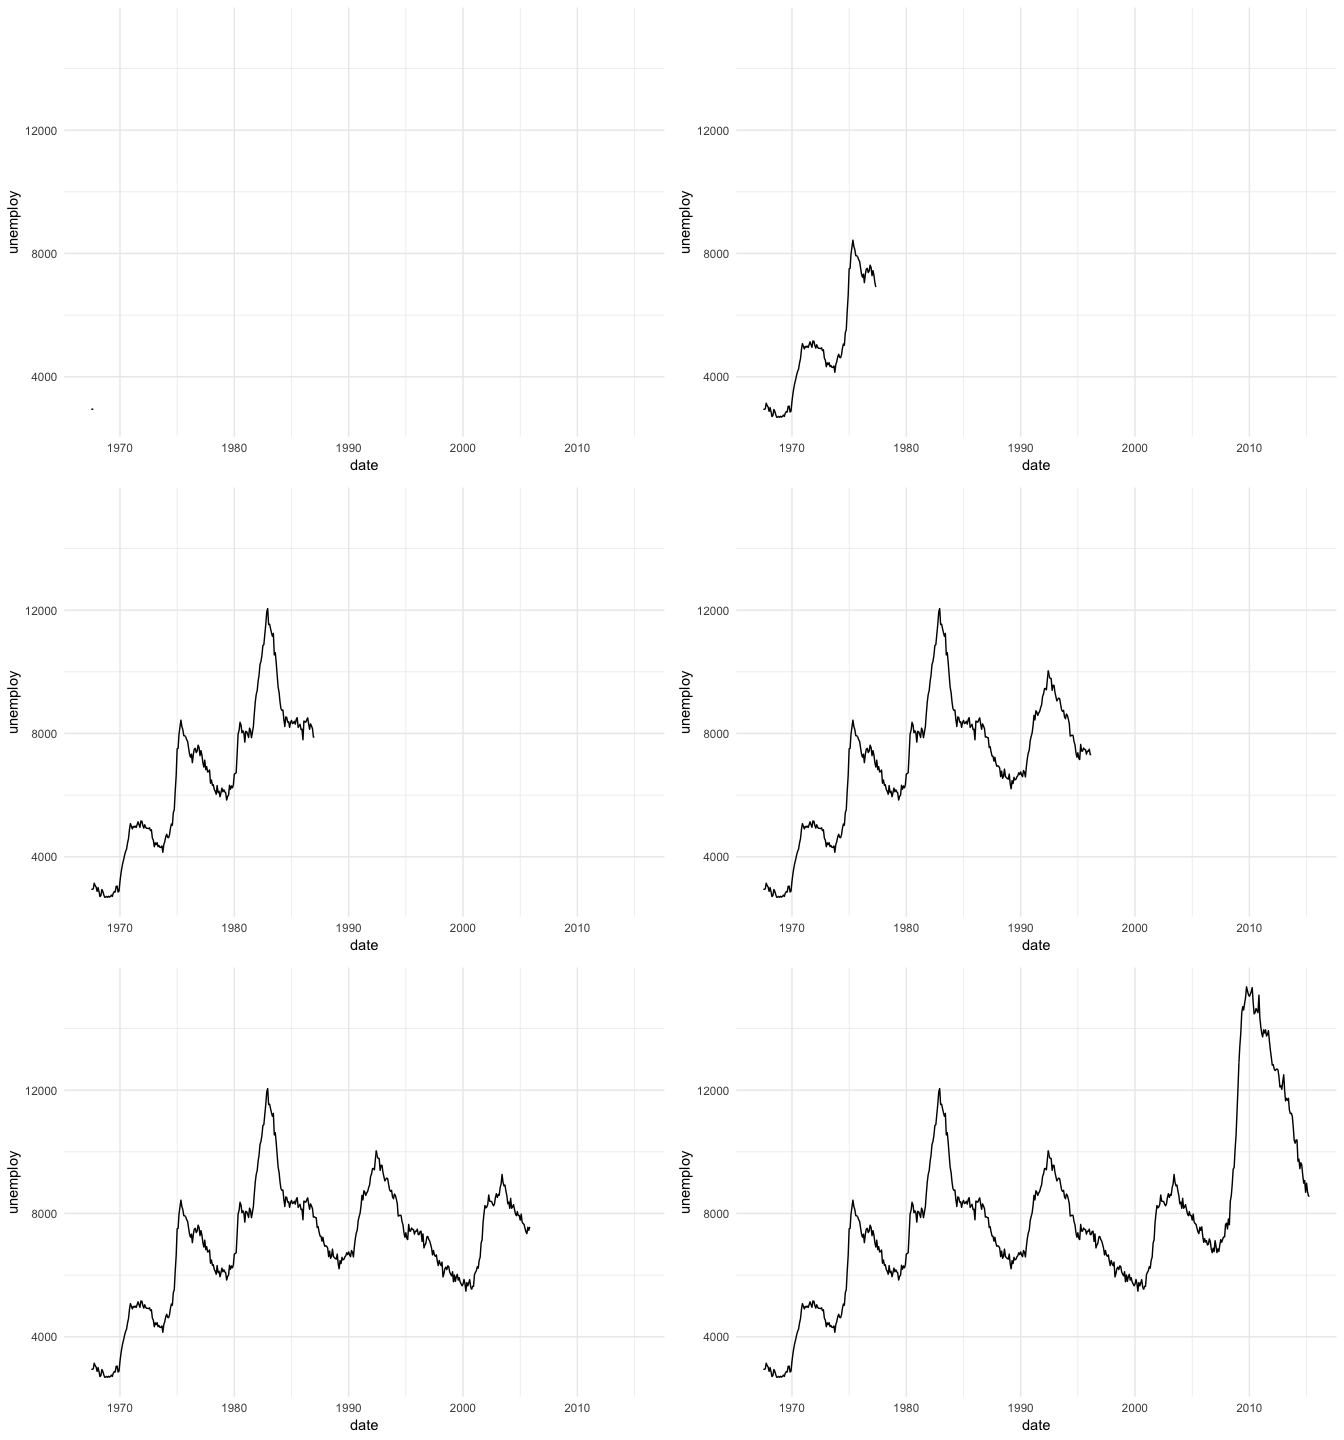
Animated ggnanimate plot
p + gganimate::transition_reveal(along = date)
print(p)gganimate::anim_save(filename = "./images/economics.gif")This example: https://mitchelloharawild.com/wombat-gganimate/#42
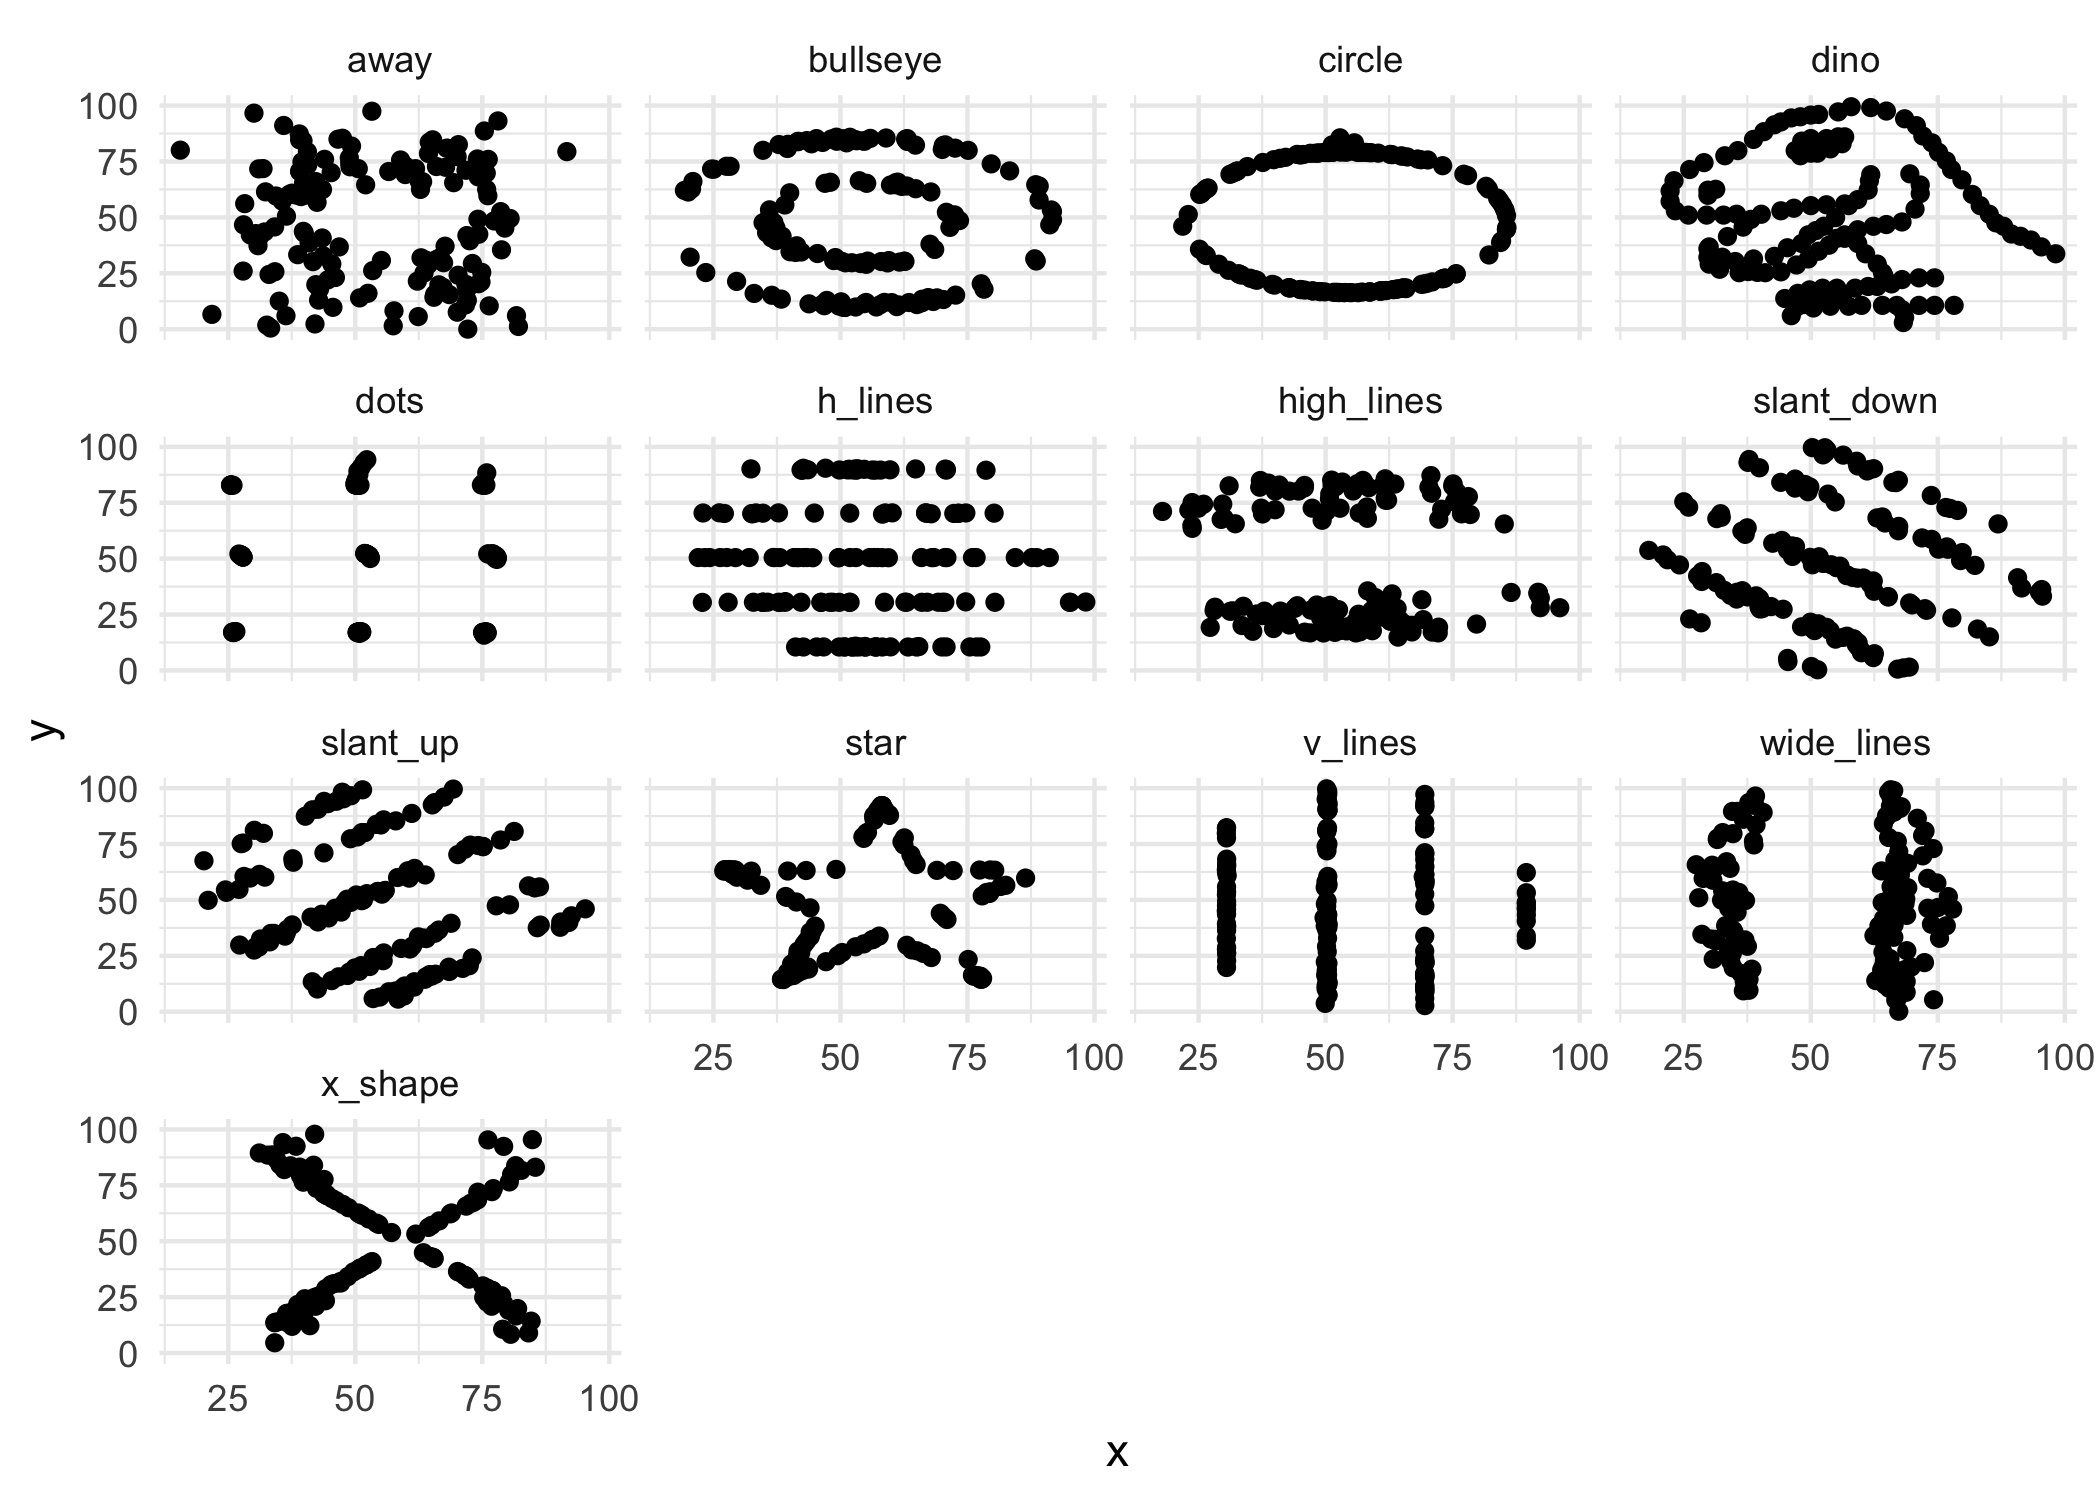
kable_table(head(datasauRus::datasaurus_dozen), "Top few rows of datasauRus::datasaurus_dozen data in 2 plots below")Top few rows of datasauRus::datasaurus_dozen data in 2 plots below
|
dataset |
x |
y |
|---|---|---|
|
dino |
55.3846 |
97.1795 |
|
dino |
51.5385 |
96.0256 |
|
dino |
46.1538 |
94.4872 |
|
dino |
42.8205 |
91.4103 |
|
dino |
40.7692 |
88.3333 |
|
dino |
38.7179 |
84.8718 |
Static ggplot chart
p <-
  ggplot2::ggplot(data = datasauRus::datasaurus_dozen) +
  ggplot2::aes(x = x, y = y) +
  ggplot2::geom_point() +
  ggplot2::facet_wrap(~dataset)  +
  ggplot2::theme_minimal()
ggplot2::ggsave(filename = "./images/datasauRus.png", plot = p)
knitr::include_graphics("images/datasauRus.png")
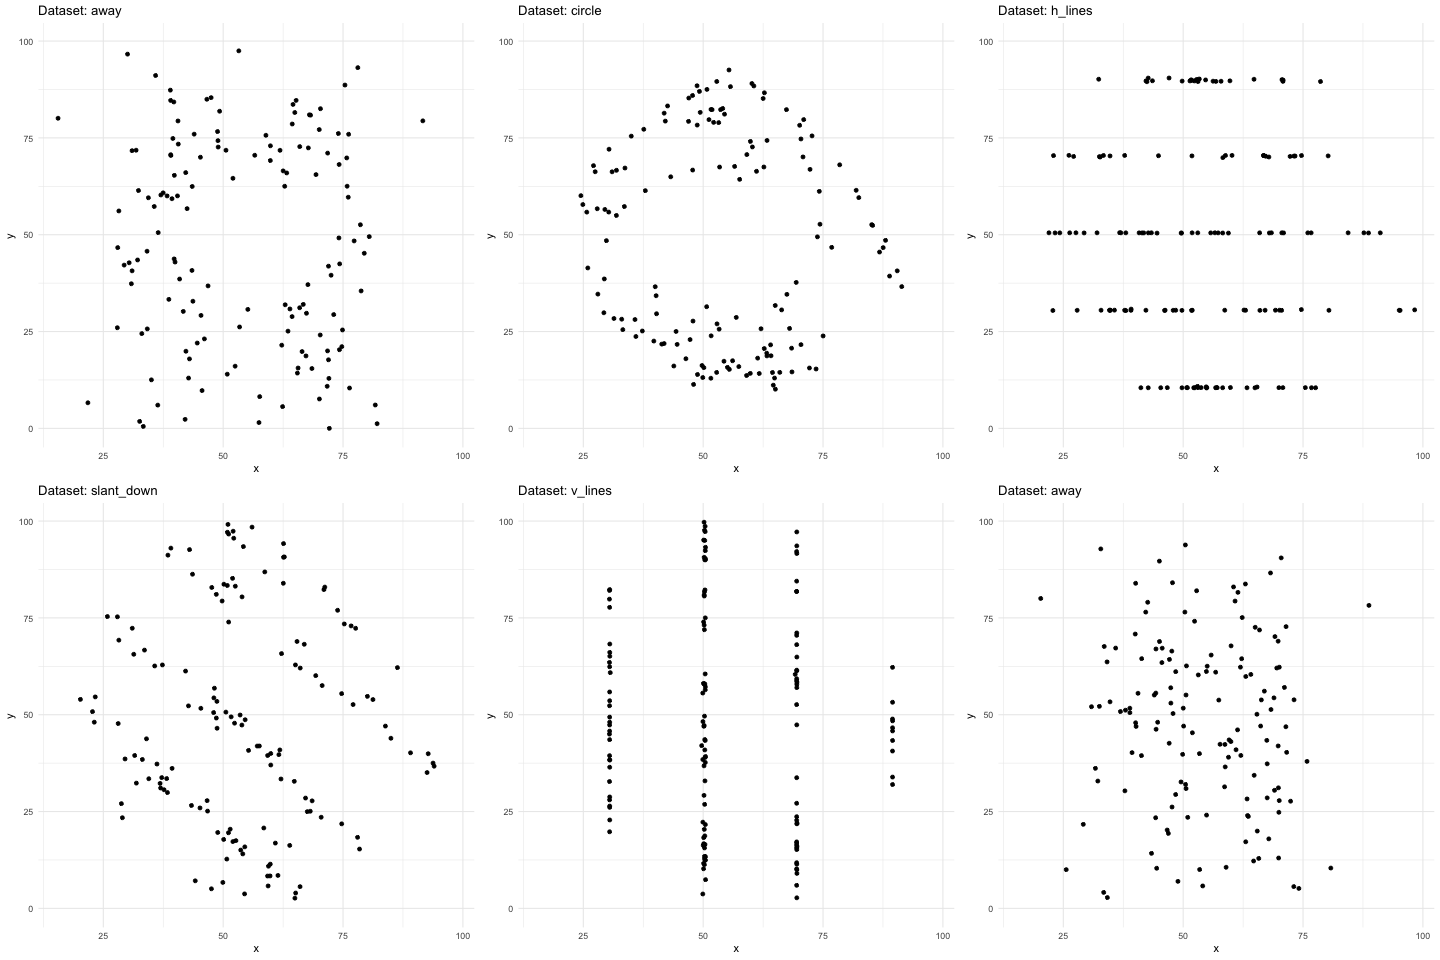
Animated gganimate plot
p <-
  ggplot2::ggplot(data = datasauRus::datasaurus_dozen) +
  ggplot2::aes(x = x, y = y) +
  ggplot2::geom_point() +
  # ggplot2::facet_wrap(~dataset)
  gganimate::transition_states(states = dataset, transition_length = 3, state_length = 1) +
  ggplot2::labs(title = "Dataset: {closest_state}") +
  ggplot2::theme_minimal()
print(p)
gganimate::anim_save(filename = "./images/datasauRus.gif")This example: https://mitchelloharawild.com/wombat-gganimate/#74
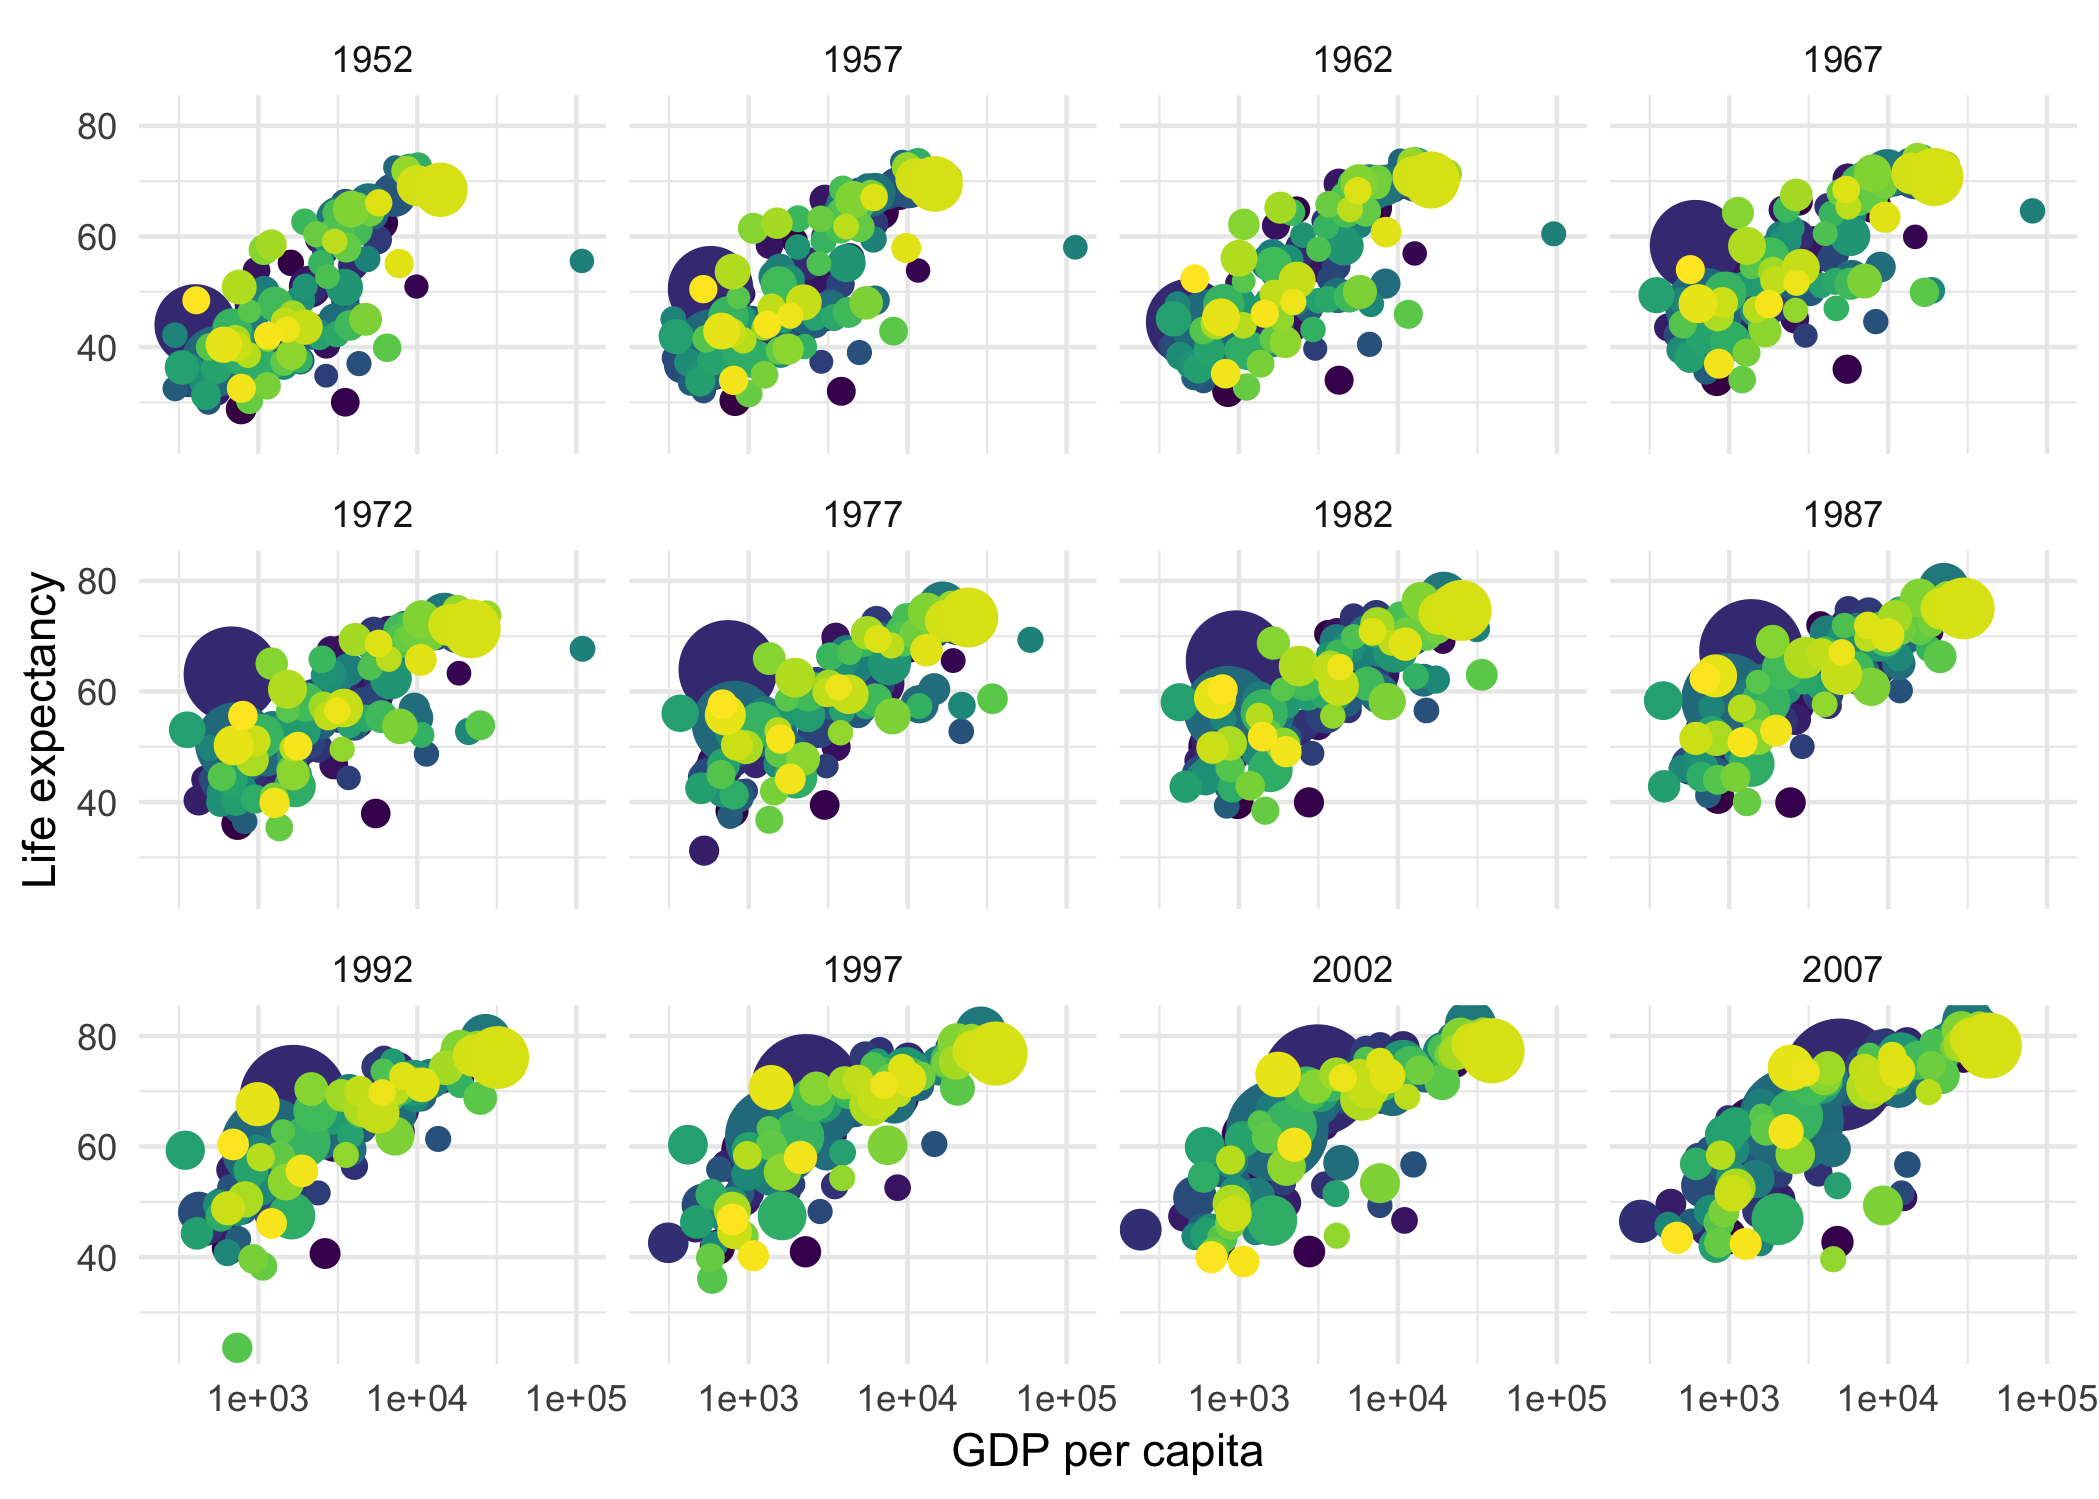
kable_table(head(gapminder::gapminder), "Top few rows of gapminder::gapminder data in 2 plots below")Top few rows of gapminder::gapminder data in 2 plots below
|
country |
continent |
year |
lifeExp |
pop |
gdpPercap |
|---|---|---|---|---|---|
|
Afghanistan |
Asia |
1952 |
28.801 |
8425333 |
779.4453 |
|
Afghanistan |
Asia |
1957 |
30.332 |
9240934 |
820.8530 |
|
Afghanistan |
Asia |
1962 |
31.997 |
10267083 |
853.1007 |
|
Afghanistan |
Asia |
1967 |
34.020 |
11537966 |
836.1971 |
|
Afghanistan |
Asia |
1972 |
36.088 |
13079460 |
739.9811 |
|
Afghanistan |
Asia |
1977 |
38.438 |
14880372 |
786.1134 |
Static ggplot plot
p <-
  ggplot2::ggplot(data = gapminder::gapminder) +
  ggplot2::aes(x = gdpPercap, y=lifeExp, size = pop, colour = country) +
  ggplot2::geom_point(show.legend = FALSE) +
  ggplot2::scale_x_log10() +
  ggplot2::scale_color_viridis_d() +
  ggplot2::scale_size(range = c(2, 12)) +
  ggplot2::labs(x = "GDP per capita", y = "Life expectancy") +
  ggplot2::facet_wrap(~year) +
  ggplot2::theme_minimal()
ggplot2::ggsave(filename = "./images/gapminder.png", plot = p)
knitr::include_graphics("images/gapminder.png")
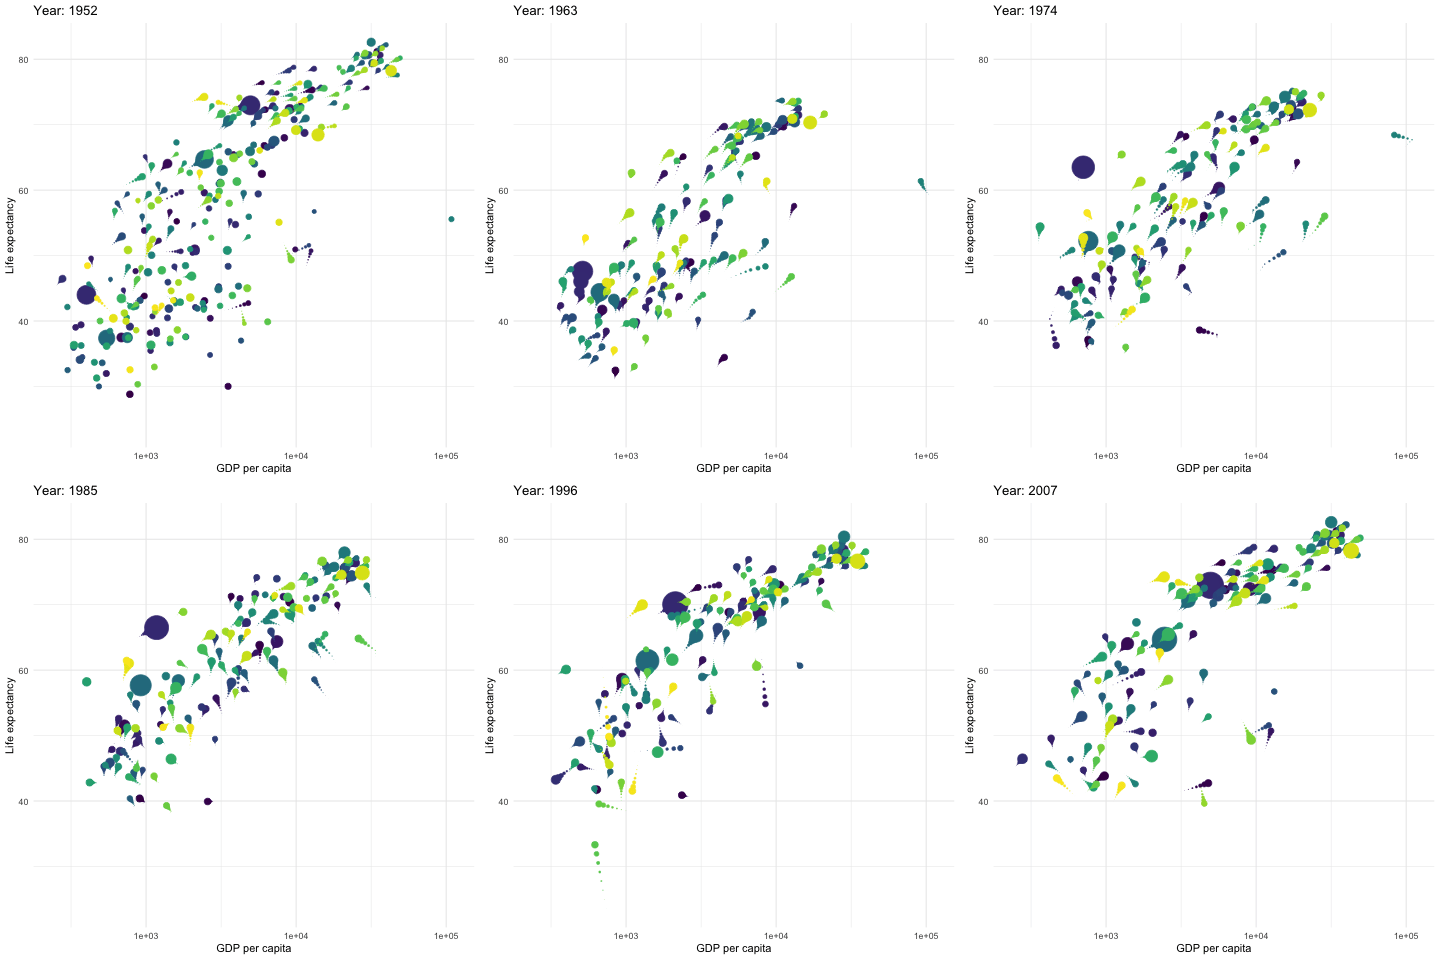
Animated gganimate plot
p <-
  ggplot2::ggplot(data = gapminder::gapminder) +
  ggplot2::aes(x = gdpPercap, y=lifeExp, size = pop, colour = country) +
  ggplot2::geom_point(show.legend = FALSE) +
  ggplot2::scale_x_log10() +
  ggplot2::scale_color_viridis_d() +
  ggplot2::scale_size(range = c(2, 12)) +
  ggplot2::labs(x = "GDP per capita", y = "Life expectancy") +
  # ggplot2::facet_wrap(~year)
  gganimate::transition_time(time = year) +
  ggplot2::labs(title = "Year: {frame_time}") +
  gganimate::shadow_wake(wake_length = 0.1, alpha = FALSE) +
  ggplot2::theme_minimal()
print(p)
gganimate::anim_save(filename = "./images/gapminder.gif")This example: https://mitchelloharawild.com/wombat-gganimate/#57
kable_table(head(datasets::iris), "Top few rows of datasets::iris data in 2 plots below")Top few rows of datasets::iris data in 2 plots below
|
Sepal.Length |
Sepal.Width |
Petal.Length |
Petal.Width |
Species |
|---|---|---|---|---|
|
5.1 |
3.5 |
1.4 |
0.2 |
setosa |
|
4.9 |
3.0 |
1.4 |
0.2 |
setosa |
|
4.7 |
3.2 |
1.3 |
0.2 |
setosa |
|
4.6 |
3.1 |
1.5 |
0.2 |
setosa |
|
5.0 |
3.6 |
1.4 |
0.2 |
setosa |
|
5.4 |
3.9 |
1.7 |
0.4 |
setosa |
Static ggplot plot
p <-
  ggplot2::ggplot(data = datasets::iris) +
  ggplot2::aes(x = Petal.Length, y = Sepal.Length) +
  ggplot2::geom_point(size = 2) +
  ggplot2::facet_wrap(~Species) +
  ggplot2::theme_minimal()
ggplot2::ggsave(filename = "./images/iris.png", plot = p)
knitr::include_graphics("images/iris.png")
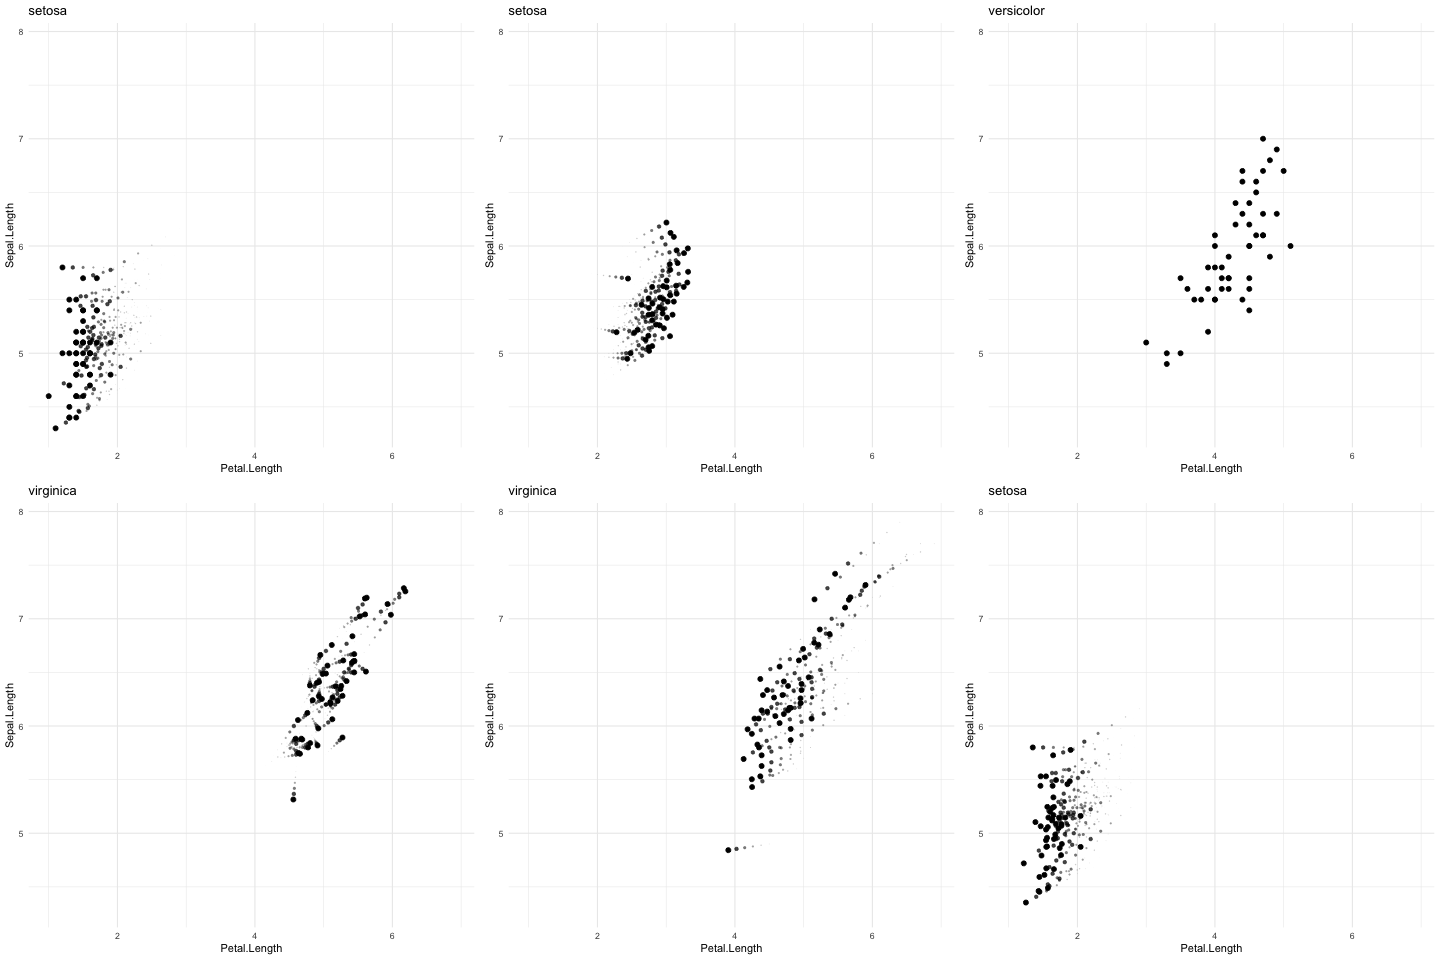
Animated gganimate plot
p <-
  ggplot2::ggplot(data = datasets::iris) +
  ggplot2::aes(x = Petal.Length, y = Sepal.Length) +
  ggplot2::geom_point(size = 2) +
  # ggplot2::facet_wrap(~Species)
  gganimate::transition_states(states = Species, transition_length = 4, state_length = 1) +
  ggplot2::labs(title = "{closest_state}") +
  gganimate::shadow_wake(wake_length = 0.1) +
  ggplot2::theme_minimal()
print(p)
gganimate::anim_save(filename = "./images/iris.gif")This example: https://mitchelloharawild.com/wombat-gganimate/#58
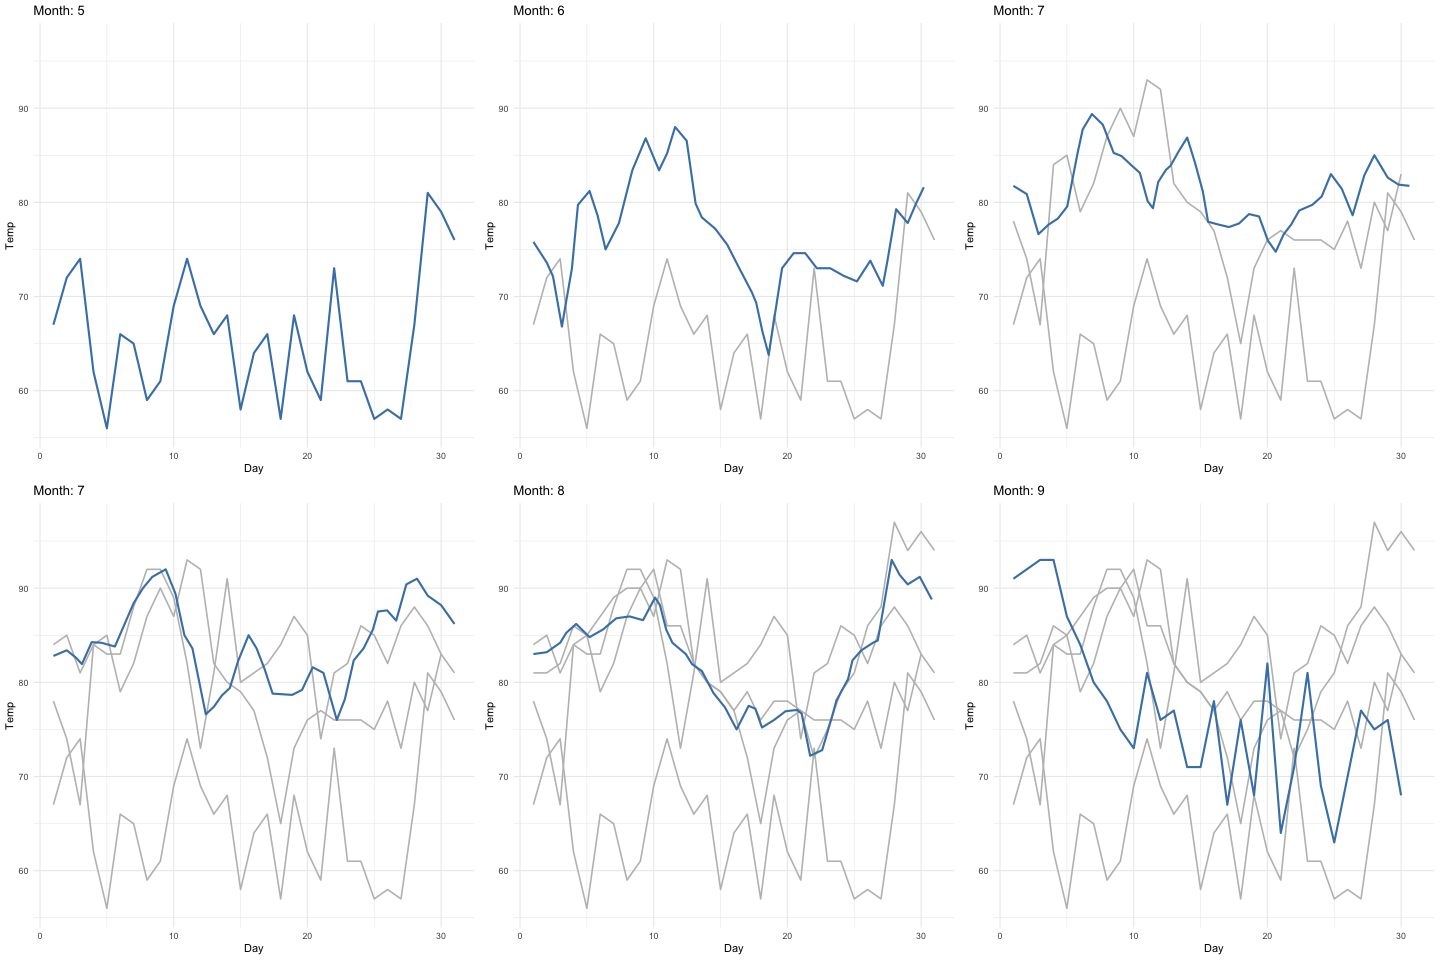
kable_table(head(datasets::airquality), "Top few rows of datasets::airquality data in 2 plots below")Top few rows of datasets::airquality data in 2 plots below
|
Ozone |
Solar.R |
Wind |
Temp |
Month |
Day |
|---|---|---|---|---|---|
|
41 |
190 |
7.4 |
67 |
5 |
1 |
|
36 |
118 |
8.0 |
72 |
5 |
2 |
|
12 |
149 |
12.6 |
74 |
5 |
3 |
|
18 |
313 |
11.5 |
62 |
5 |
4 |
|
NA |
NA |
14.3 |
56 |
5 |
5 |
|
28 |
NA |
14.9 |
66 |
5 |
6 |
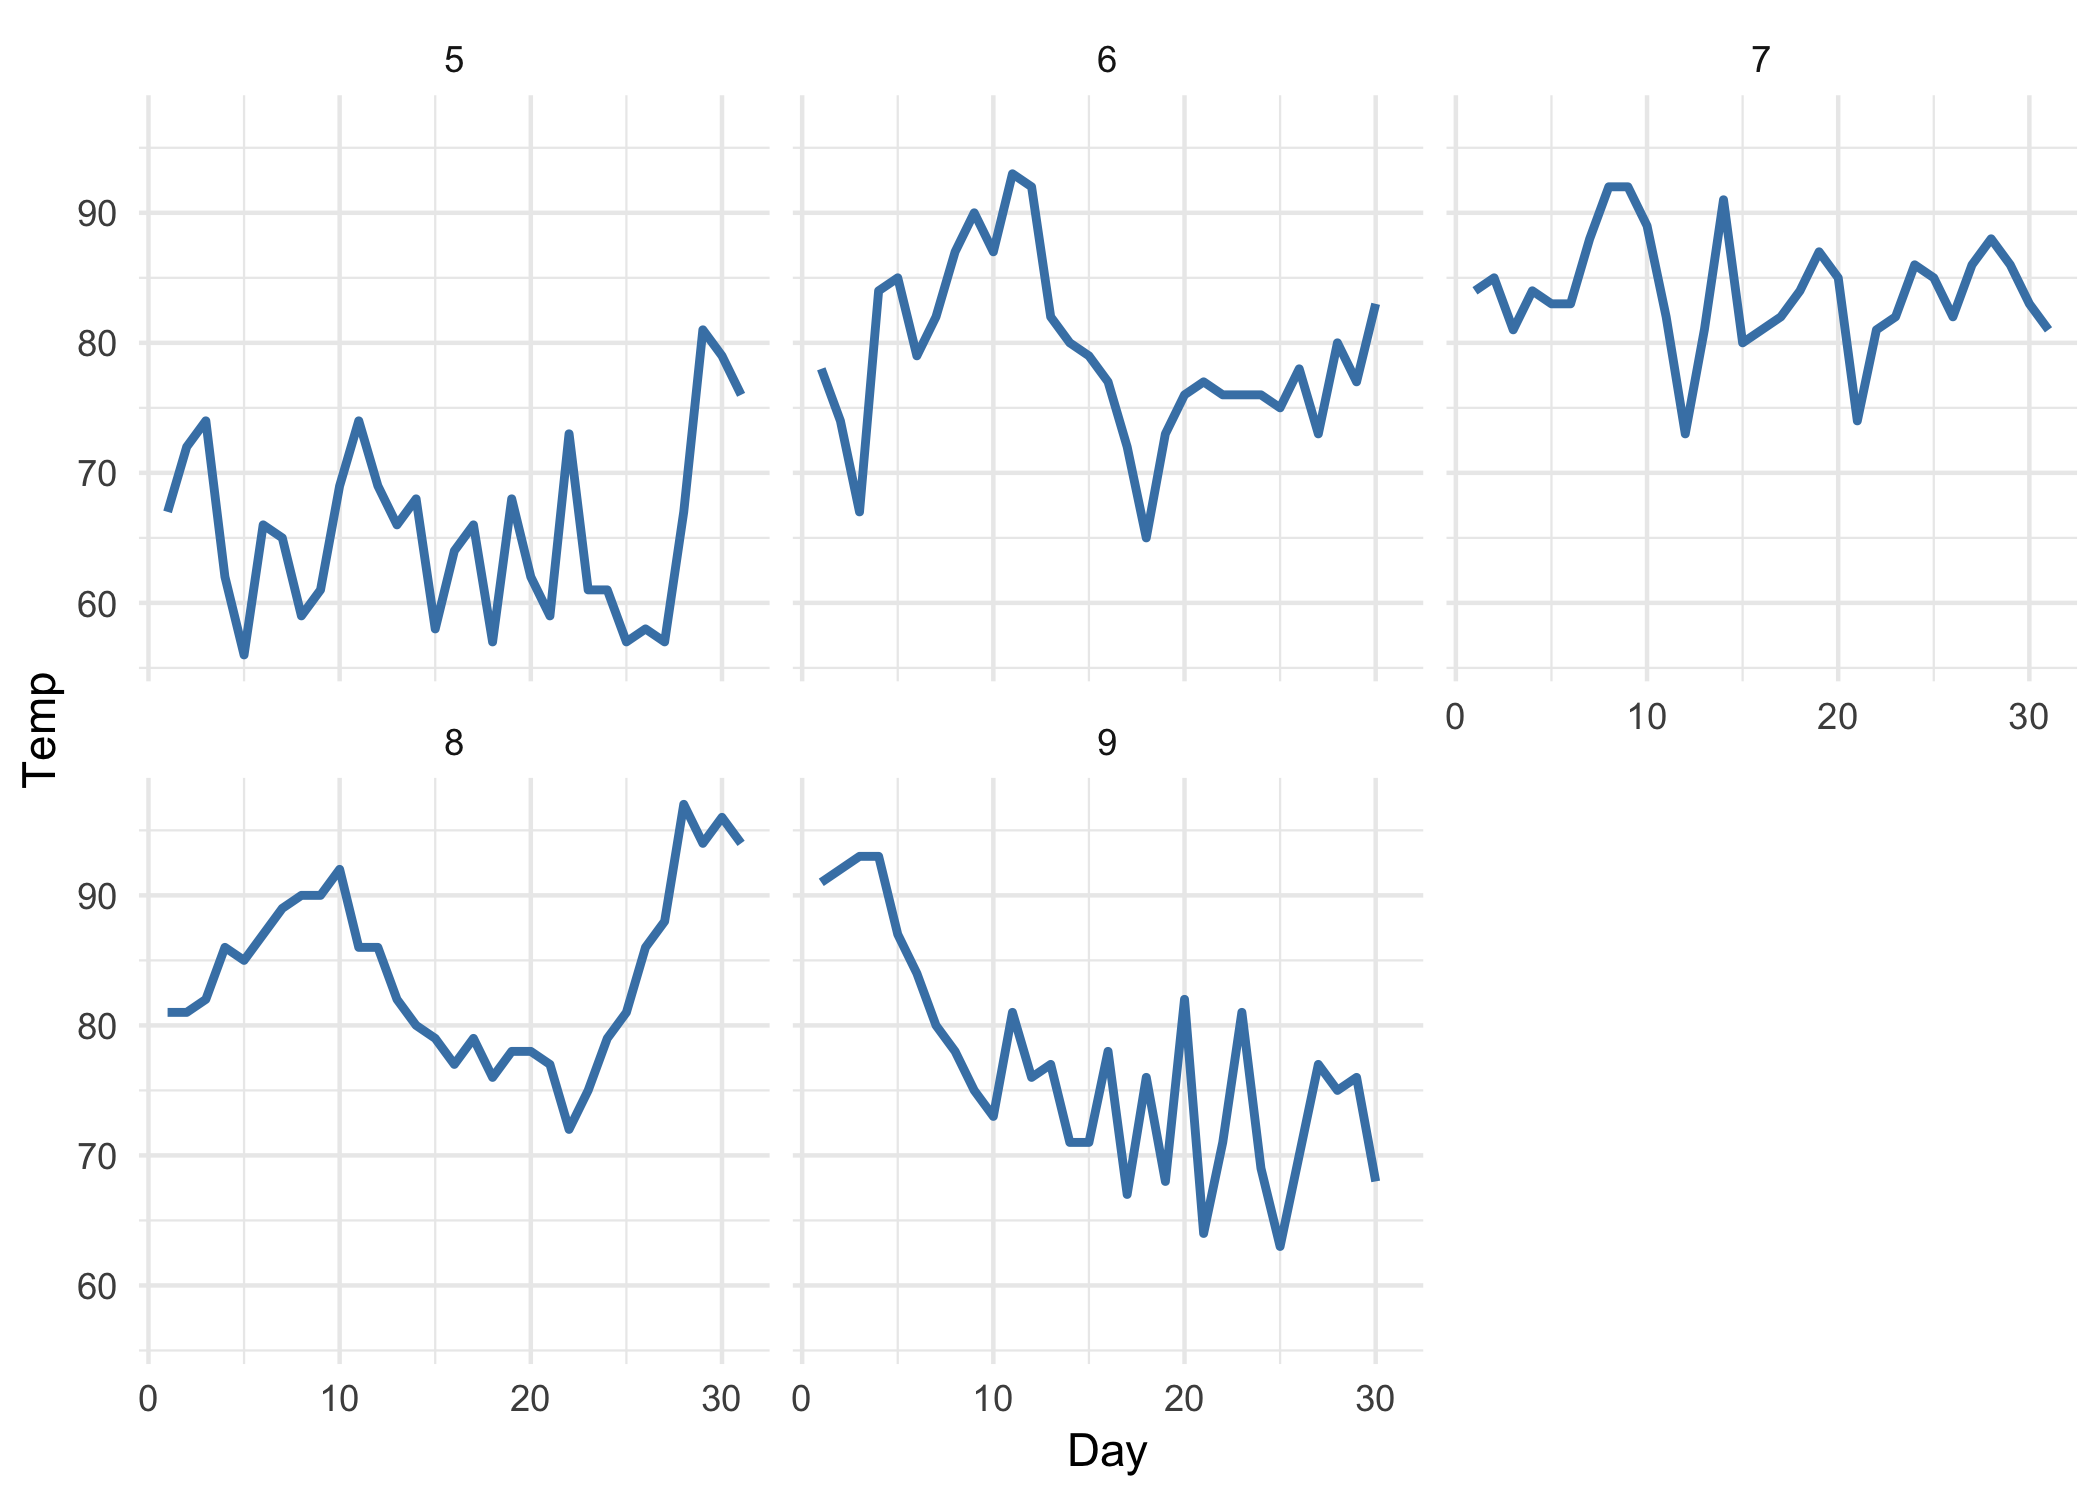
Static ggplot plot
p <-
  ggplot2::ggplot(data = datasets::airquality) +
  ggplot2::aes(x = Day, y = Temp) +
  ggplot2::geom_line(color = 'steelblue', size = 1) +
  ggplot2::facet_wrap(~Month) +
  ggplot2::theme_minimal()
ggplot2::ggsave(filename = "./images/airquality.png", plot = p)
knitr::include_graphics("images/airquality.png")
Animated gganimate plot
p <-
  ggplot2::ggplot(data = datasets::airquality) +
  ggplot2::aes(x = Day, y = Temp) +
  ggplot2::geom_line(color = 'steelblue', size = 1) +
  # ggplot2::facet_wrap(~Month)
  gganimate::transition_time(time = Month) +
  ggplot2::labs(title = "Month: {frame_time}") +
  gganimate::shadow_mark(colour = 'grey', size = 0.75) +
  ggplot2::theme_minimal()
print(p)
gganimate::anim_save(filename = "./images/airquality.gif")This example: https://mitchelloharawild.com/wombat-gganimate/#46
kable_table(head(datasets::mtcars), "Top few rows of datasets::mtcars data in 2 plots below")Top few rows of datasets::mtcars data in 2 plots below
|
mpg |
cyl |
disp |
hp |
drat |
wt |
qsec |
vs |
am |
gear |
carb |
|
|---|---|---|---|---|---|---|---|---|---|---|---|
|
Mazda RX4 |
21.0 |
6 |
160 |
110 |
3.90 |
2.620 |
16.46 |
0 |
1 |
4 |
4 |
|
Mazda RX4 Wag |
21.0 |
6 |
160 |
110 |
3.90 |
2.875 |
17.02 |
0 |
1 |
4 |
4 |
|
Datsun 710 |
22.8 |
4 |
108 |
93 |
3.85 |
2.320 |
18.61 |
1 |
1 |
4 |
1 |
|
Hornet 4 Drive |
21.4 |
6 |
258 |
110 |
3.08 |
3.215 |
19.44 |
1 |
0 |
3 |
1 |
|
Hornet Sportabout |
18.7 |
8 |
360 |
175 |
3.15 |
3.440 |
17.02 |
0 |
0 |
3 |
2 |
|
Valiant |
18.1 |
6 |
225 |
105 |
2.76 |
3.460 |
20.22 |
1 |
0 |
3 |
1 |
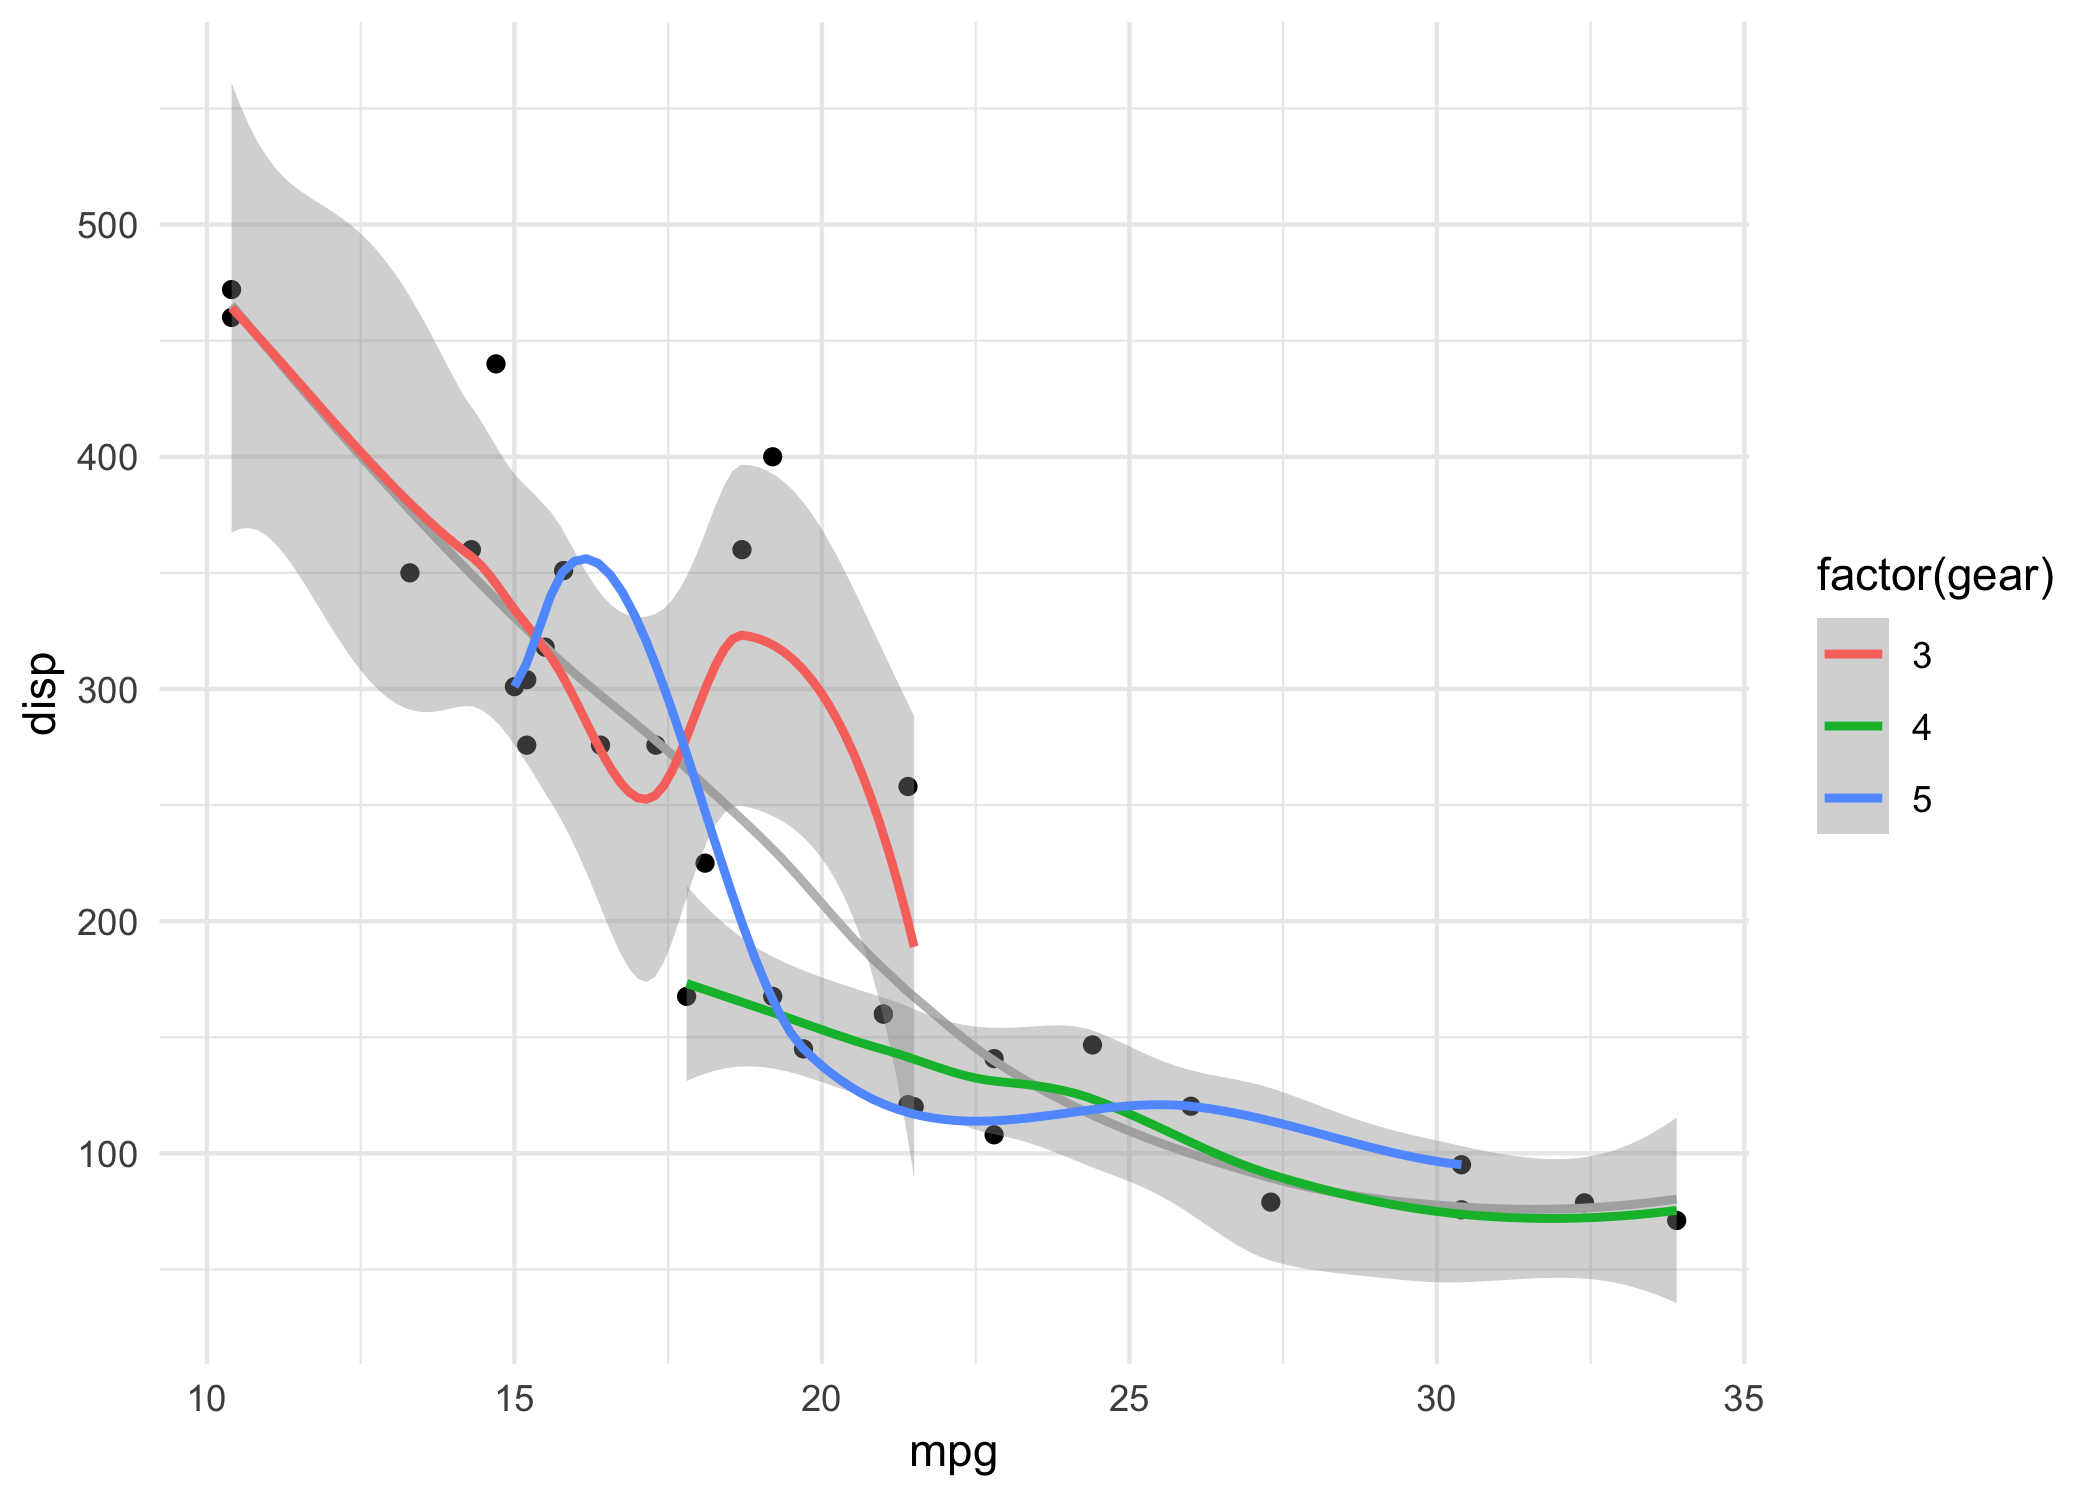
Static ggplot plot
p <-
  ggplot2::ggplot(data = datasets::mtcars) +
  ggplot2::aes(x = mpg, y = disp) +
  ggplot2::geom_point() +
  ggplot2::geom_smooth(colour = 'grey', se = FALSE) +
  ggplot2::geom_smooth(aes(colour = factor(gear))) +
  ggplot2::theme_minimal()
ggplot2::ggsave(filename = "./images/mtcars.png", plot = p)
knitr::include_graphics("images/mtcars.png")
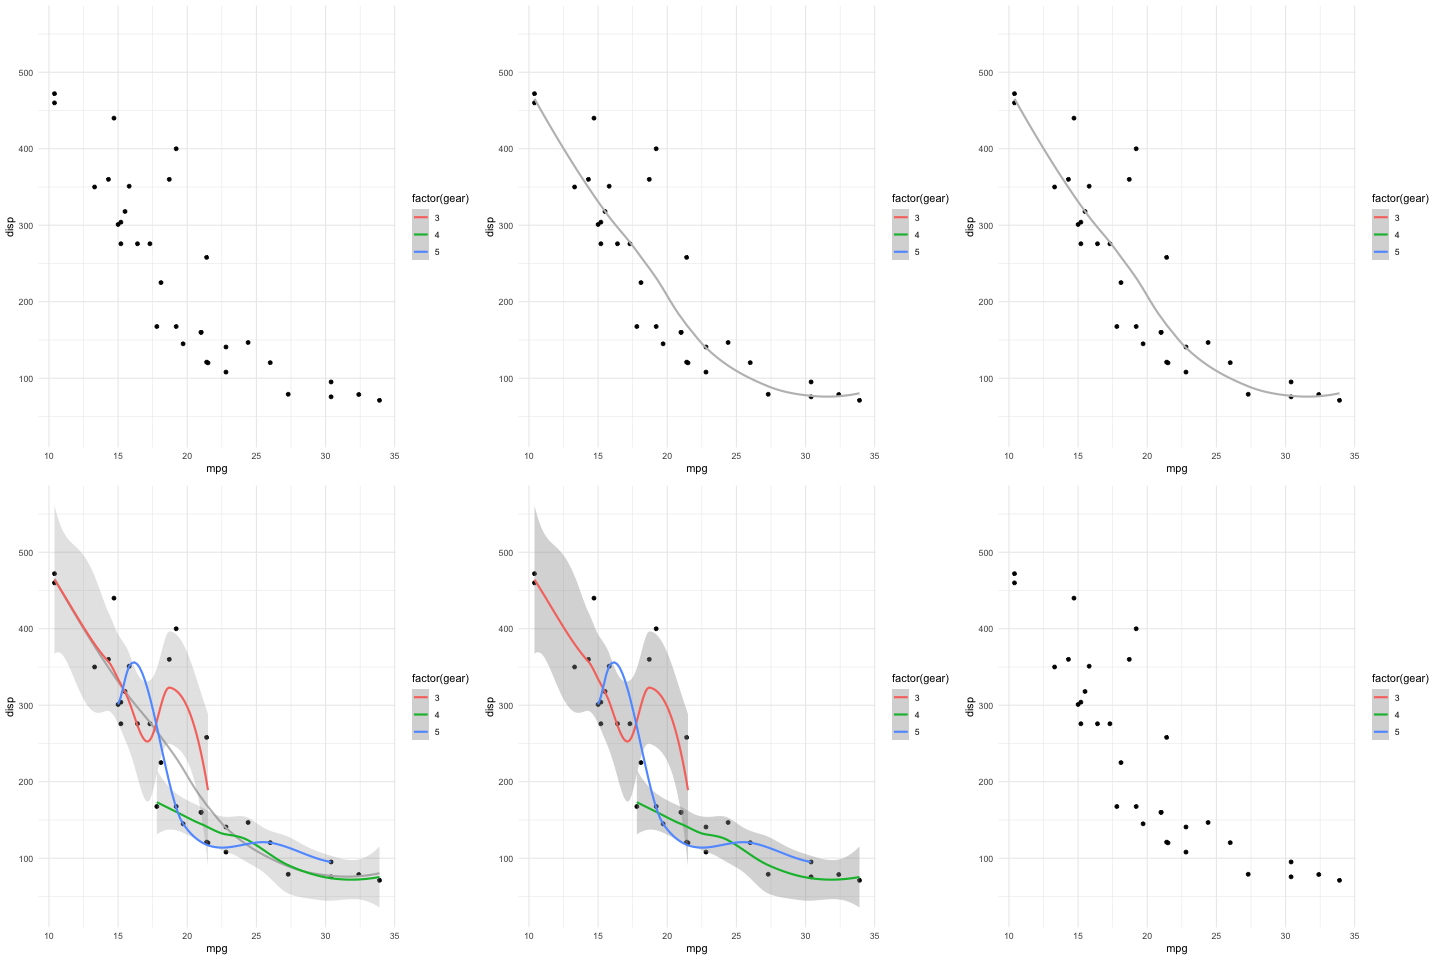
Animated gganimate plot
p <-
  ggplot2::ggplot(data = datasets::mtcars) +
  ggplot2::aes(x = mpg, y = disp) +
  ggplot2::geom_point() +
  ggplot2::geom_smooth(colour = 'grey', se = FALSE) +
  ggplot2::geom_smooth(aes(colour = factor(gear))) +
  gganimate::transition_layers(layer_length = 1, transition_length = 2,
                    from_blank = FALSE, keep_layers = c(Inf, 0, 0)) +
  gganimate::enter_fade() +
  gganimate::exit_fade() +
  ggplot2::theme_minimal()
print(p)
gganimate::anim_save(filename = "./images/mtcars.gif")