Demo project for online workshop with #RuPostgresTuesday. Watch tons of cool and useful videos on their channel: https://youtube.com/RuPostgres.
Check out the first part: В-s02e08 Распаковка TimescaleDB 2.0. В гостях — Иван Муратов. If you need the same project as in the first part check out the branch: PgTuesday_1_17.11.2020.
The second part is already available: В-s02e09 Timescale с Иваном Муратовым. Часть 2 — ныряем глубже: сжатие и визуализация. Added corresponding branch for the video: PgTuesday_2_01.12.2020.
The main branch is under development and can be different from the video.
A multi-node setup of TimescaleDB 2.12.1 with PostgreSQL 15 based on Docker image:
timescale/timescaledb-ha:pg15.4-ts2.12.1-all.
Initial cluster configuration:
single access node (AN) and 2 data nodes (DN)
with interval 1 week and replication factor 1.
Docker is required!
Create external network and run application stack.
$ docker network create pg_cluster_network
$ docker-compose up -d
PgAdmin is available on http://localhost:15432 with credentials: admin@admin.com / admin.
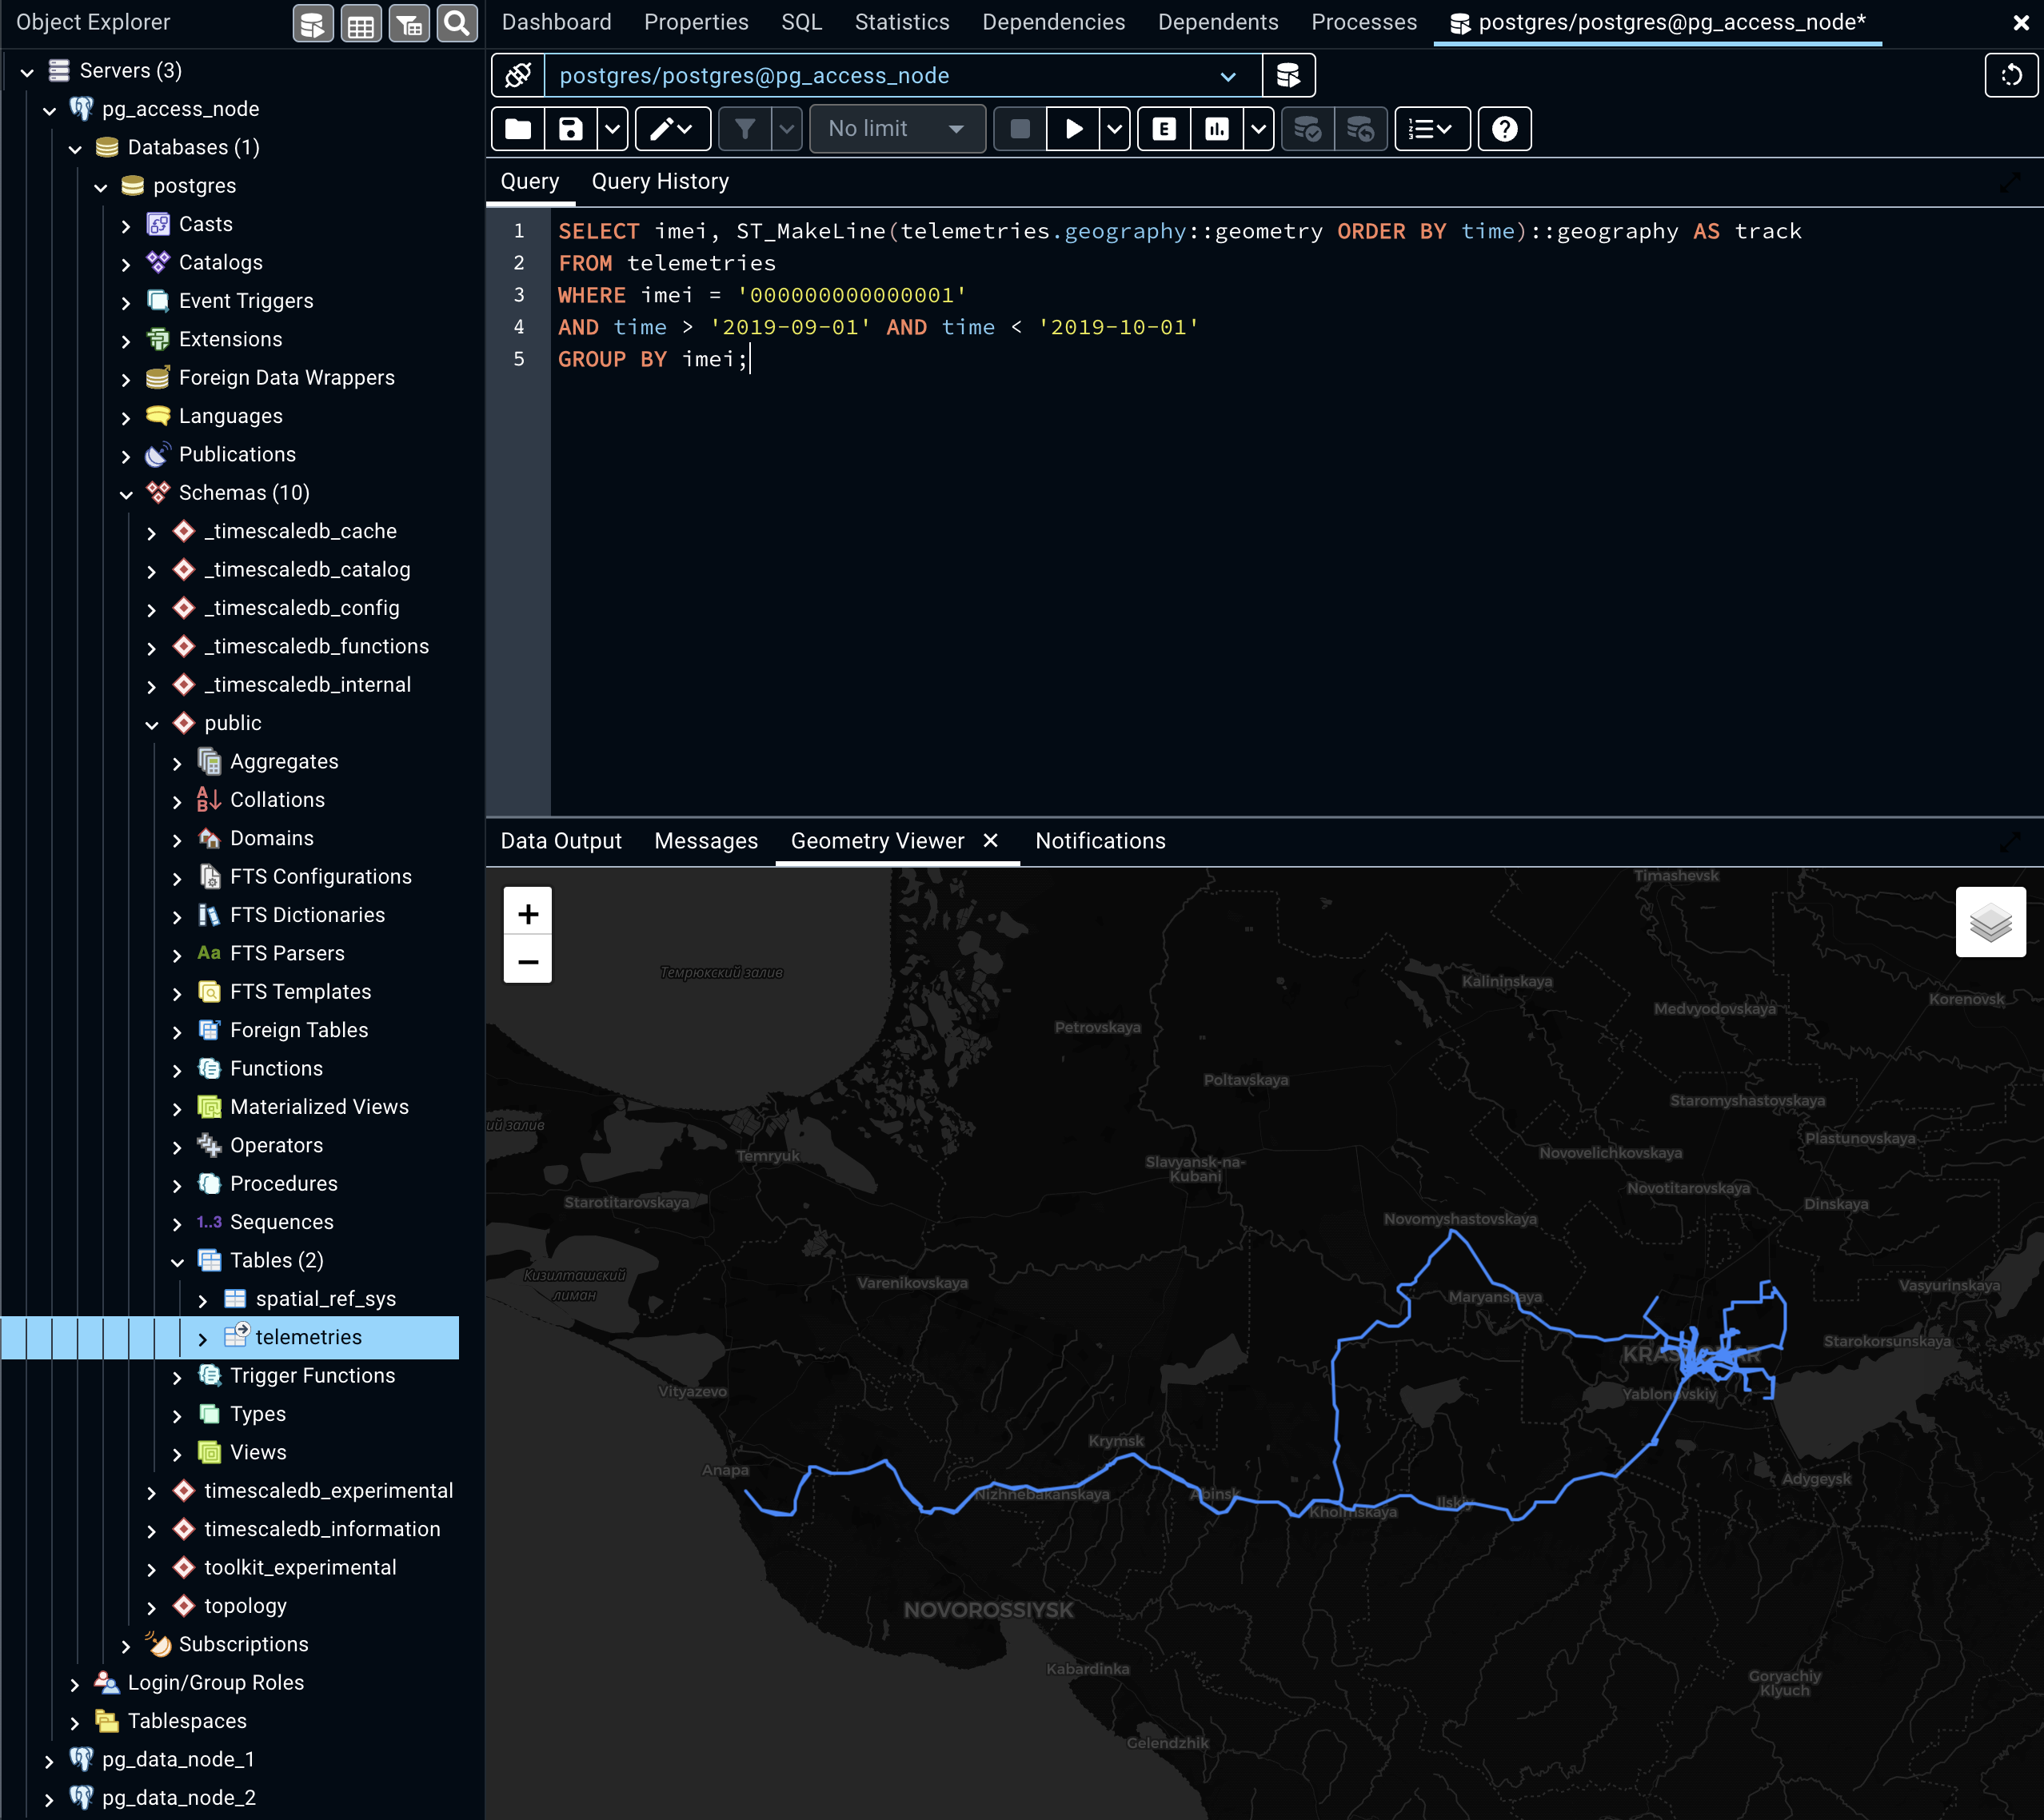
PgAdmin can render PostGIS data right on the map.
Or you can use any tool you like (psql, franchise, etc) if you don't want to look at geographical beauty ;)
# Access node
host: pg_access_node
port: 5432
username: postgres
password: postgres

# Data node 1
host: pg_data_node_1
port: 5433
username: postgres
password: postgres

# Data node 2
host: pg_data_node_2
port: 5434
username: postgres
password: postgres
At this moment you should to have a running cluster with 1 access node and 2 data nodes.
If you don't please look at how to run section and do it firstly.
Also, you need access to all nodes via psql, pgAdmin or any other way you like.
Now you can fill sample data (took about 2 minutes on NVMe):
$ gzip -k -d ./data/*csv.gz
$ docker exec -i pg_access_node /bin/sh < ./load-init-data.shRun on access node and each data nodes separately:
SELECT count(*) FROM telemetries;
ANALYZE telemetries;
SELECT * FROM approximate_row_count('telemetries');
SELECT DISTINCT imei FROM telemetries ORDER BY imei;-- Total speed analytics for 1 year
SELECT
time_bucket('30 days', time) AS bucket,
imei,
avg(speed) AS avg,
max(speed) AS max
FROM telemetries
WHERE speed > 0
GROUP BY imei, bucket
ORDER BY imei, bucket;
-- Speed percentiles on all telemetries
SELECT
percentile_cont(0.50) WITHIN GROUP (ORDER BY speed) AS p50,
percentile_cont(0.90) WITHIN GROUP (ORDER BY speed) AS p90,
percentile_cont(0.99) WITHIN GROUP (ORDER BY speed) AS p99
FROM telemetries;
-- Single track points for 1 month
SELECT * FROM telemetries
WHERE imei = '000000000000001'
AND time > '2019-09-01' AND time < '2019-10-01'
ORDER BY time ASC;
-- All tracks for 1 month
SELECT imei, ST_MakeLine(telemetries.geography::geometry ORDER BY time)::geography AS track
FROM telemetries
WHERE time > '2019-09-01' AND time < '2019-10-01'
GROUP BY imei;
-- All vehicle mileages for 1 month
WITH tracks AS (
SELECT imei, ST_MakeLine(telemetries.geography::geometry ORDER BY time)::geography AS track
FROM telemetries
WHERE time > '2019-09-01' AND time < '2019-10-01'
GROUP BY imei
)
SELECT imei, ST_Length(track) / 1000 AS kilometers
FROM tracks
GROUP BY imei, kilometers;Firstly run the third instance of postgres for new data node:
$ docker volume create pg_data_node_3_data
$ docker run -d \
    --name pg_data_node_3 \
    --restart=unless-stopped \
    -e "POSTGRES_DB=postgres" \
    -e "POSTGRES_USER=postgres" \
    -e "POSTGRES_PASSWORD=postgres" \
    -p 5435:5432 \
    --network pg_cluster_network \
    -v pg_data_node_3_data:/home/postgres/pgdata/data \
    -v `pwd`/trust-all.sh:/docker-entrypoint-initdb.d/777_trust.sh \
    -v `pwd`/unsafe-boost.sh:/docker-entrypoint-initdb.d/888_boost.sh \
    -v `pwd`//init-data-node.sh:/docker-entrypoint-initdb.d/999_cluster.sh \
    timescale/timescaledb-ha:pg15.4-ts2.12.1-all
Now connect a new node to the cluster running command below from the access node:
SELECT * FROM add_data_node('data_node_3', host => 'pg_data_node_3');
SELECT * FROM timescaledb_information.data_nodes;
Then attach new data node to the distributed hypertable:
SELECT * FROM timescaledb_information.hypertables;
SELECT * FROM timescaledb_information.dimensions;

SELECT * FROM attach_data_node('data_node_3', 'telemetries');
SELECT * FROM timescaledb_information.dimensions;Fill more sample data (took about 1 minutes on NVMe):
$ docker exec -i pg_access_node /bin/sh < ./load-more-data.shRun on access node and each data nodes separately:
SELECT count(*) FROM telemetries;
ANALYZE telemetries;
SELECT * FROM approximate_row_count('telemetries');
SELECT DISTINCT imei FROM telemetries ORDER BY imei;
Check old and new data distribution:
SELECT data_nodes, chunk_name, range_start, range_end FROM timescaledb_information.chunks
WHERE range_start < '2020-01-01'
ORDER BY data_nodes ASC, range_start ASC;

SELECT data_nodes FROM timescaledb_information.chunks
WHERE range_start < '2020-01-01'
GROUP BY data_nodes;

SELECT data_nodes, chunk_name, range_start, range_end FROM timescaledb_information.chunks
WHERE range_start > '2020-01-01'
ORDER BY data_nodes ASC, range_start ASC;

SELECT data_nodes FROM timescaledb_information.chunks
WHERE range_start > '2020-01-01'
GROUP BY data_nodes;Check current database size and compression status:
-- Compression settings on each data node
SELECT * FROM timescaledb_information.compression_settings;

-- Hypertable sizes
SELECT * FROM hypertable_detailed_size('telemetries');
SELECT node_name, pg_size_pretty(total_bytes) AS total
FROM hypertable_detailed_size('telemetries')
ORDER BY node_name ASC;

-- Chunk sizes
SELECT * FROM chunks_detailed_size('telemetries');
SELECT node_name, chunk_name, pg_size_pretty(total_bytes) AS total
FROM chunks_detailed_size('telemetries')
ORDER BY node_name ASC, chunk_name ASC;
Create a dump for single chunk before compression:
$ docker exec -i pg_data_node_2 \
    pg_dump -h localhost -p 5432 -U postgres -Fp -v \
    -t _timescaledb_internal._dist_hyper_1_1_chunk postgres > ./chunk_before_compression.sql
Apply compression to hypertable:
ALTER TABLE telemetries SET (
    timescaledb.compress,
    timescaledb.compress_orderby = 'time DESC',
    timescaledb.compress_segmentby = 'imei'
);

CALL distributed_exec('SELECT add_compression_policy(''telemetries'', INTERVAL ''30 days'', if_not_exists => TRUE)');
Check database size after applying compression:
-- Compression settings on each data node
SELECT * FROM timescaledb_information.compression_settings;

-- Hypertable compression
SELECT * FROM hypertable_compression_stats('telemetries');
SELECT node_name, pg_size_pretty(before_compression_total_bytes) AS before, pg_size_pretty(after_compression_total_bytes) AS after
FROM hypertable_compression_stats('telemetries')
ORDER BY node_name ASC;

-- Chunk compression
SELECT * FROM chunk_compression_stats('telemetries');
SELECT node_name, chunk_name, pg_size_pretty(before_compression_total_bytes) AS before, pg_size_pretty(after_compression_total_bytes) AS after
FROM chunk_compression_stats('telemetries')
ORDER BY node_name ASC, chunk_name ASC;
Check that data is still available:
-- Single track for 1 month
SELECT imei, ST_MakeLine(telemetries.geography::geometry ORDER BY time)::geography AS track
FROM telemetries
WHERE imei = '000000000000001'
AND time > '2019-09-01' AND time < '2019-10-01'
GROUP BY imei;
Create a dump for single chunk after compression:
$ docker exec -i pg_data_node_2 \
    pg_dump -h localhost -p 5432 -U postgres -Fp -v \
    -t _timescaledb_internal._dist_hyper_1_1_chunk postgres > ./chunk_after_compression.sql

# Find compressed_chunk_id that corresponds to uncompressed _timescaledb_internal._dist_hyper_1_1_chunk.
$ docker exec -i pg_data_node_2 \
    psql -v ON_ERROR_STOP=1 -h localhost -p 5432 -U postgres \
    -c "SELECT compressed_chunk_id FROM _timescaledb_catalog.chunk WHERE table_name = '_dist_hyper_1_1_chunk'"

$ docker exec -i pg_data_node_2 \
    pg_dump -h localhost -p 5432 -U postgres -Fp -v \
    -t _timescaledb_internal.compress_hyper_2_185_chunk postgres > ./compressed_chunk.sql
Look at result sql files content.
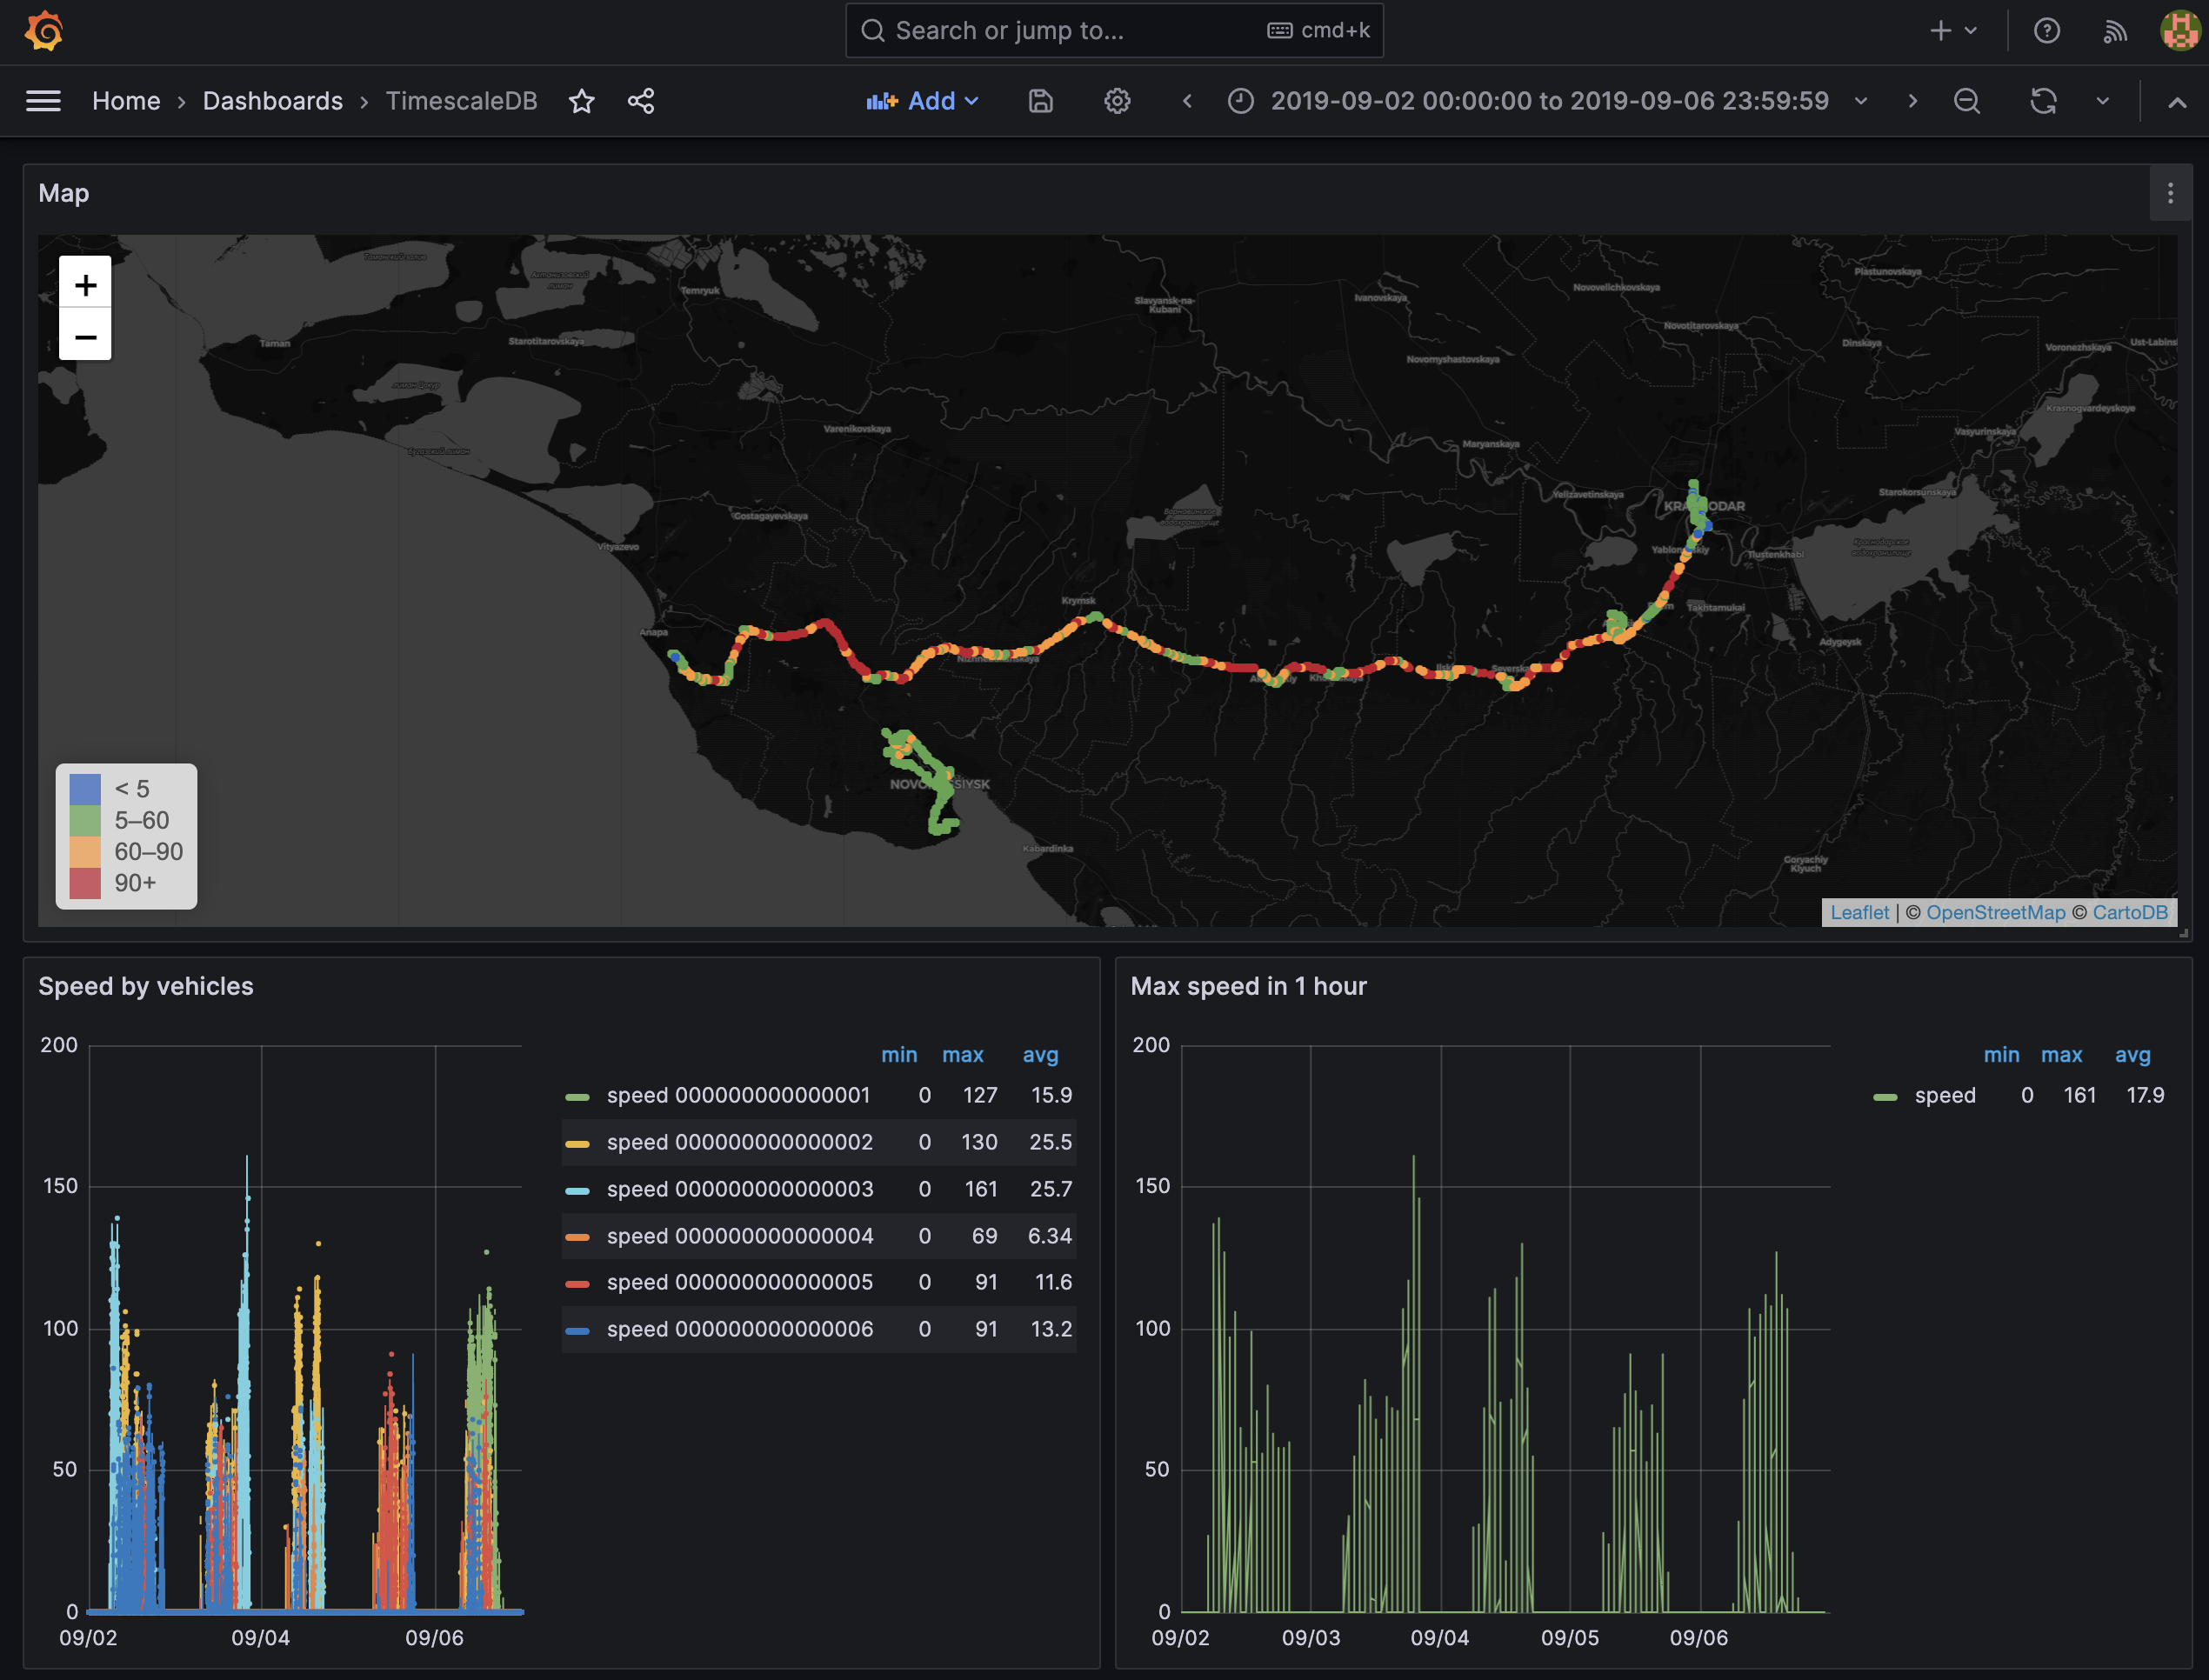
Run Grafana in docker container:
$ docker run \
    --name=grafana \
    -p 3000:3000 \
    -e "GF_INSTALL_PLUGINS=grafana-worldmap-panel" \
    -d grafana/grafana:10.1.5
Open it on http://localhost:3000
with admin / admin.
Then add TimescaleDB as new datasource and import dashboard:
-
Connections / Data Sources / Add data source / Find and select
PostgreSQL. -
Connect to access node via docker bridge (host=
172.17.0.1; port=5432; db=postgres; user=postgres; password=postgres; ssl=off). For MacOS usehost.docker.internal:5432for host. -
Select
PostgreSQLversion15and enableTimescaleDBsupport.
After that import dashboard from the file grafana.json (Dashboard / Import / Upload JSON file).
# grafana
$ docker stop grafana
$ docker rm grafana

# 3th data node
$ docker stop pg_data_node_3
$ docker rm pg_data_node_3
$ docker volume rm pg_data_node_3_data

# cluster
$ docker-compose down --volumes

# network
$ docker network rm pg_cluster_network
