Python Interface with Nova Fitness SDS011 sensor, running multiple sensors at once. Built from the datasheet
- SDS011 (or SDS018) connected with TTL UART adapter (5V)
- You connect all the SDS011 sensors to USB hub (via a UART adapter), then you can run all of them at once:
- first get list of USB devices connected to the hub, and initiate each instance
  usbs = get_usb()
  processs = list()
  for port in usbs:
      p = SDS011(port=port, push_mqtt=False, interval=60)
      processs.append(p)
- and then run the loop like this:
  while True:
      for p in processs:
          try:
              p.run_passive()
              # p.run_query()
          except Exception as e:
              print(f'Error: {p.name} with {e}')
              continue
- by default, the data is saved to CSV file in each folder named after month and year
p = SDS011(port=port, save_data=False, interval=60)
- If the are different USB devices connected to the computer, then each USB port can be initiated:
p1 = SDS011(port='/dev/ttyUSB1', interval=60)
p2 = SDS011(port='/dev/ttyUSB3', interval=60)
and put them in a loop:
while True:
  for p in [p1, p2]:
    p.run_passive()
-
There are two modes to collect data, besides active reading a).
run_query()is for regularly reading data with fan is continously running, and thus only query data the duration defined byintervaland b).run_passive()includes turning on the fan for 20 seconds, read data, and turn off the fan, and repeat cycle after eachintervalseconds -
If you have an MQTT server setup, then you need to specify the topic, routing, and authentication inside
sds011/__init__.pyfile
# MQTT host, users
mqtt = '192.168.1.100'  # change this
topic = 'sensor/sds011' # and this
auth = {'username': 'mqtt_user', 'password': 'mqtt_password'} # and these two
and make sure to turn on the flag when instantiating:
p = SDS011(port=port, push_mqtt=True, interval=60)
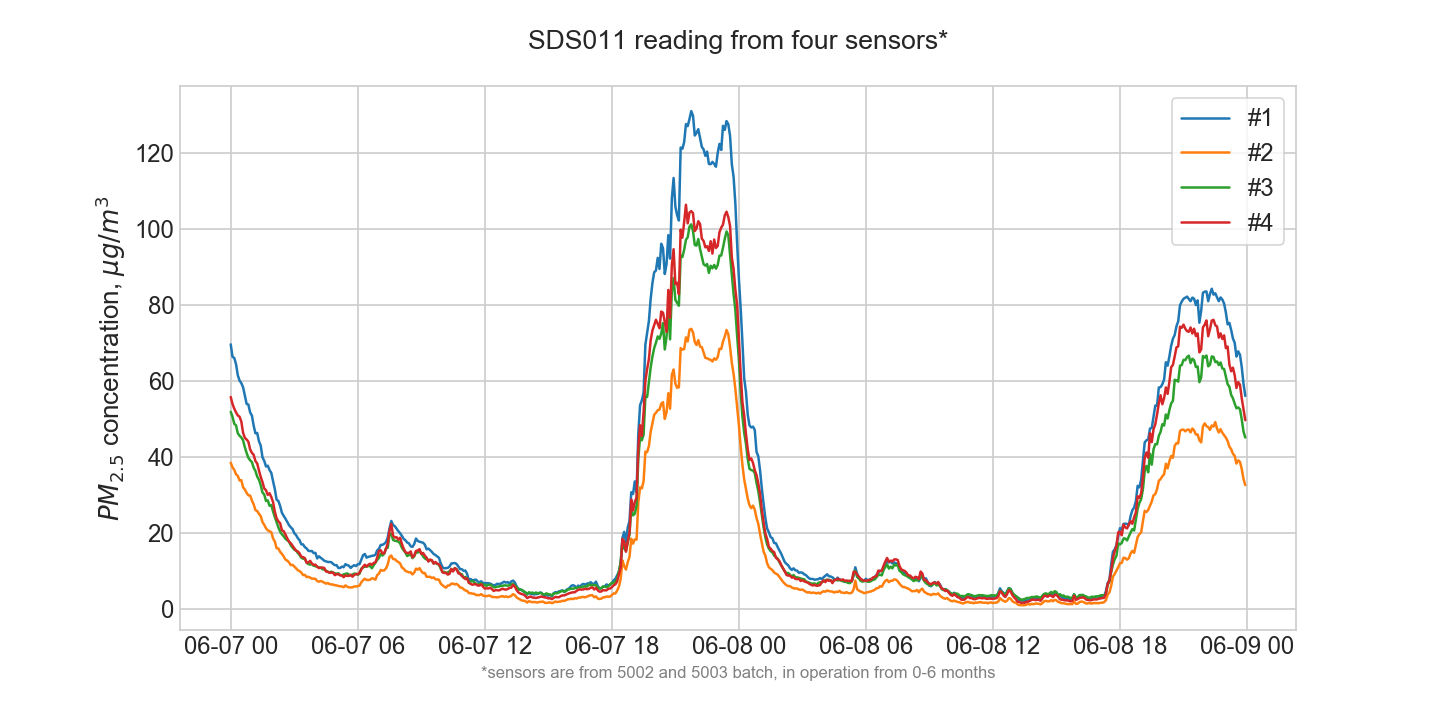
- analyze data by each sensor using different moving average (to smooth out the data)
- Datasheet SDS011 online or in datasheet folder
- Communication Protocol: check out datasheet folder


