omplotr: 'ggplot2' Based RNAseq Plot Function Collection
Installation and loading
Install the latest version from GitHub as follow:
# Install
if(!require(devtools)) install.packages("devtools")
devtools::install_github("bioShaun/omplotr")
Theme
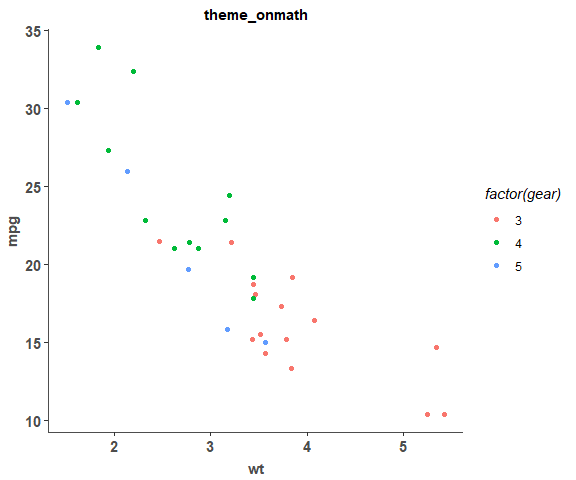
theme_onmath is a ggplot theme used in almost all rnaseq plots.
library(omplotr)
p <- ggplot(mtcars) + geom_point(aes(x = wt, y = mpg,colour = factor(gear)))
p + theme_onmath() + ggtitle("theme_onmath")
Plot
functions to generate plot in ngs analysis
QC
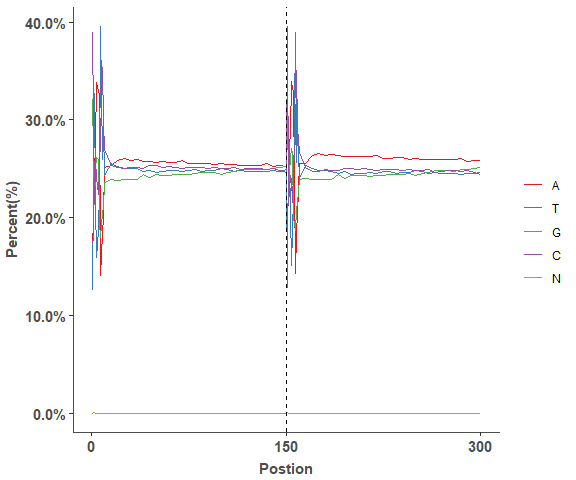
Reads GC distribution
# Fastqc GC result
head(gc_test_data, 4)
#>   X.Base     sample variable     value
#> 1      1 DZ-A-LDY-1        A 0.1644290
#> 2      2 DZ-A-LDY-1        A 0.2451466
#> 3      3 DZ-A-LDY-1        A 0.2764013
#> 4      4 DZ-A-LDY-1        A 0.3381226

# lineplot of GC distribution across Fastq file
gc_line_plot(gc_test_data)
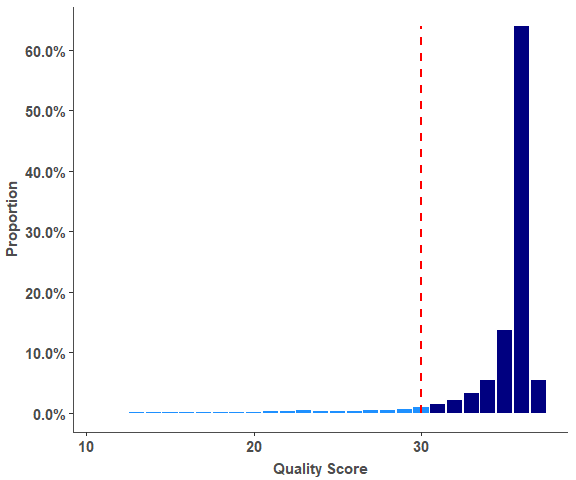
Reads Quality barplot
# Reads Quality result
# Bars of Quality <= 30 were marked with color 'dodgerblue',
# Bars of Quality > 30 were marked with color 'navy'.
head(rq_test_data, 4)
#>   Quality Count   Proportion      color     sample
#> 1      11    57 1.016564e-06 dodgerblue YP-B-WYX-6
#> 2      12  7352 1.311189e-04 dodgerblue YP-B-WYX-6
#> 3      13 40981 7.308736e-04 dodgerblue YP-B-WYX-6
#> 4      14 57256 1.021129e-03 dodgerblue YP-B-WYX-6

# Reads Quality barplot
reads_quality_plot(rq_test_data)
Quant
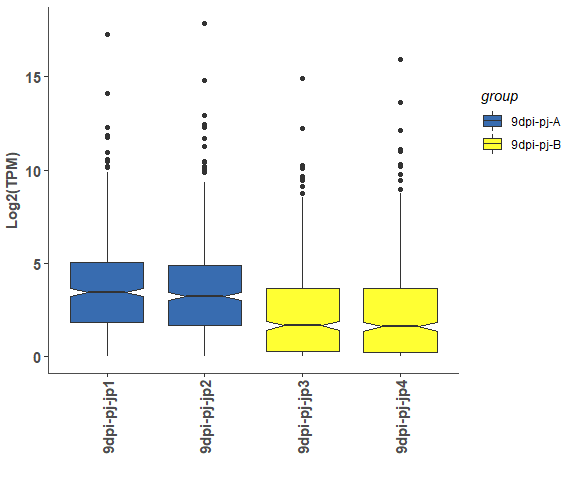
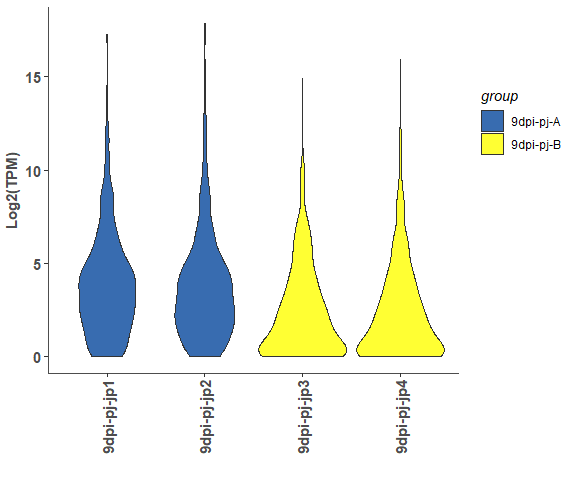
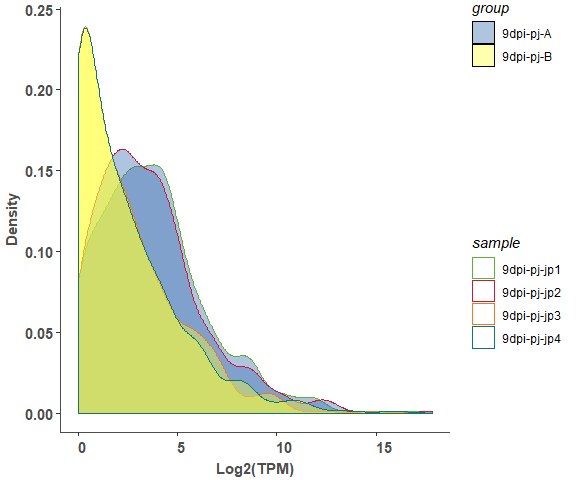
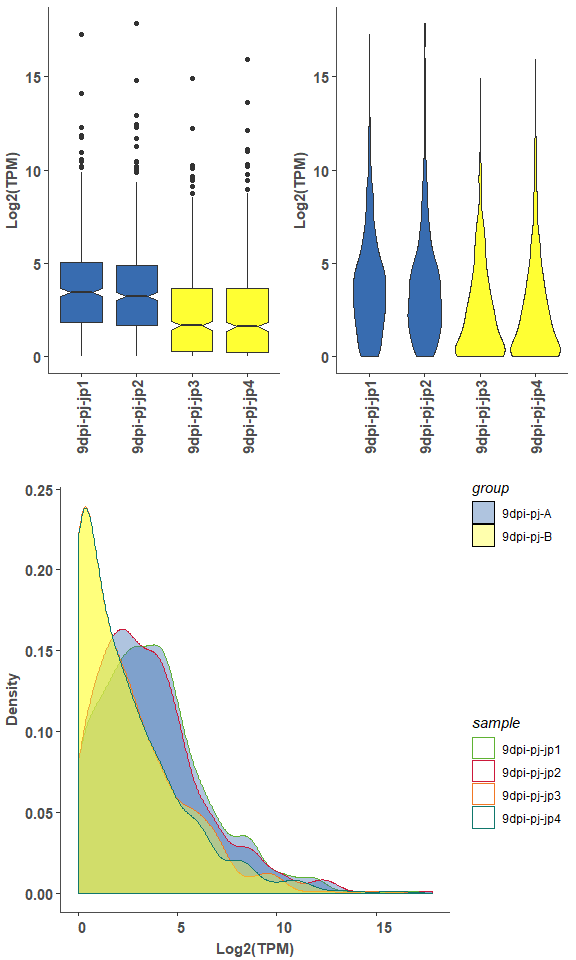
expression box, violin and density plot
# expression matrix
head(exp_test_data, 4)
#>                 9dpi-pj-jp1 9dpi-pj-jp2 9dpi-pj-jp3 9dpi-pj-jp4
#> ENSRNA049464904      64.515      48.860      34.595      25.636
#> ENSRNA049468231   17763.048   28554.280    4878.607   12802.249
#> ENSRNA049468277     544.106    1152.839     169.713     497.665
#> ENSRNA049471043    4926.117    7815.150    1198.127    4545.421

# sample information
head(test_sample_data, 4)
#>   condition      sample
#> 1 9dpi-pj-A 9dpi-pj-jp1
#> 2 9dpi-pj-A 9dpi-pj-jp2
#> 3 9dpi-pj-B 9dpi-pj-jp3
#> 4 9dpi-pj-B 9dpi-pj-jp4

# boxplot
om_boxplot(exp_test_data, test_sample_data, 'box')
# violin
om_boxplot(exp_test_data, test_sample_data, 'violin')# density
om_boxplot(exp_test_data, test_sample_data, 'density')# merged plot
om_boxplot(exp_test_data, test_sample_data, 'all')expression PCA analysis point plot
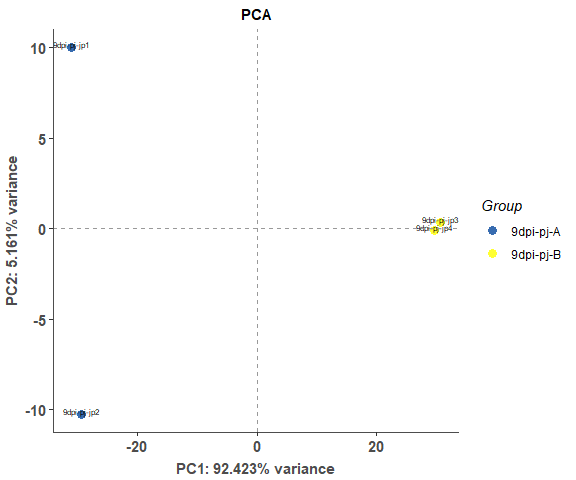
om_pca_plot(exp_test_data, test_sample_data)expression correlation heatmap
om_correlation_plot(exp_test_data, test_sample_data)diff expression volcano plot
# diff result
head(diff_test_data, 4)
#>                  Gene_ID X9dpi.pj.jp1 X9dpi.pj.jp2 X9dpi.pj.jp3
#> 21437       Os01g0977250        4.780        4.551        7.806
#> 33806       Os03g0738600        1.209        0.946        1.338
#> 30663       Os03g0823900        5.598        5.303        6.322
#> 32700 EPlOSAG00000051674        0.000        0.000        1.482
#>       X9dpi.pj.jp4       logFC    PValue       FDR          compare
#> 21437        6.489 -0.21257899 0.3964249 0.6631611 Case1_vs_Control
#> 33806        1.392  0.03988567 0.9082303 1.0000000 Case1_vs_Control
#> 30663        7.596  0.04831892 0.8428859 0.9858939 Case1_vs_Control
#> 32700        0.000 -2.62518576 1.0000000 1.0000000 Case1_vs_Control

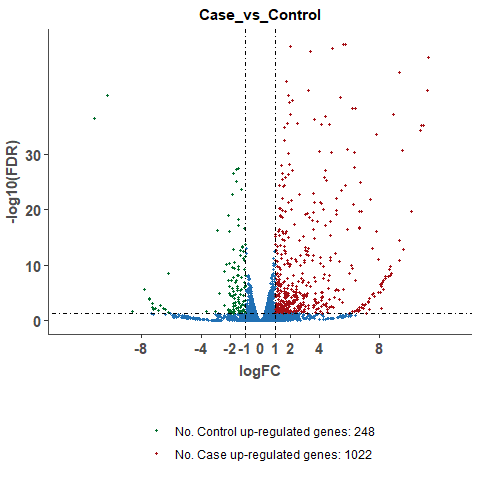
# plot volcano plot for a single compare
om_volcano_plot(diff_test_data, 'Case_vs_Control')
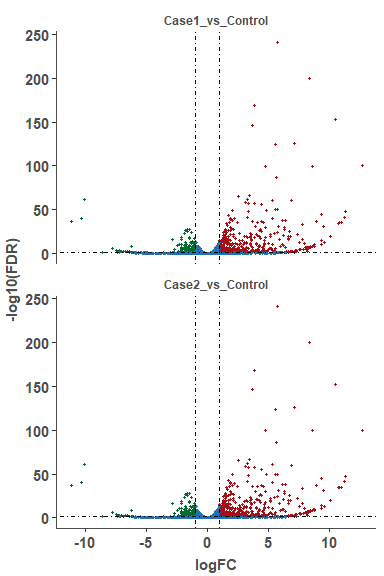
# plot volcano plot for merged results
om_volcano_plot(diff_test_data, 'ALL')expression heatmap
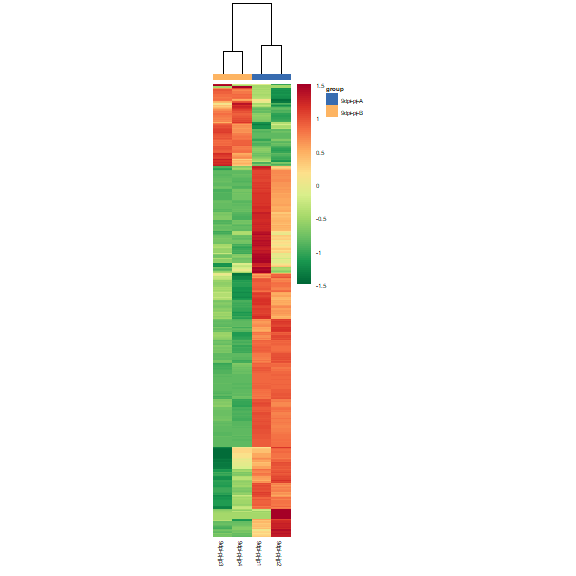
# plot expression heatmap
om_heatmap(exp_test_data, test_sample_data)
expression cluster line plot
# cluster result
head(cluster_test_data, 4)
#>     cluster            Gene_id    variable     value
#> 1 cluster_1 EPlOSAG00000008604 9dpi-pj-jp1 0.4935853
#> 2 cluster_1 EPlOSAG00000018483 9dpi-pj-jp1 0.5236810
#> 3 cluster_1 EPlOSAG00000027962 9dpi-pj-jp1 0.5008437
#> 4 cluster_1 EPlOSAG00000045132 9dpi-pj-jp1 0.4879498

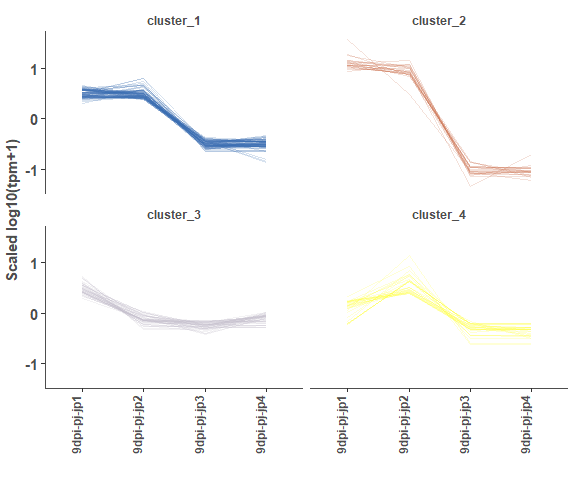
# cluster plot
om_cluster_plot(cluster_test_data)
Enrichment analysis
GO enrichment analysis
# diff genes
test_diff_genes <- go_test_data_list[['test_diff_genes']]
head(test_diff_genes, 4)
#> [1] "Os01g0150000" "Os01g0172600" "Os01g0220700" "Os01g0303600"

# gene length
test_gene_len <- go_test_data_list[['test_gene_len']]
head(test_gene_len, 4)
#>        gene_id gene_len
#> 1 Os01g0290700     2289
#> 2 Os01g0249200     5219
#> 3 Os01g0152200     3747
#> 4 Os01g0295700     5836

# get go annotation file
gene_go_map <- system.file("extdata", "topgo_test_data.txt", package = "omplotr")
gene_go_map_df <- data.table::fread(gene_go_map, header = F)
head(gene_go_map_df, 4)
#>              V1                               V2
#> 1: Os01g0166300                       GO:0017176
#> 2: Os01g0296700 GO:0016787,GO:0005975,GO:0004553
#> 3: Os01g0290700            GO:0005524,GO:0016887
#> 4: Os01g0236400            GO:0005737,GO:0005856

# run goseq and show result
goseq_output <- om_goseq(test_diff_genes, test_gene_len, gene_go_map)
head(goseq_output, 4)
#>       category over_represented_pvalue    qvalue numDEInCat numInCat
#> 571 GO:0010287             0.008881002 0.3812842          2        2
#> 848 GO:0042803             0.008933210 0.3812842          2        2
#> 76  GO:0001172             0.024128606 0.3812842          2        3
#> 123 GO:0003968             0.024128606 0.3812842          2        3
#>                                     term ontology
#> 571                        plastoglobule       CC
#> 848    protein homodimerization activity       MF
#> 76          transcription, RNA-templated       BP
#> 123 RNA-directed RNA polymerase activity       MF
#>                         DE_id
#> 571 Os01g0173000,Os01g0118000
#> 848 Os01g0235200,Os01g0251000
#> 76  Os01g0198000,Os01g0198100
#> 123 Os01g0198000,Os01g0198100

# go enrichment bar plot
go_enrich_file <- system.file("extdata", "enrichment",
                              "example.go.enrichment.txt",
                              package = "omplotr")
go_enrich_list <- clean_enrich_table(go_enrich_file)
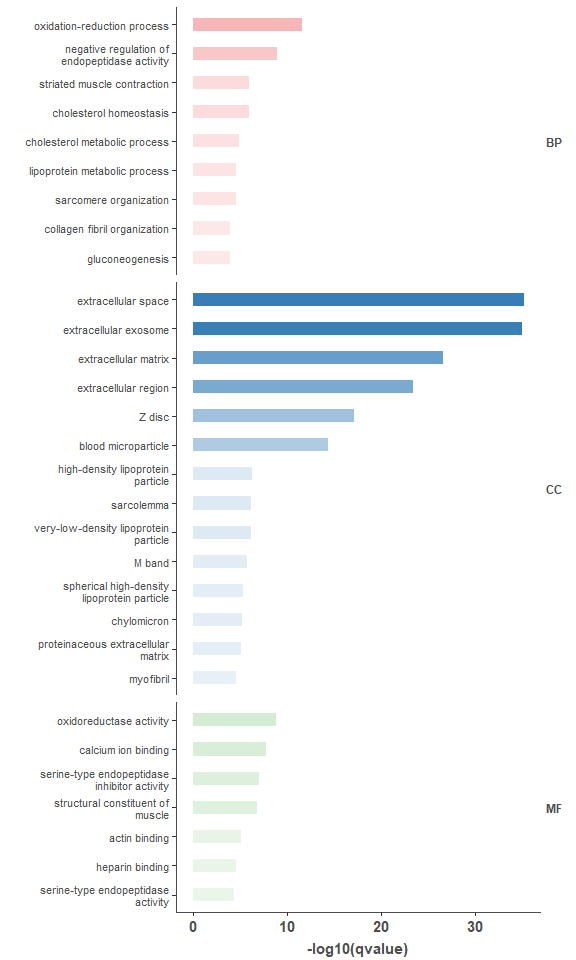
om_enrich_bar_plot(go_enrich_list$table, ylab_title=go_enrich_list$title)
GO DAG graph
# run topGO
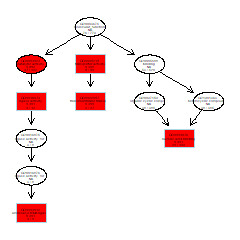
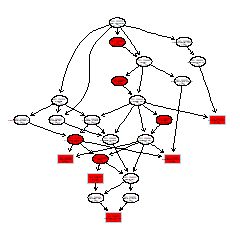
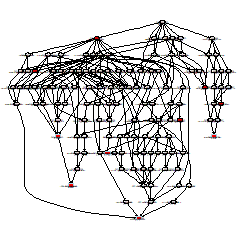
om_topgo(gene_go_map, test_diff_genes, goseq_output)
Mapping
mapping_stats <- system.file("extdata", "all_sample.mapping.xls", package = "omplotr")

# show mapping stats table
mapping_df <- read.delim(mapping_stats)
head(mapping_df, 4)
#>                       Item        A        F1       K1        M1        M
#> 1               sequences: 95851866 102408480 88220198 102921732 89688164
#> 2            reads mapped: 94204523  98758455 87279503 101428039 88480886
#> 3 reads mapped and paired: 93189512  98569864 87122868 101234396 87992732
#> 4          reads unmapped:  1647343   3650025   940695   1493693  1207278
#>          W
#> 1 89827664
#> 2 88521129
#> 3 88075758
#> 4  1306535

# show mapping summary
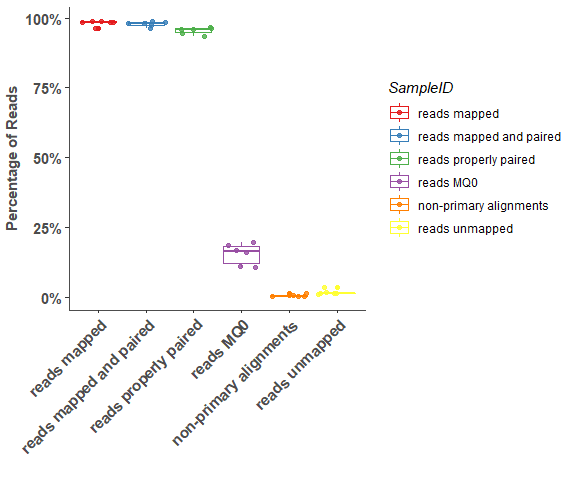
om_bwa_mapping_plot(mapping_stats, 5)
# show detail sample information
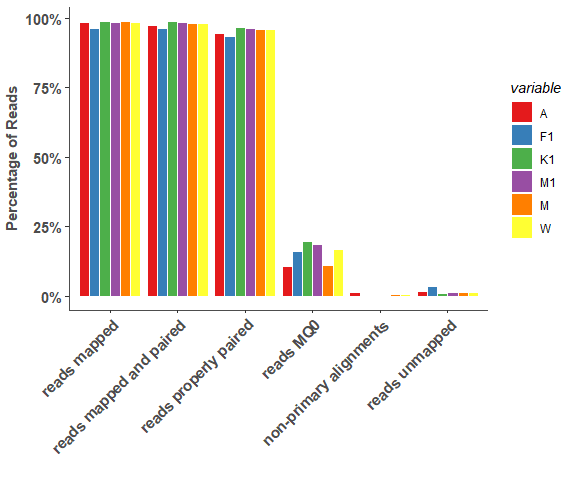
om_bwa_mapping_plot(mapping_stats, 10)Reads Coverage
cov_stats <- system.file("extdata", "all_sample.genome.cov.xls", package = "omplotr")

# show coverage table
cov_df <- read.delim(cov_stats)
head(cov_df, 4)
#>   Depth      A     F1     K1     M1      M      W
#> 1     1 876435 764784 944681 786463 814983 857249
#> 2     2 630273 573112 761490 564038 600328 635532
#> 3     3 553156 479804 677398 484714 513316 544938
#> 4     4 523375 436214 652812 453986 470339 503152

# show coverage summary
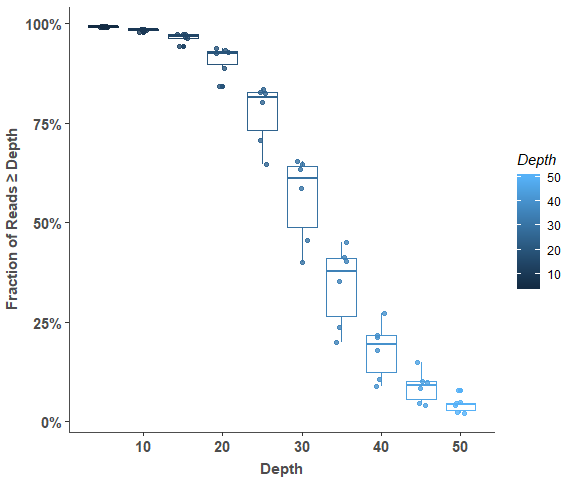
om_reads_cov_plot(cov_stats, 5, 100)
# show detail sample information
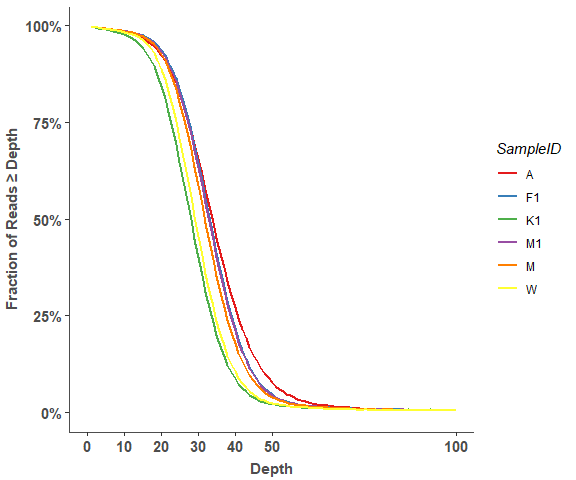
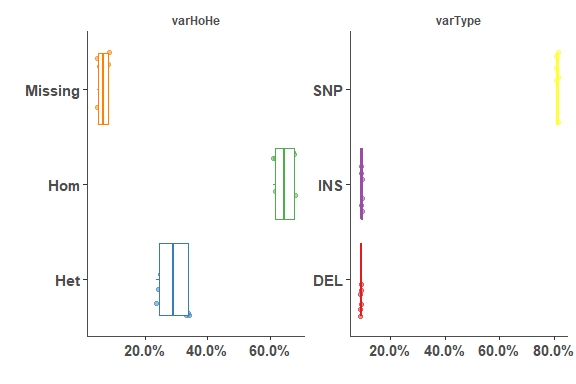
om_reads_cov_plot(cov_stats, 10, 100)Variant Distribution
# transform variant summary data
stats_names <- om_const_reseq_variant[['var_file_labs']][1:2]
stats_dir <- system.file("extdata", "variant_stats",
                         package = "omplotr")
impact_map_file <- system.file("extdata", "variant_stats", "snpeff_varEffects.csv",
                               package = "omplotr")
test_pie_stats <- lapply(stats_names, om_var_pie_stats,
                         stats_dir=stats_dir,
                         impact_map_file=impact_map_file)
head(test_pie_stats[[1]], 4)
#>   Type variable      value Percentage     fig
#> 1  DEL        A 0.09495793      9.50% varType
#> 2  INS        A 0.09794564      9.79% varType
#> 3  SNP        A 0.80709642     80.71% varType
#> 4  DEL       F1 0.09068346      9.07% varType

# plot pie plot for each sample
a_om_test_var_stats <- dplyr::filter(om_test_var_stats[[1]], variable == 'A')
om_var_pie_plot(a_om_test_var_stats)
# variant summary boxplot
om_test_var_stats_df <- plyr::ldply(om_test_var_stats, data.frame)
om_var_summary_plot(om_test_var_stats_df)