The source code for scAnalyzer (single and cell Analyzer). It performs clustering and differential analyses on spatial proteomics data.
- Agglomerative clustering performed using the schist nested model.
- The schist nested model achieves a more fine-grained clustering as compared to Leiden or schist planted model, achieved over several clustering levels--thereby giving the user higher control over cluster analyses, and how many clusters to stop the clustering algorithm at.
Open command prompt/ terminal, then run:
python3 1_compute_list_of_essential_proteins_for_clustering.py <adata_pickle_path> --user_selected_cluster_level <user_selected_cluster_level>The positional arguments are:
[1] adata_pickle_path Description: Specify path to anndata pickle data; type=str
The optional arguments are:
[1] --user_selected_cluster_level       Description: Specify cluster level to get essential proteins list from; type=str [read more below]

{any_integer_value, "complete"} accepted, default is 'complete':
    - If value is integer positive: That represents the cluster level
    - If value is integer negative: That represents the cluster number in reverse order (for example: -1 represents (n-1)-th cluster)
    - If value is 'complete': That represents the last (n-th) cluster. Please note that if your input is "complete", just type it in normally without inverted commas/ quotation marks -- the program is capable of reading strings directly without any quotation symbols.
    - For all other values (i. negative integers; ii. fractional values; iii. any strings other than "complete"; iv. integer value is out of range of [1, n] where n is the total number of clusters): the default is n.
The outputs are:
- List of essential proteins per cluster per patient
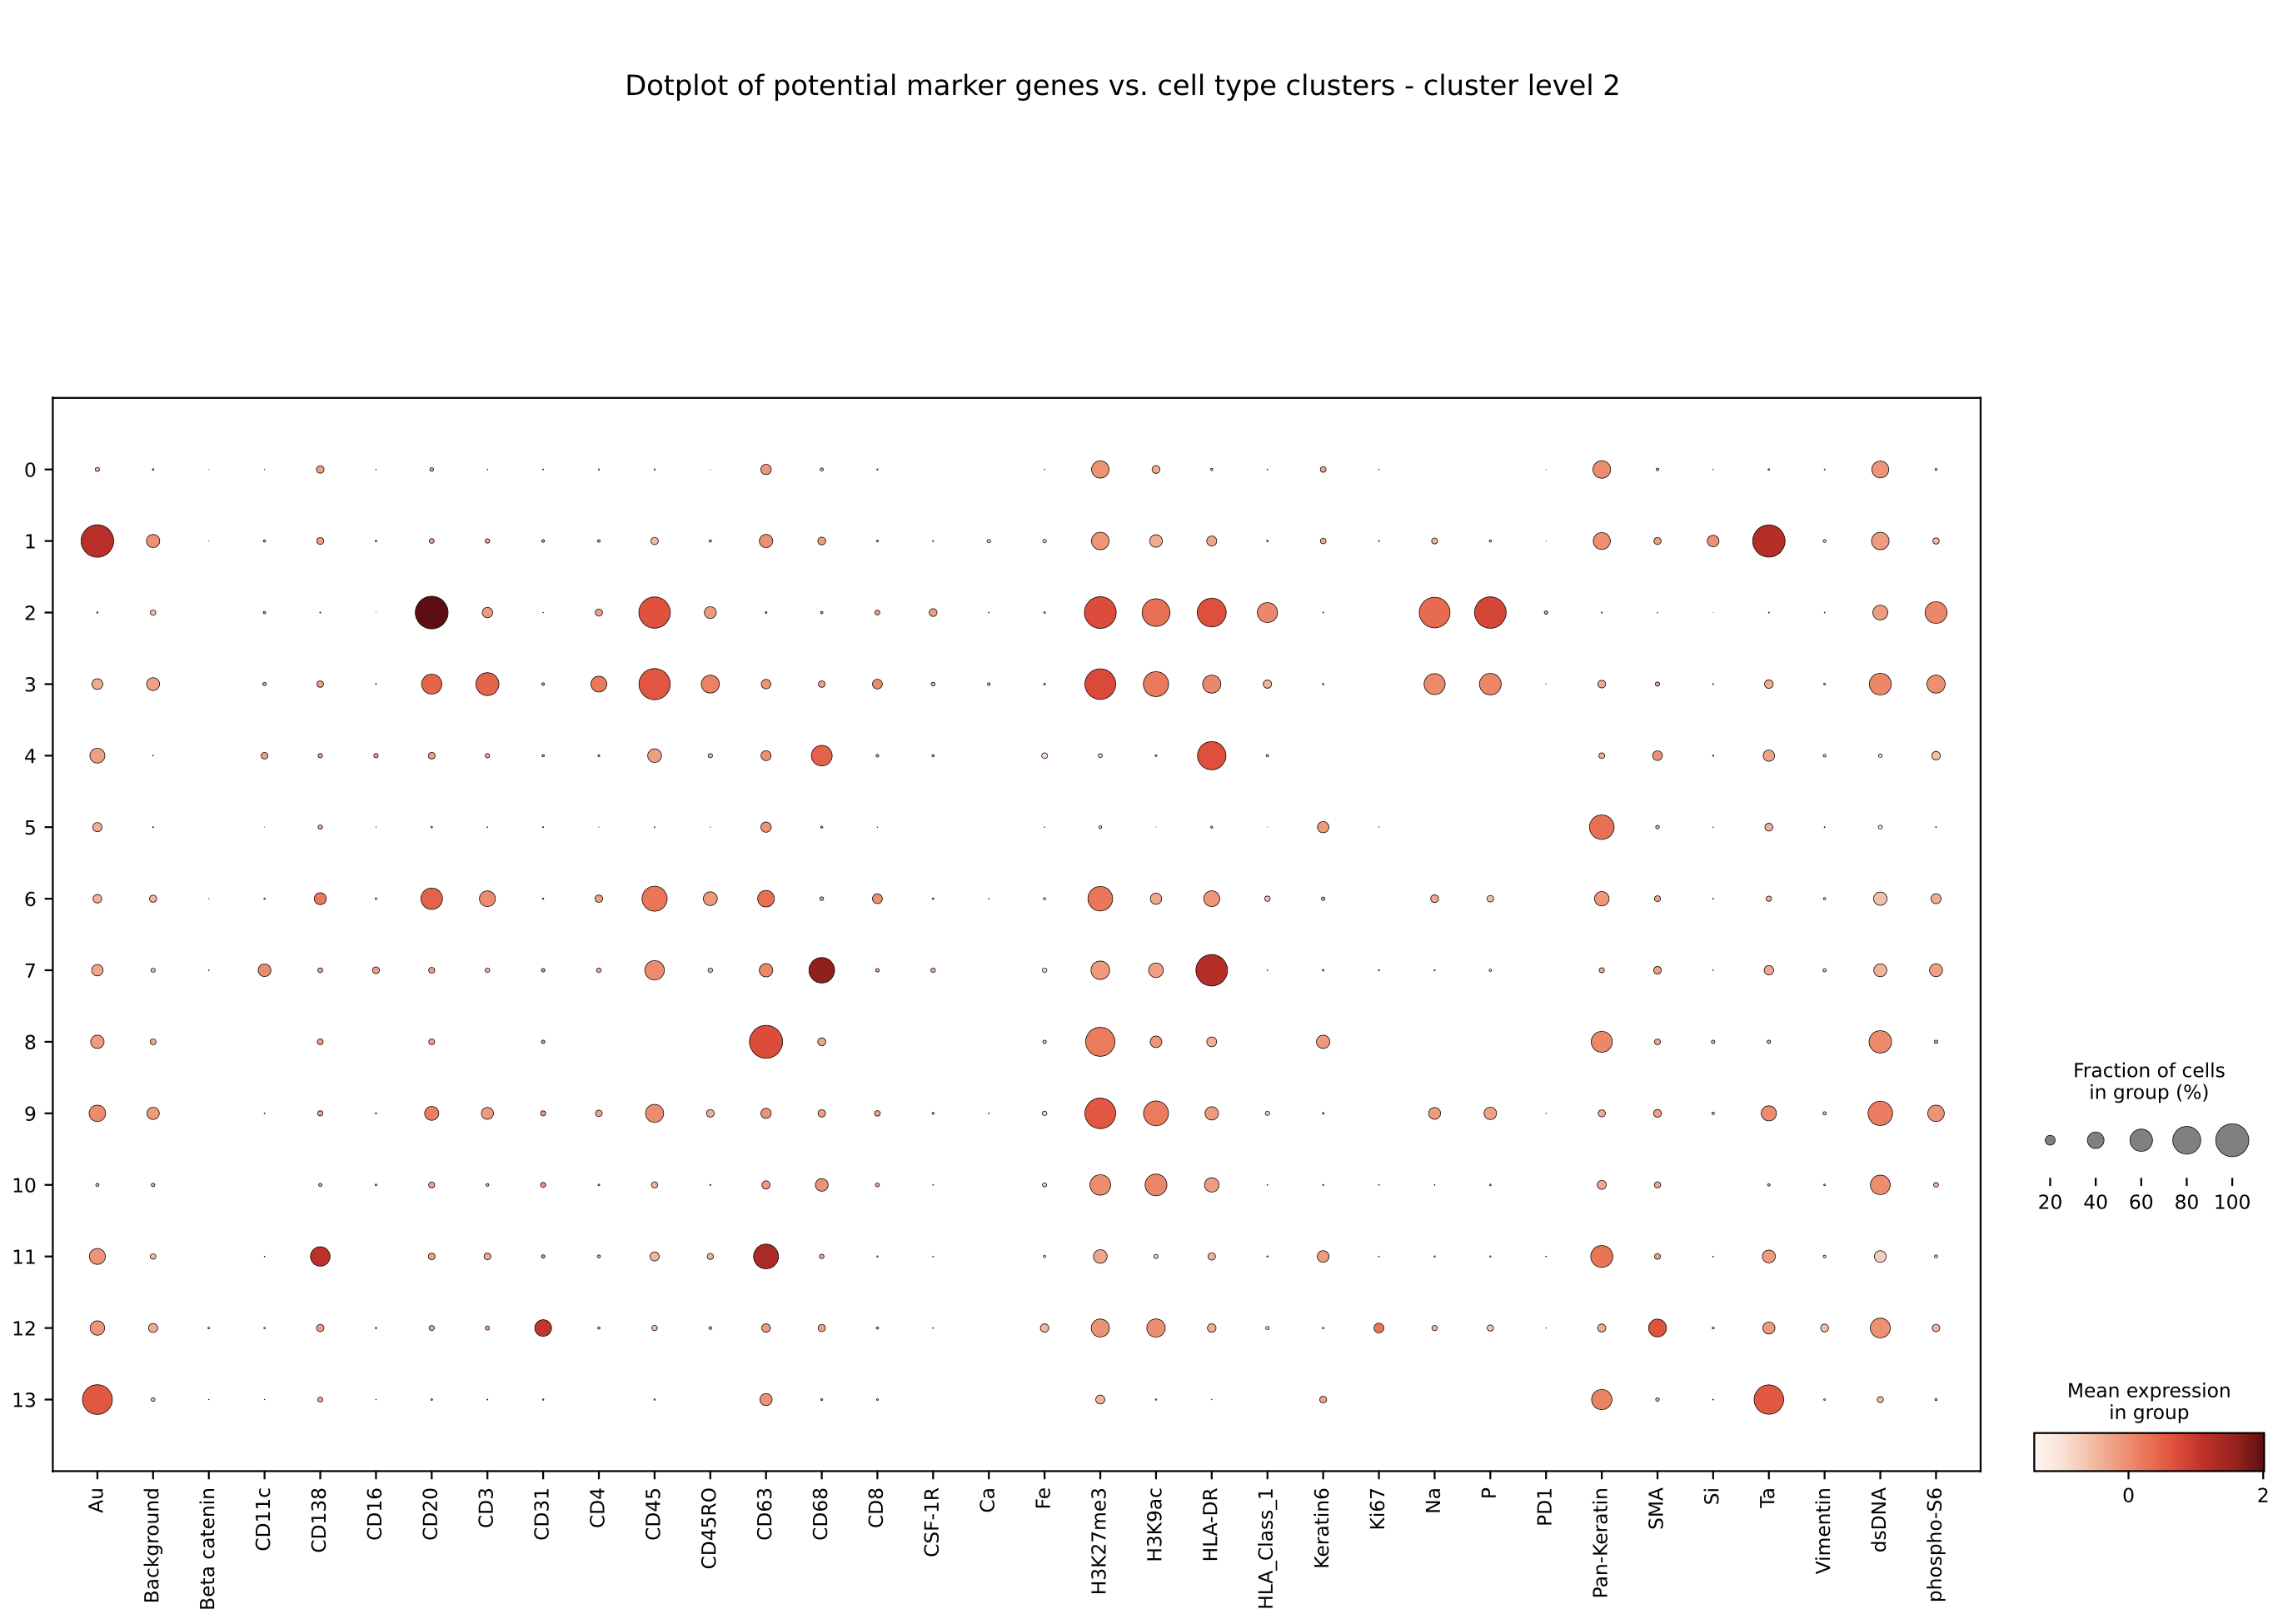
- Dotplot of potential marker genes vs. cell type clusters (example below for patient id: 1 of the TNBC MIBI dataset)
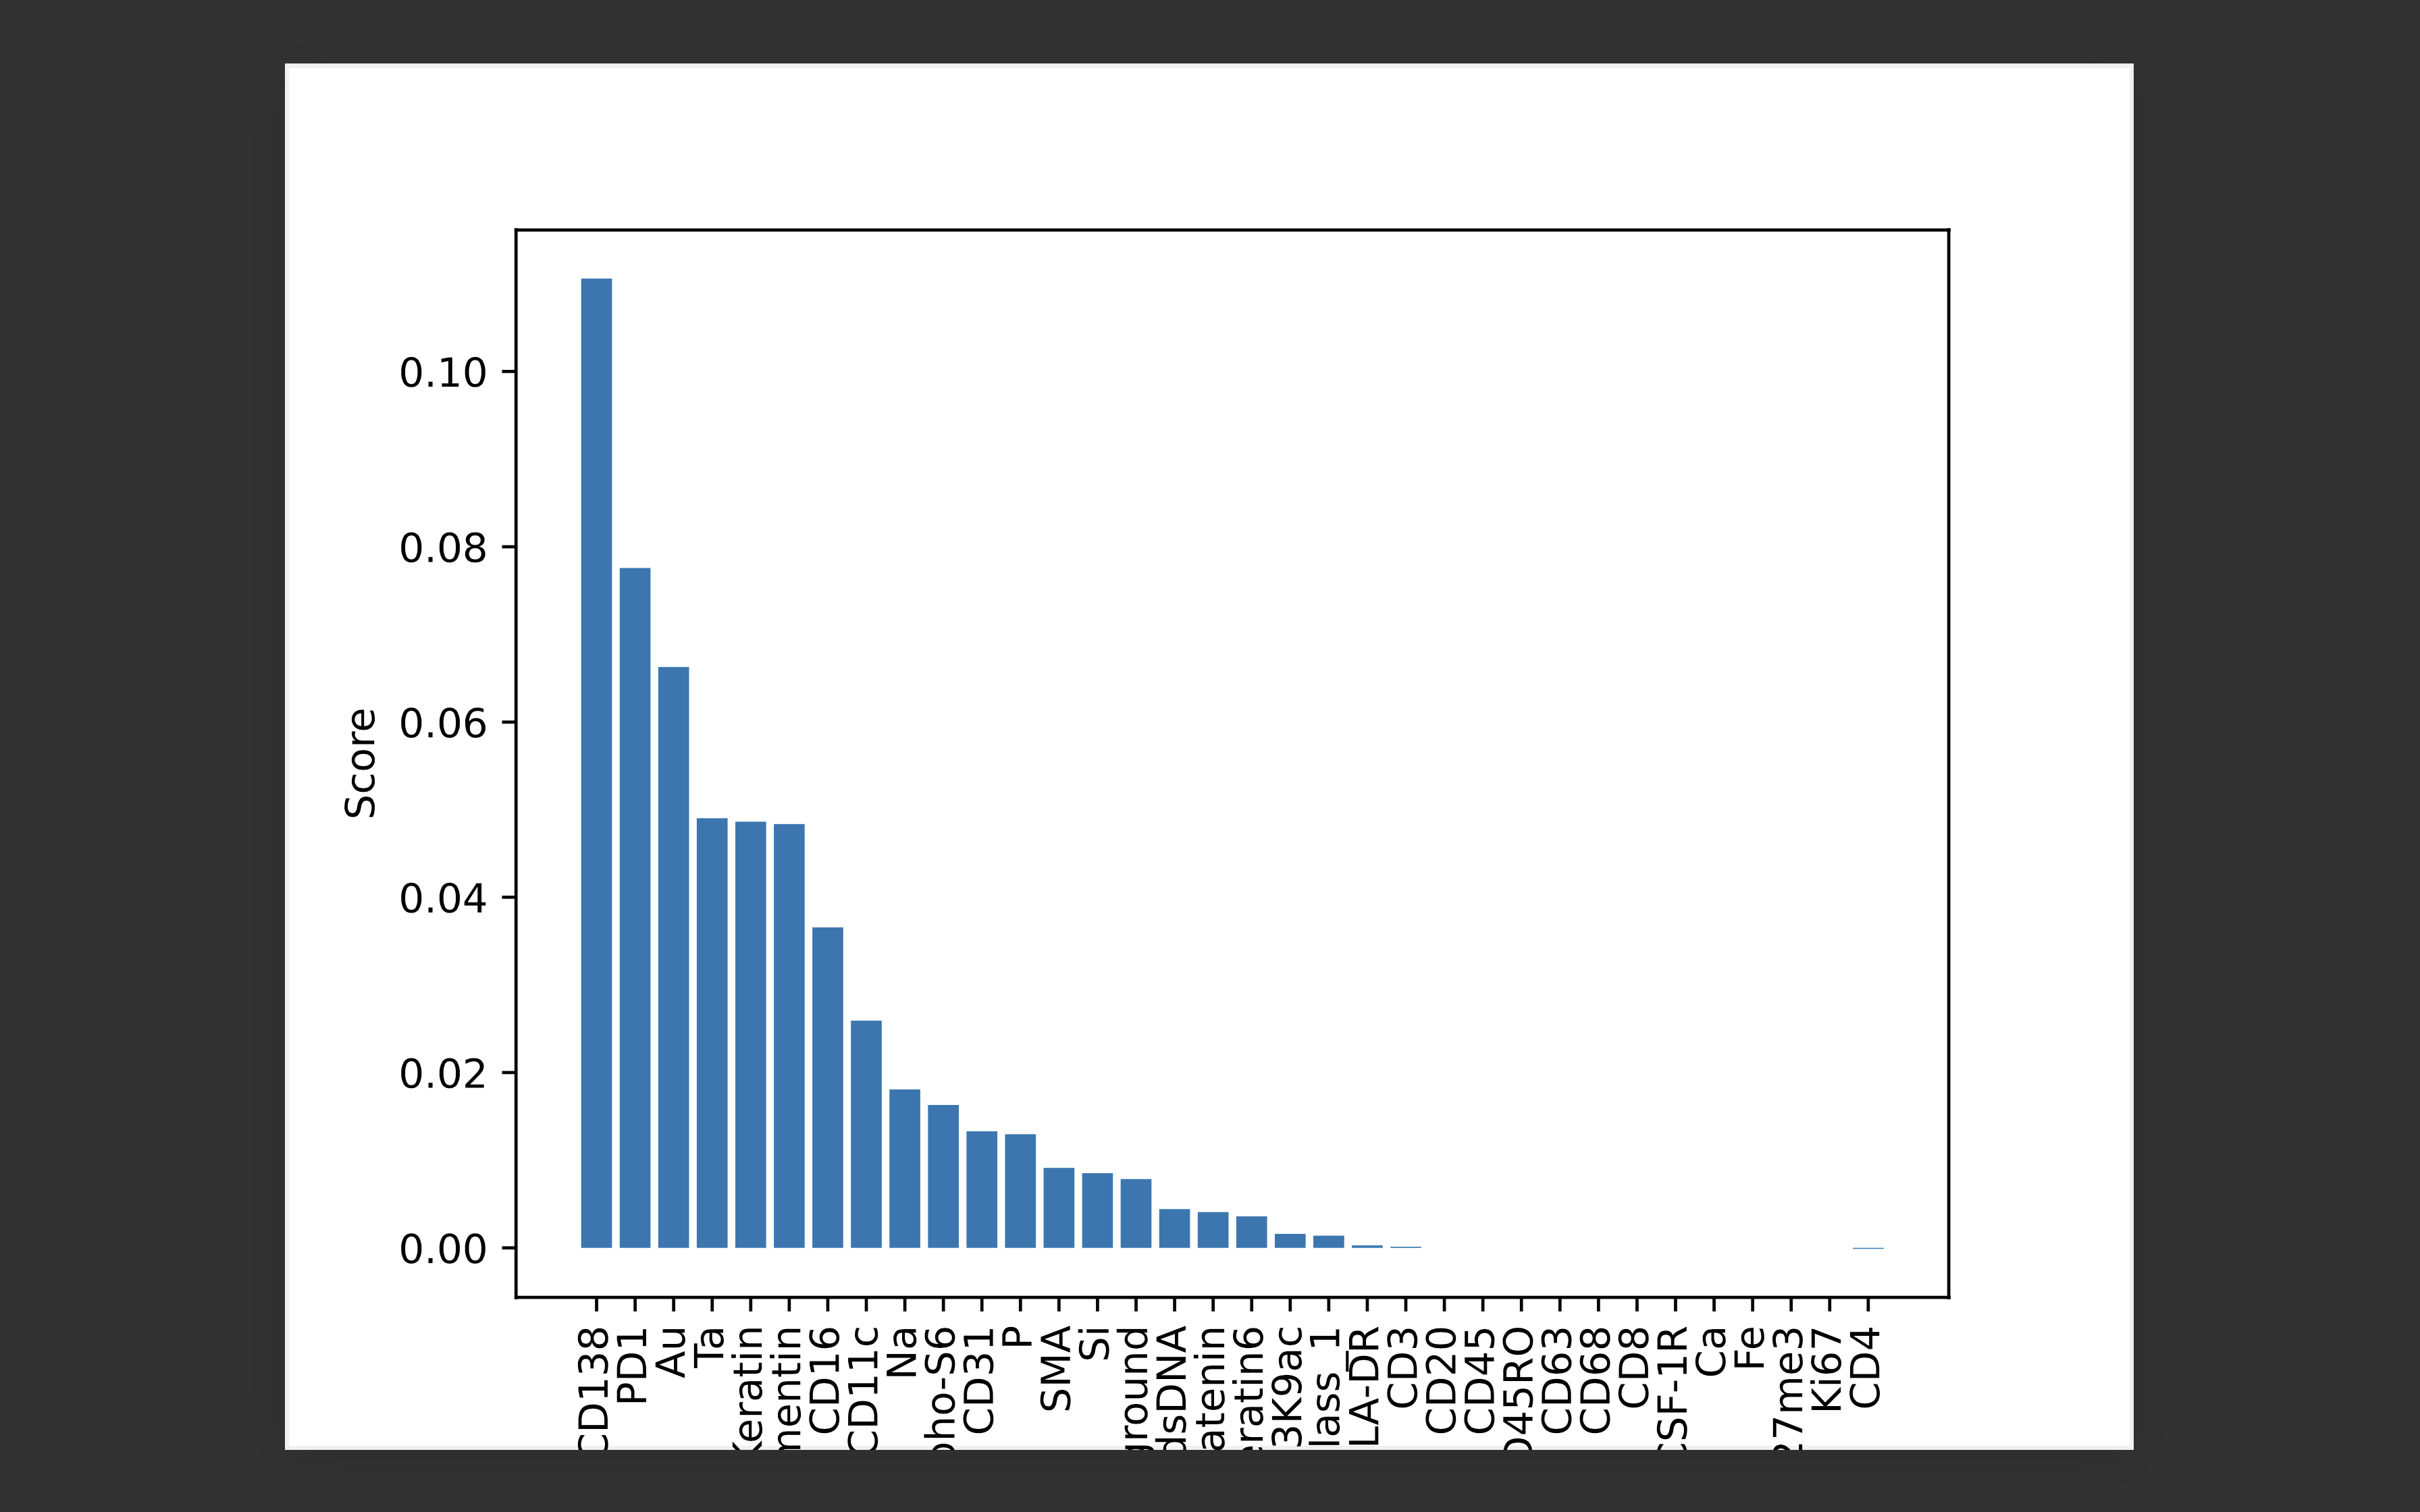
- In this section, we compute and visualize importances of essential proteins that drive clustering results.
Open command prompt/ terminal, then run:
python3 2_visualize_importances_of_essential_proteins_for_clustering.py <adata_pickle_path> <essential_proteins_per_patient_pickle_path>The positional arguments are:
[1] adata_pickle_path                                       Description: Specify path to anndata pickle data; type=str
[2] essential_proteins_per_patient_pickle_path              Description: Specify path to essential proteins dictionary generated from the clustering (previous step); type=str
The outputs are:
-
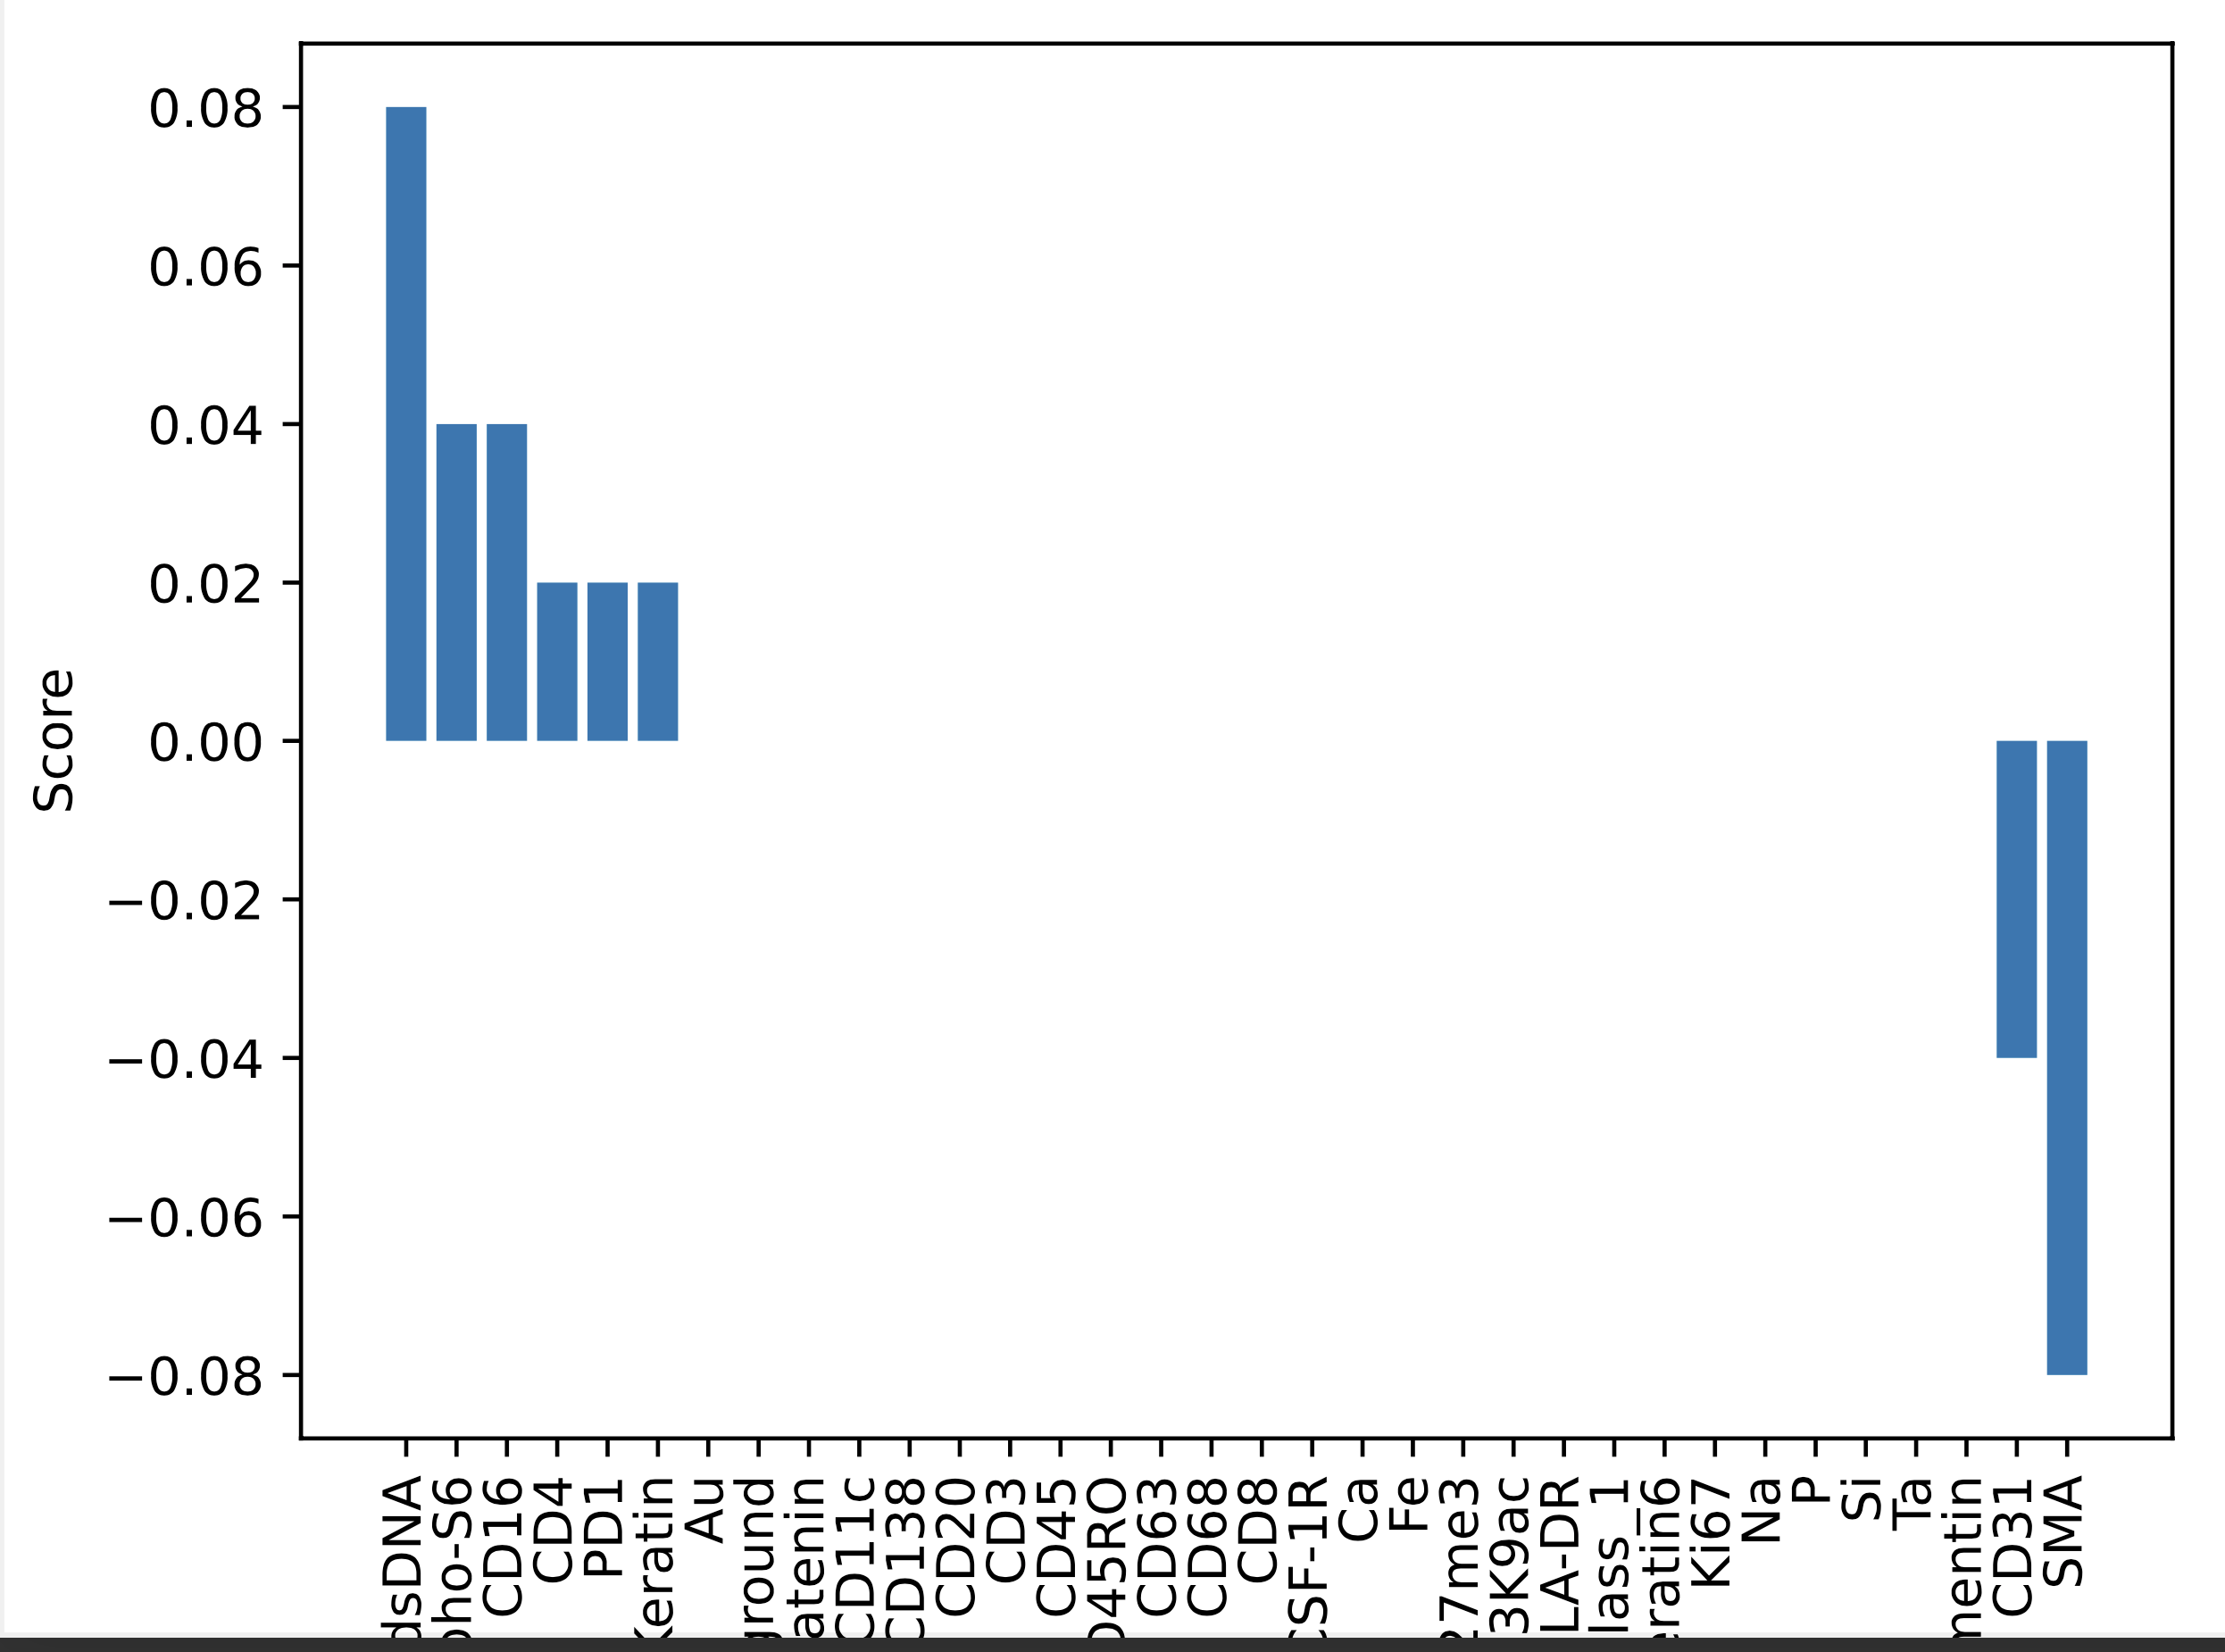
Feature importance scores calculated using permutation importance on one-vs-all classifier for patient id: 1 in the TNBC MIBI dataset:
-
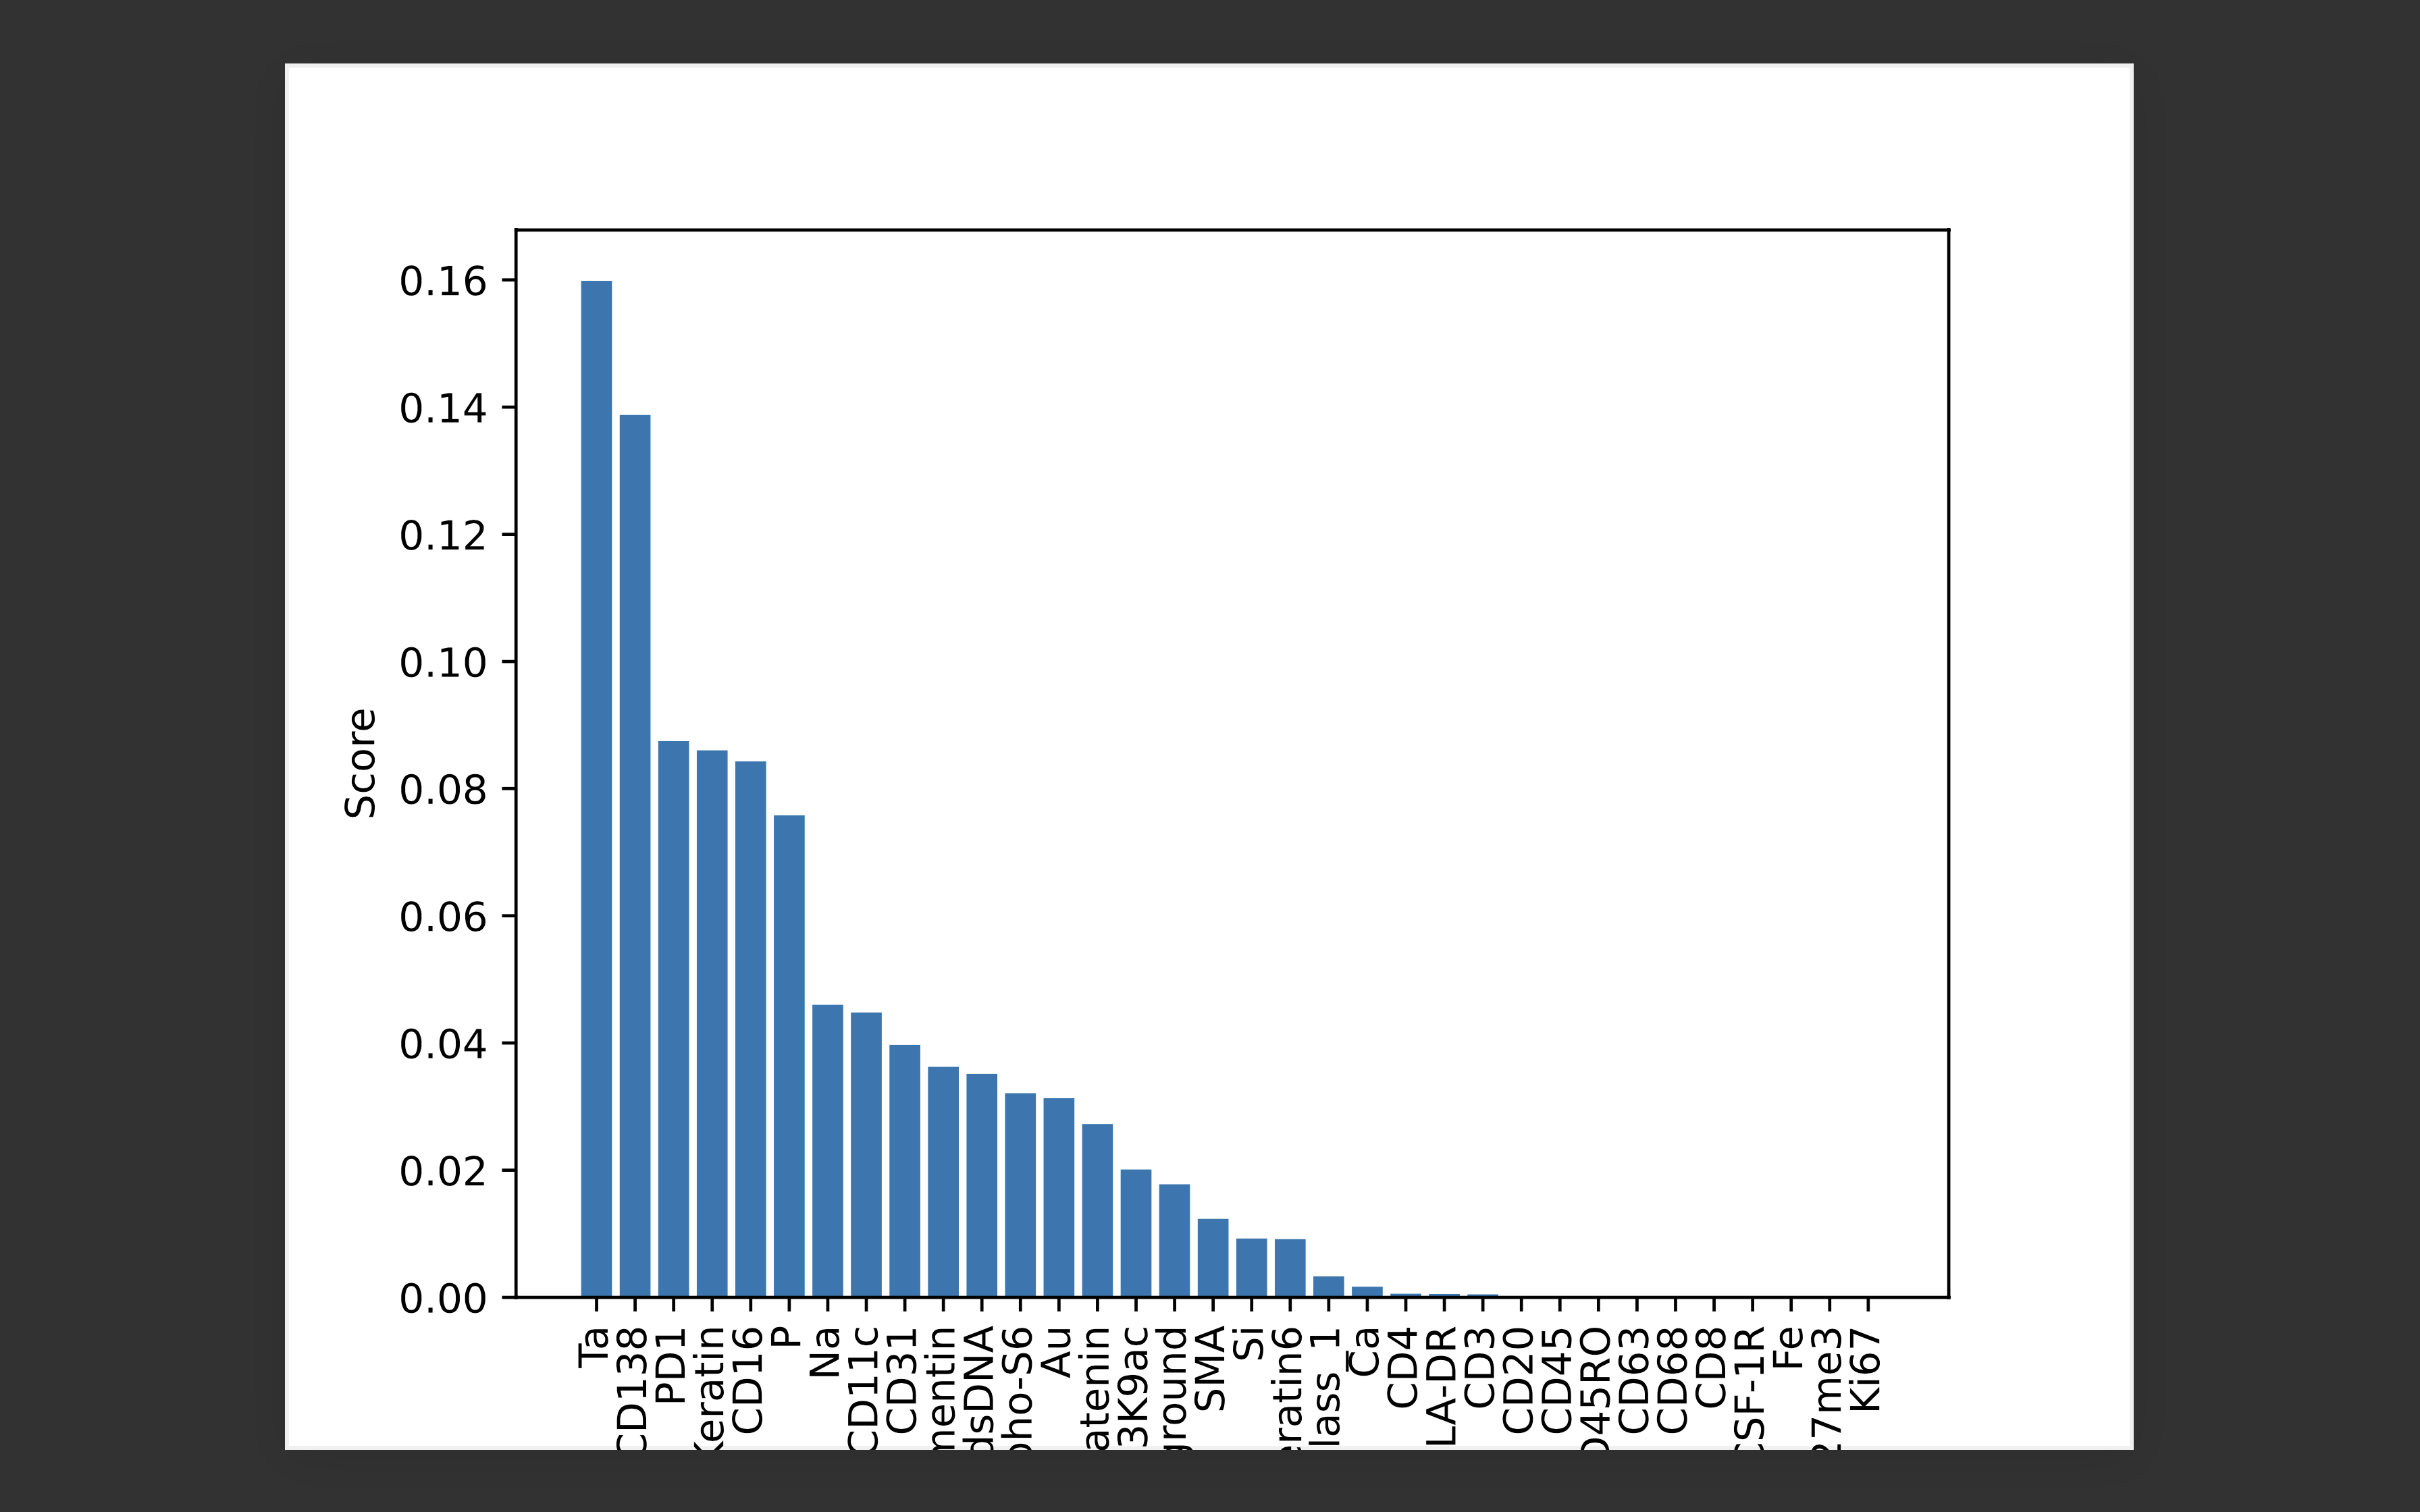
Feature importance scores calculated using Gini index on random forest (RF) classifier for patient id: 1 in the TNBC MIBI dataset:
-
Feature importance scores calculated using permutation importance on random forest (RF) classifier for patient id: 1 in the TNBC MIBI dataset:
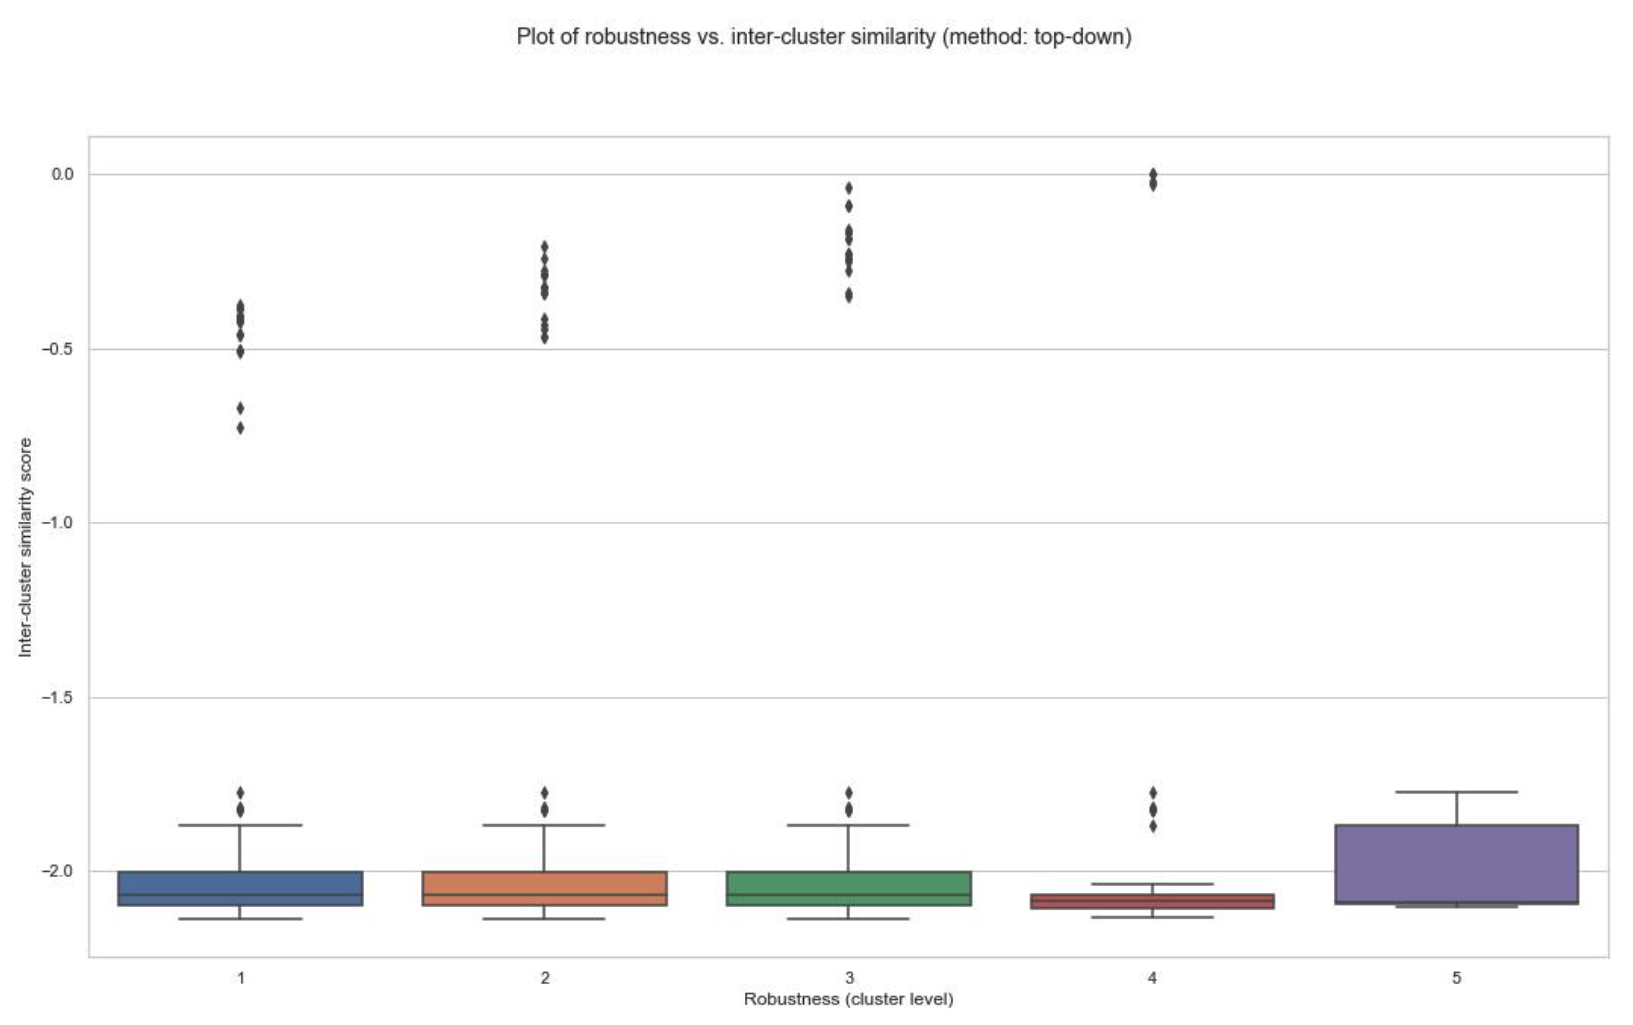
- The similarity scores between clusterings have been obtained for all patients, and their distributions have been plotted against cluster level in the schist nested model.
Open command prompt/ terminal, then run:
python3 3_plot_of_robustness_vs_intercluster_similarity.py <adata_pickle_path> --method <method>The positional arguments are:
[1] adata_pickle_path Description: Specify path to anndata pickle data; type=str
The optional arguments are:
[1] --method                            Description: Specify cluster agreement method between clusterings; type=str; options={"top-down", "bottom-up"}; default='top-down' [read more below]

Note: The schist hierarchical clustering method is agglomerative, meaning bottom-up.
The outputs are:
- Plot of robustness vs. inter-cluster similarity (example below for patient id: 1 of the TNBC MIBI dataset):
(A) Top-down cluster mapping:
(B) Bottom-up cluster mapping:
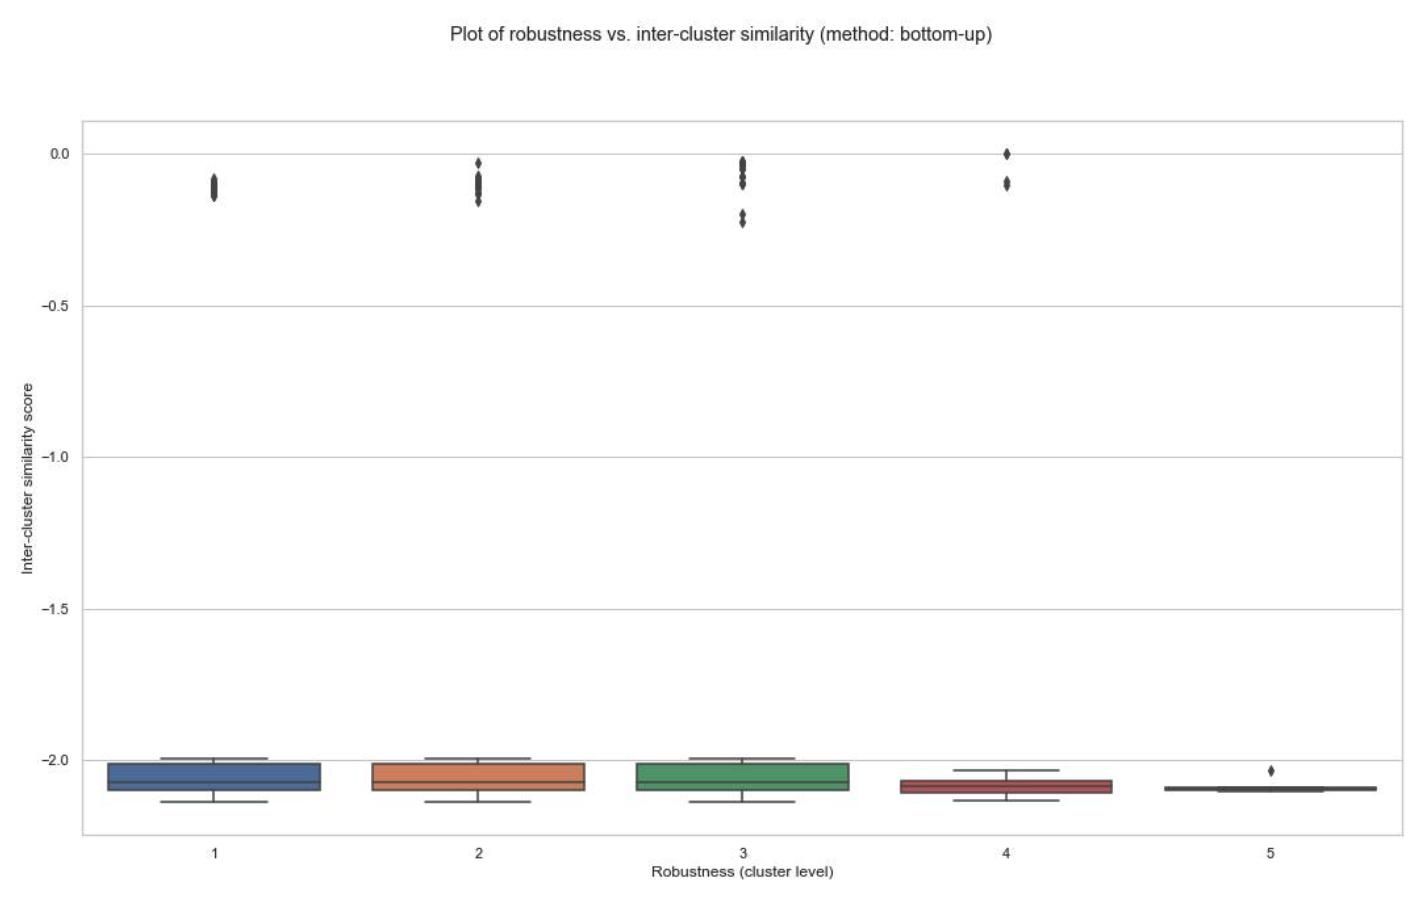
- You can decide on the optimal cluster level based on these plots.
- For our case study on the TNBC MIBI dataset dataset, we will just set optimal cluster level
$n = N-1$ , where$N$ is the highest cluster level in the schist agglomerative model, where there is just one cluster.
- This may further help some users decide how many cluster levels to set for the schist agglomerative clustering model.
Open command prompt/ terminal, then run:
python3 4_plot_no_of_cluster_levels_vs_no_of_clusters_per_cluster_level.py <adata_pickle_path> <clusterings_patientLevel_dict_path>The positional arguments are:
[1] adata_pickle_path                                                     Description: Specify path to anndata pickle data; type=str
[2] clusterings_patientLevel_dict_path                                    Specify path to clustering combinations calculated in the previous step (saved as 'clusterings_patientLevel_dict.pkl' in step **II.i. Maximum bipartite matching between clusterings**)
The outputs are:
- Plot of no. of clusters per cluster level across all samples in the TNBC MIBI dataset:

- Generate protein correlation matrix.
- Subsequently, perform MWU-test on protein correlation values between conditions.
- Retain correlations with p-values<0.05 as important protein-protein correlations.
Open command prompt/ terminal, then run:
python3 5_DA_protein_correlations.py <adata_pickle_path> <dependent_variable_name>The positional arguments are:
[1] adata_pickle_path                   Description: Specify path to anndata pickle data; type=str
[2] dependent_variable_name             Description: Specify the name of the dependent variable; type=str

Note: The aforementioned variable <dependent_variable_name> should be present under observation metadata (obsm) of the anndata onject containing gene/ protein expression.
The outputs are:
- Count all cells containing all N-combinaions of proteins present above the threshold.
- Subsequently, perform MWU-test on no. of cells protein profiles expressed in, across conditions.
- Retain protein profiles with p-values<0.05 as significant protein profiles.
Open command prompt/ terminal, then run:
python3 6_DA_multiple_protein_profiles.py <adata_pickle_path> <dependent_variable_name> --N <N> --threshold <threshold>The positional arguments are:
[1] adata_pickle_path                   Description: Specify path to anndata pickle data; type=str
[2] dependent_variable_name             Description: Specify the name of the dependent variable; type=str

Note: The aforementioned variable <dependent_variable_name> should be present under observation metadata (obsm) of the anndata onject containing gene/ protein expression.
The optional arguments are:
[1] --N                         Description: Specify number of proteins to be analyzed within protein profile; type=int, default=2
[2] --threshold                 Description: Specify minimum value over which protein expressions are considered for further analyses; type=float, default=0.5
The outputs are:
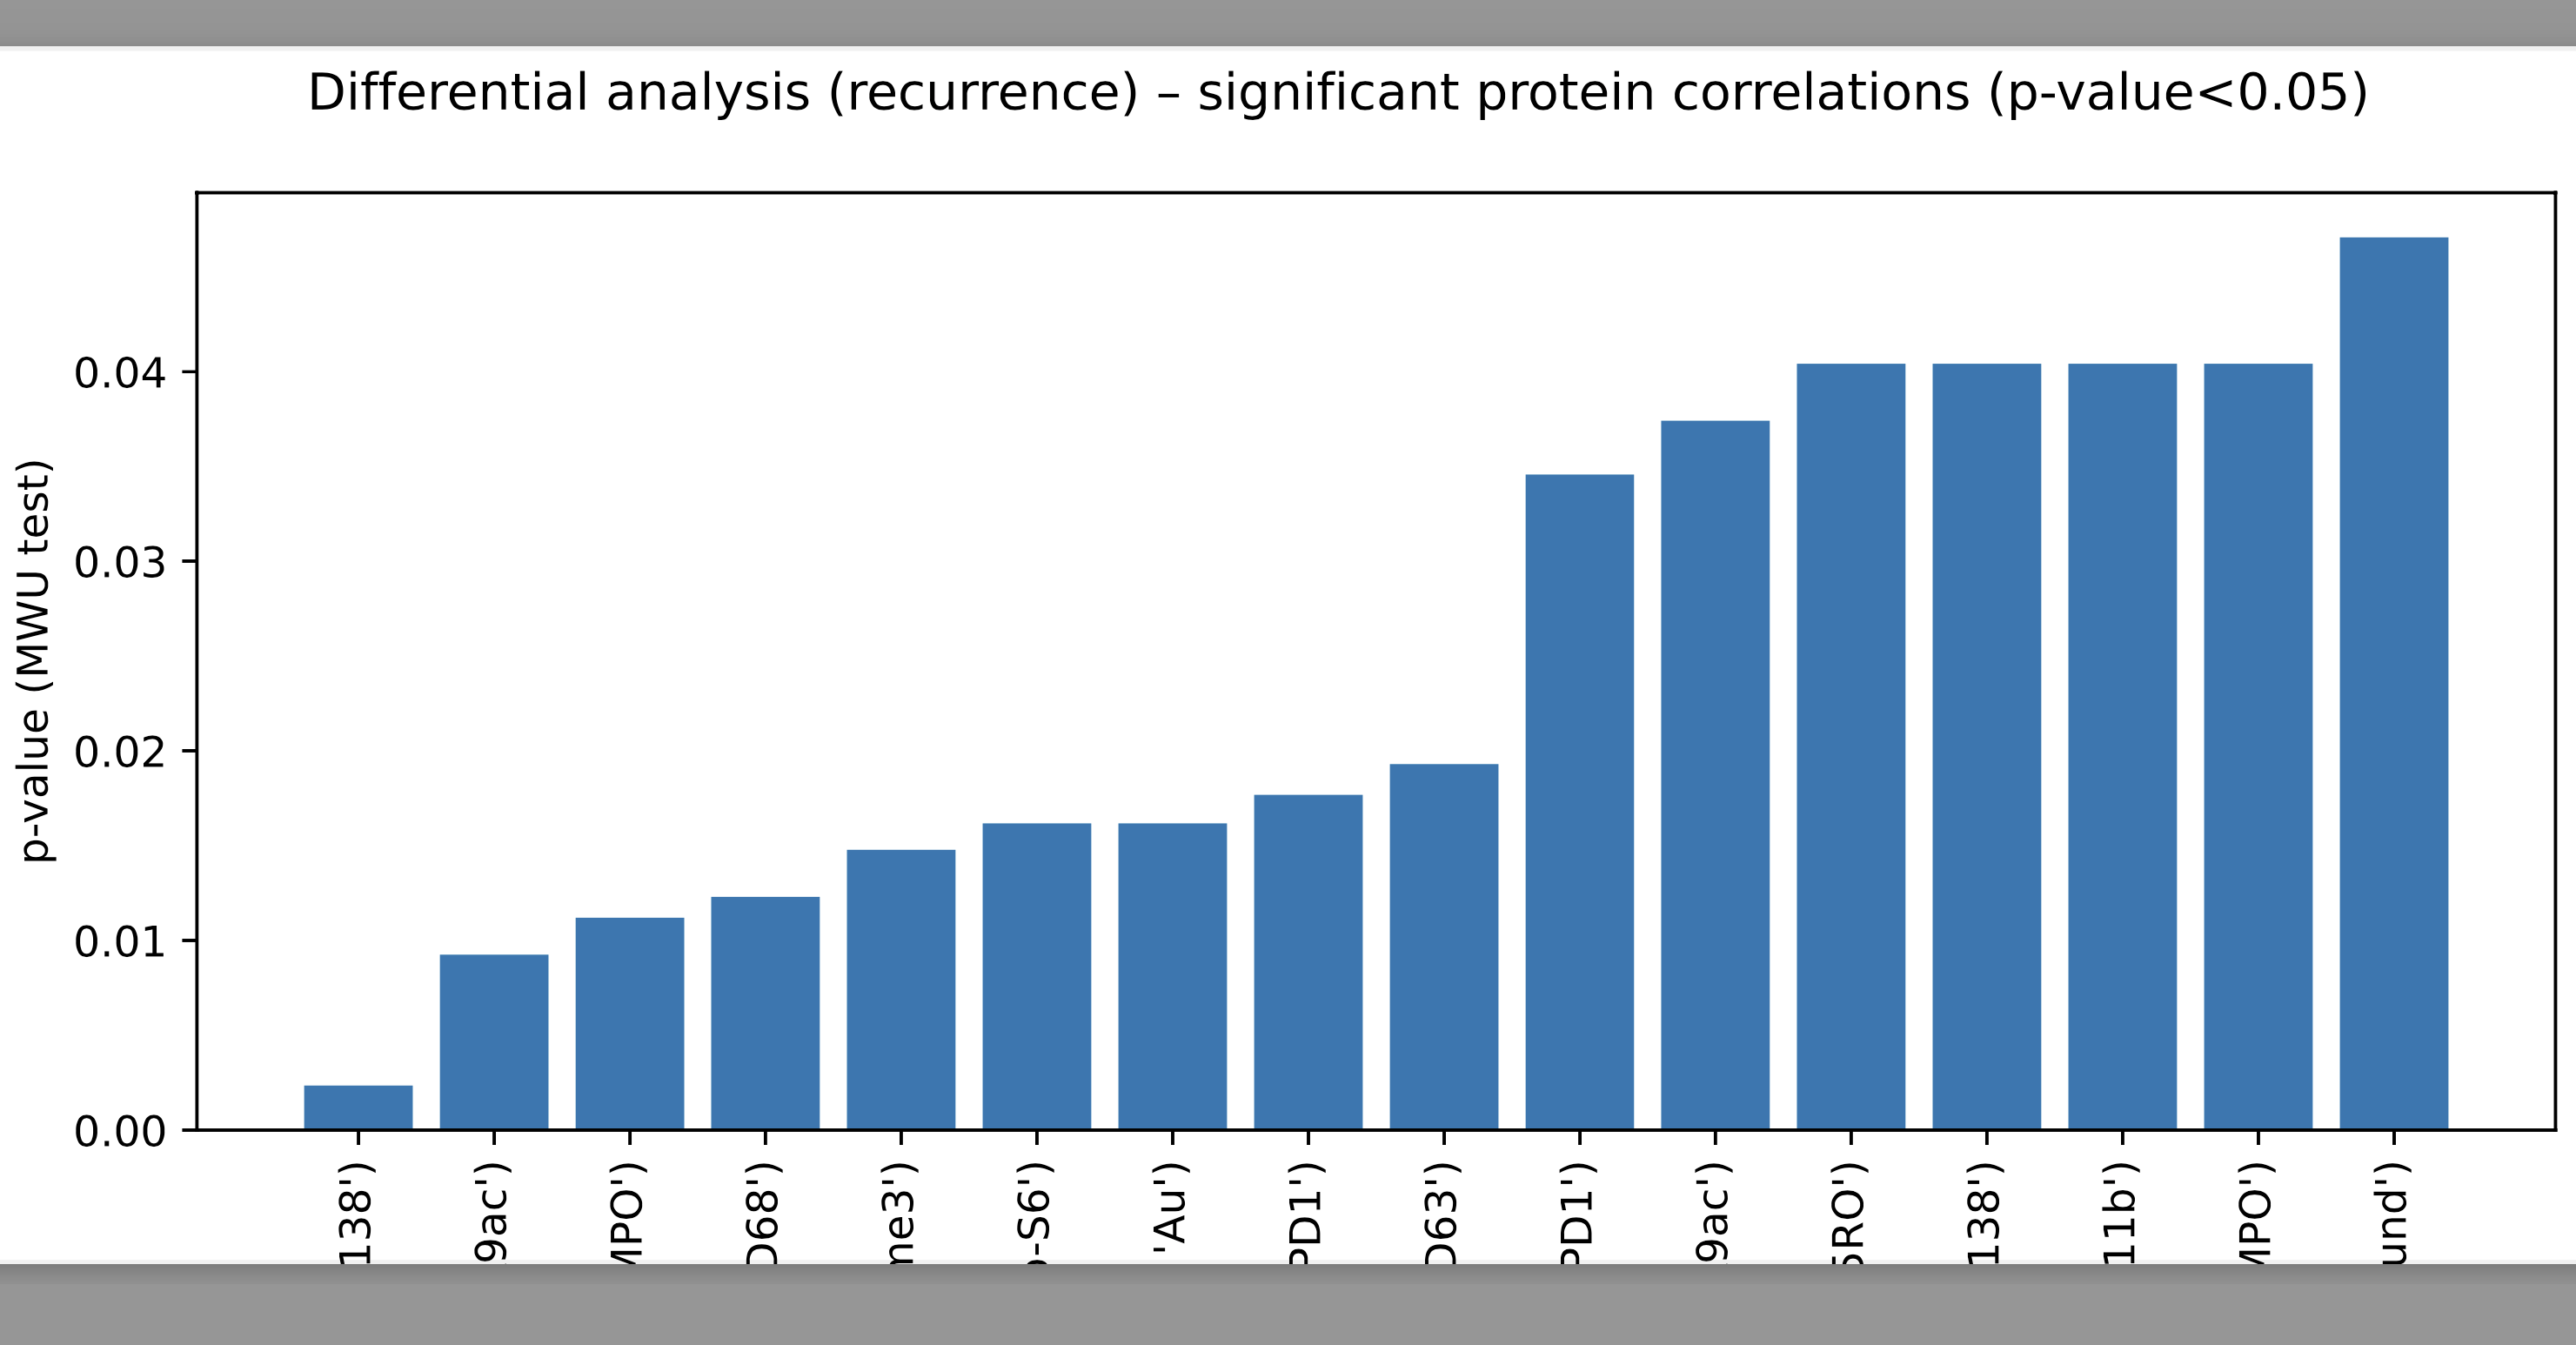
- Bar plot of significant, multiple protein coexpression p-values
Nothing found for N=2, threshold=0.5, across all patients in the TNBC MIBI dataset.

