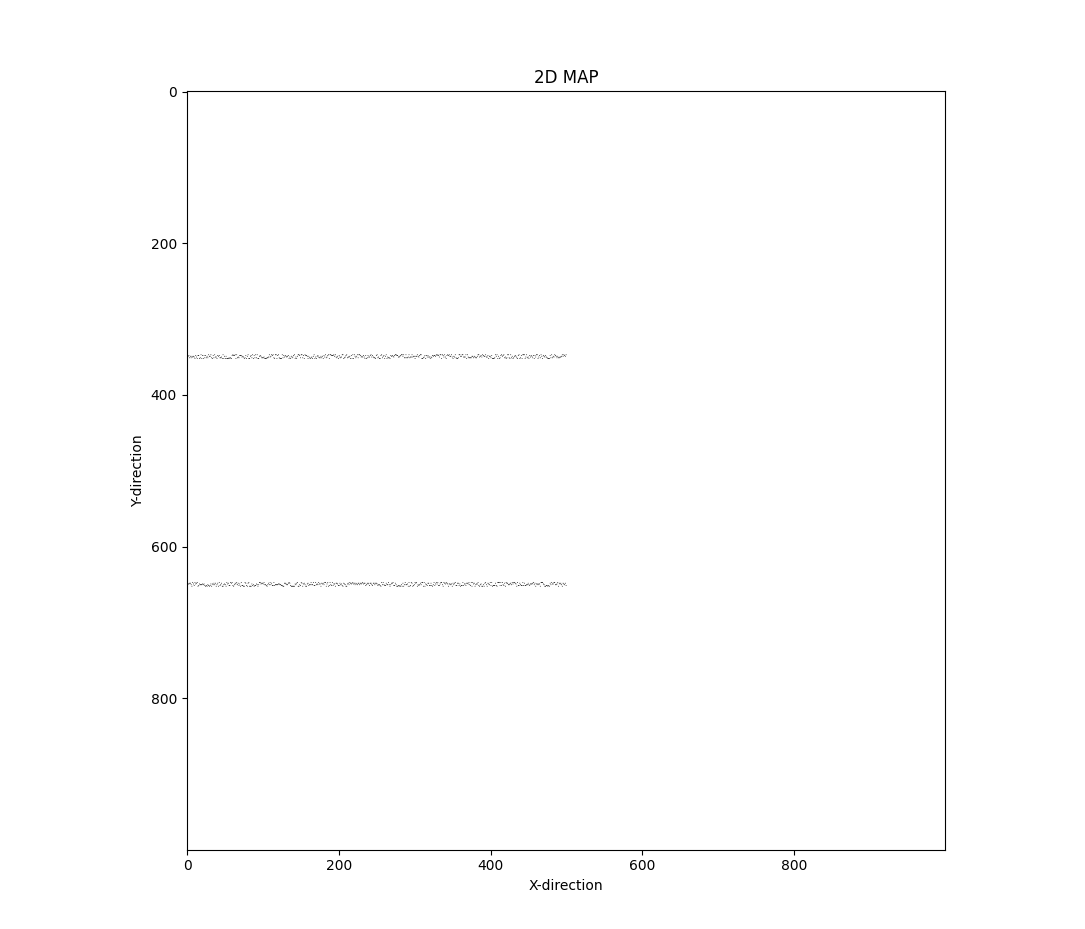
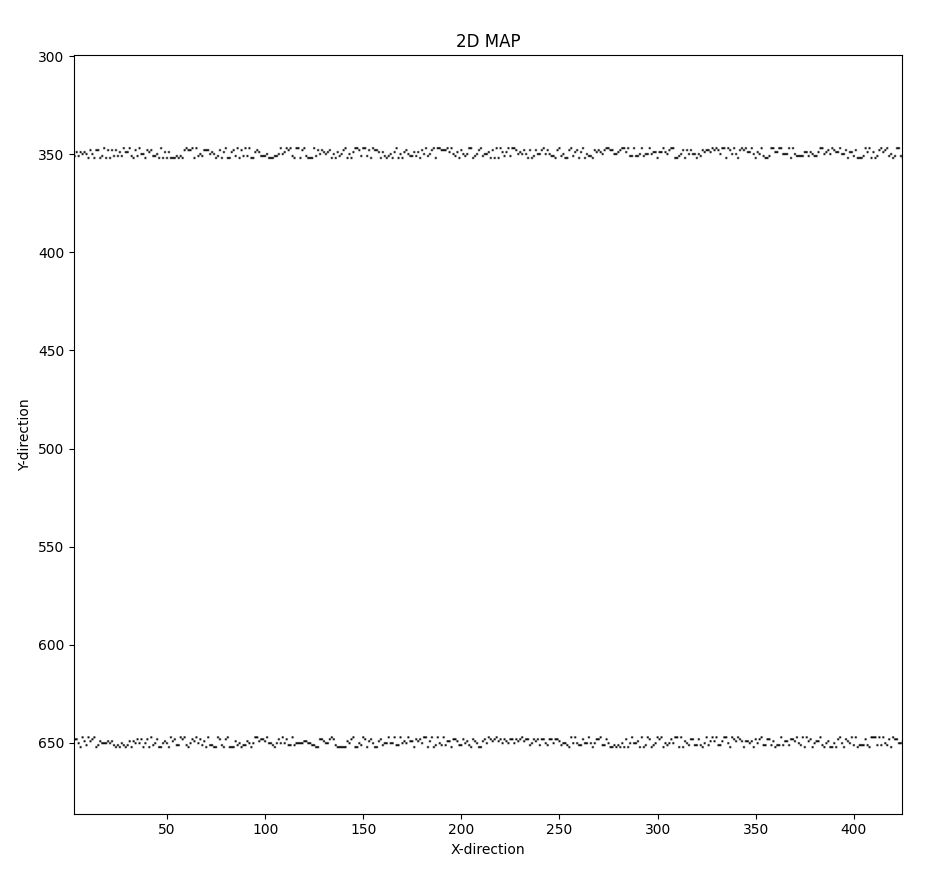
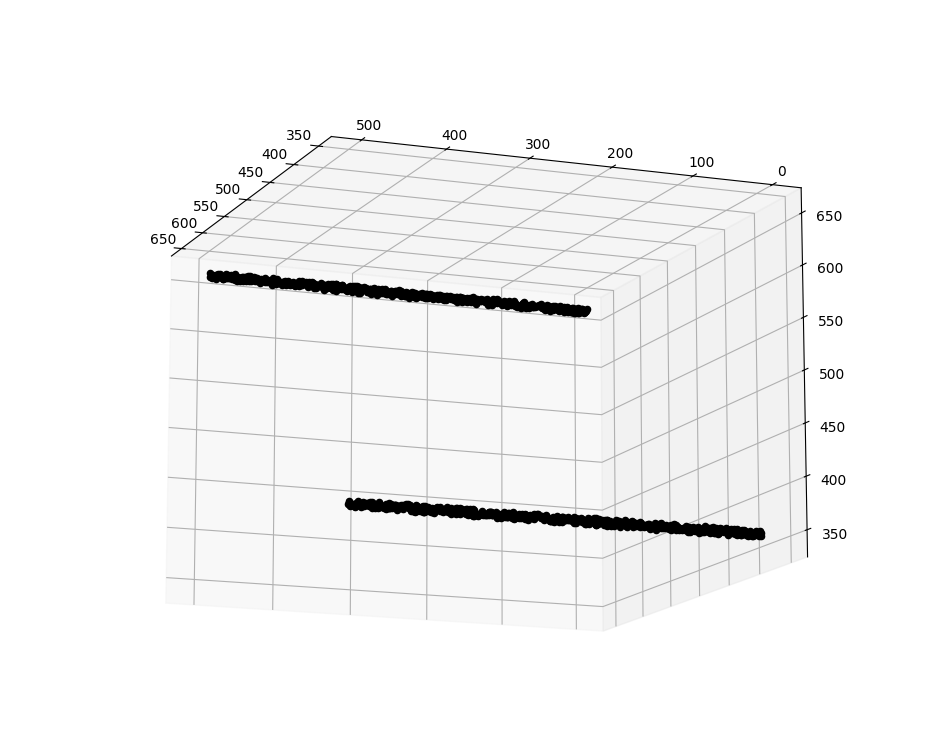
A set of python programs to make a map (2D or 3D).
This repository contains python programs for using simple x, y and z co-ordinates to plot the results in either 2D (only x and y) and in 3D (x, y and z). It can be used a make Graphes, Maps, Figures, Diagrams, Lines, Surfaces, Planes, Points and much more
If you find this Repository useful , please give it a star ⭐
- First, clone the repository and navigate into it:
git clone https://github.com/blaiserods26/MappingInPython- Install the necessary dependencies:
pip install requirements.txt- To run the main script:
python3 2Dmap.py # or 3Dmap.py for 3D mapFor the 2D mapping program, the input has to be the x and y co-ordinates of the points. Input Format: 0(X Co-ordinate < 1000) 0(Y Co-ordinate < 1000) 0(Counter != 1 until all the points are inputed) Note : The upper limit of the co-ordinates is 1000 but it can be changed in the code by changing the length of the array.
arr = [[0]*5000 for i in range(5000)] For the 3D mapping program, the input has to be the x, y and z co-ordinates of the points. Input Format: 0(X Co-ordinate < 1000) 0(Y Co-ordinate < 1000) 0(Y Co-ordinate < 1000) 0(Counter != 1 until all the points are inputed) Note : The upper limit of the co-ordinates is 1000 but it can be changed in the code by changing the length of the array.
arr = [[[0]*5000 for i in range(5000)] for j in range (5000)]Sample inputs are provided in the input folder.
This project is licensed under the terms of the MIT license. See the LICENSE file for the full text of the license.


