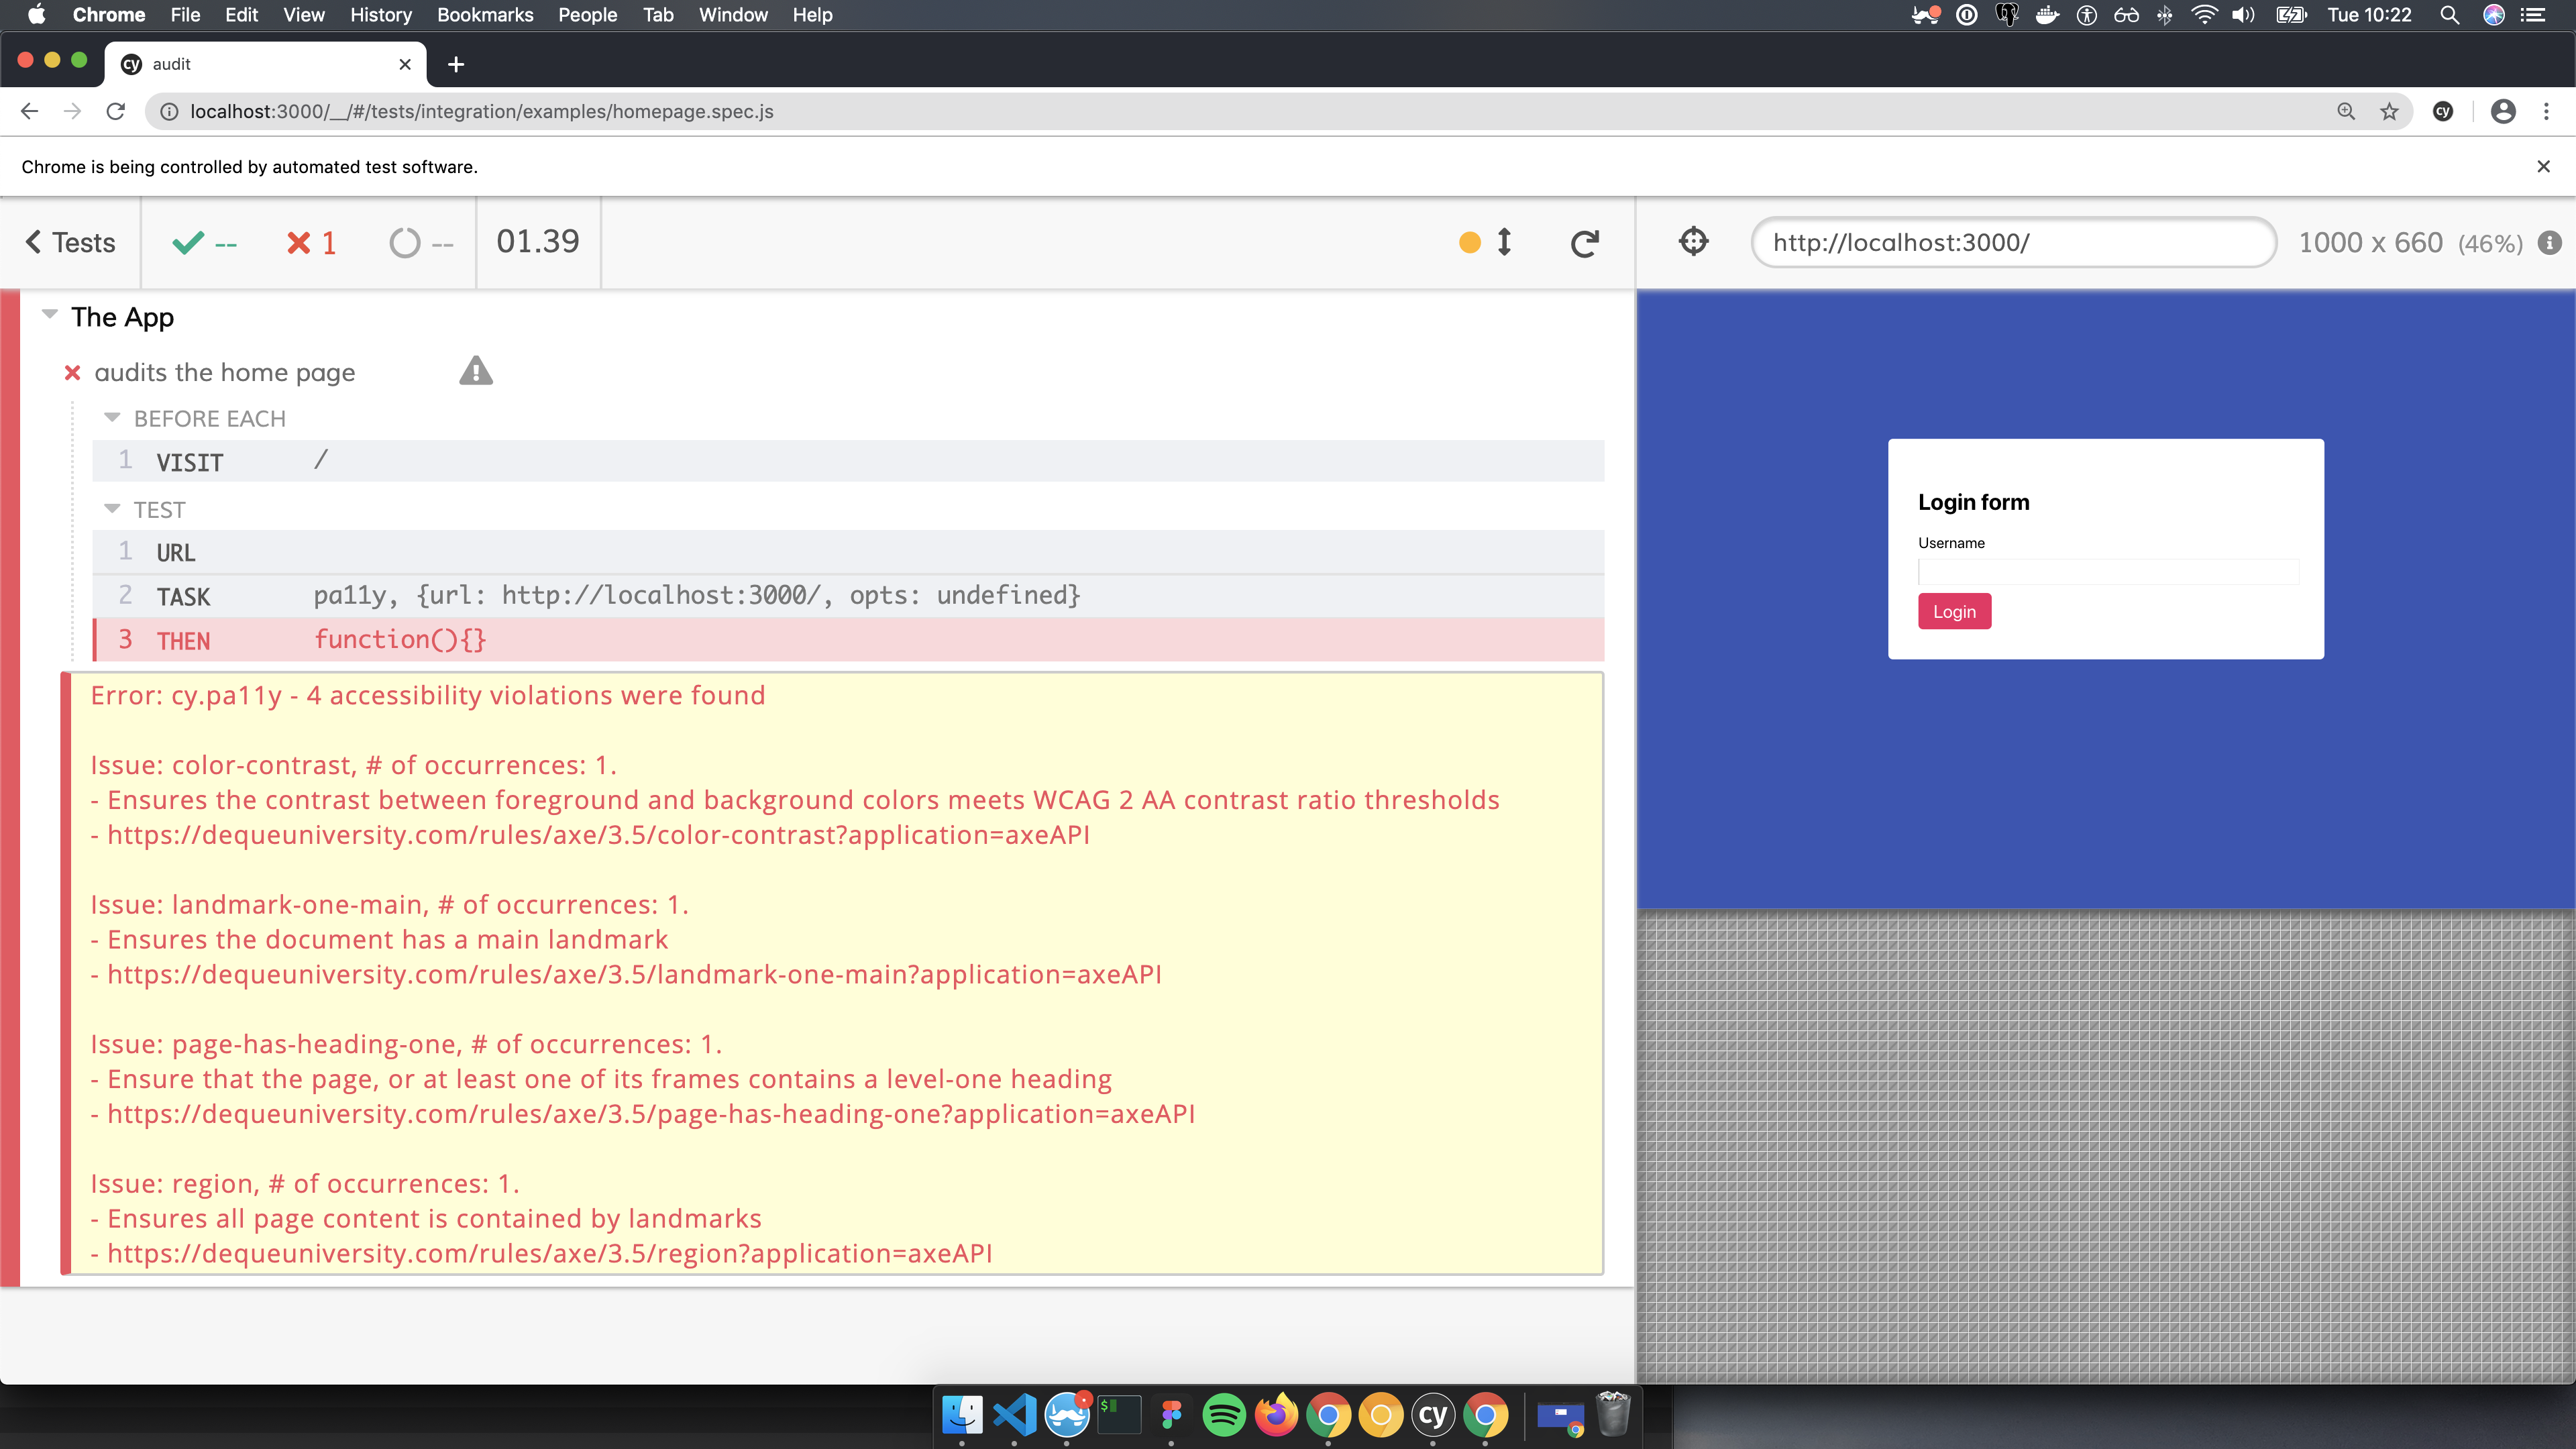
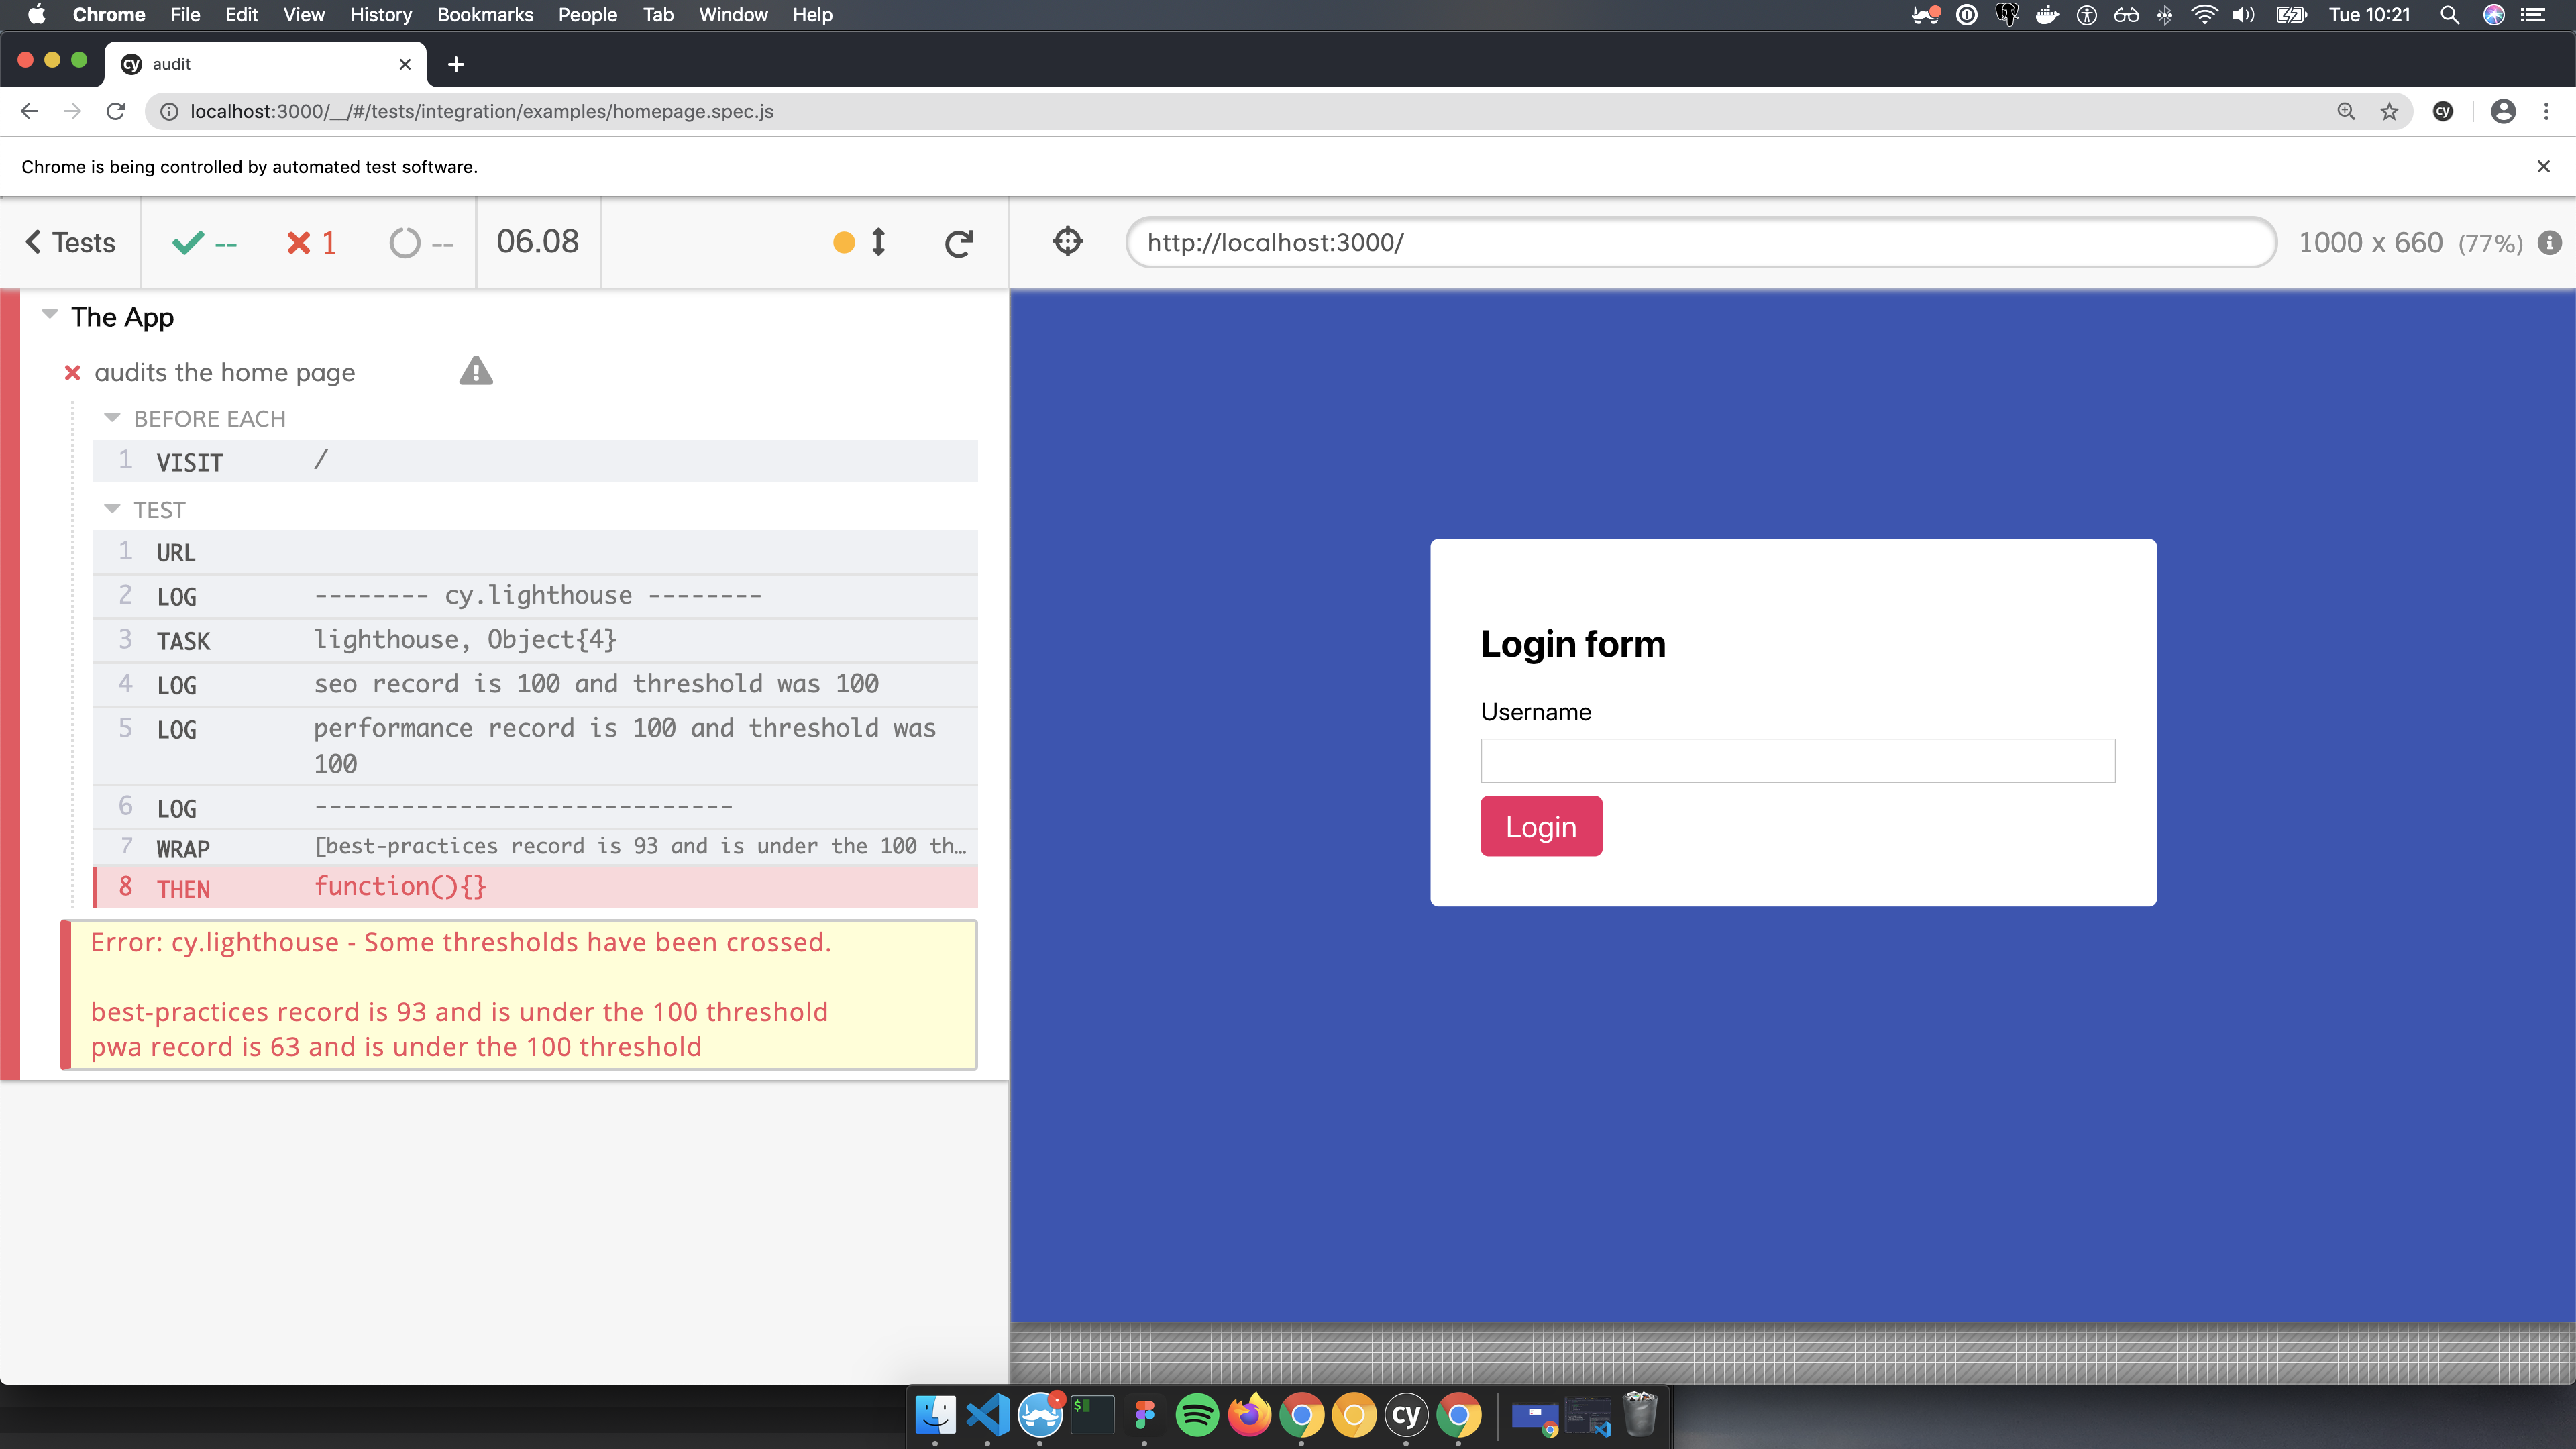
Run Lighthouse and Pa11y audits directly in your Cypress E2E test suites
The tools we can use nowadays to verify the quality of our applications are awesome. They help us get a huge amount of confidence about what we ship in production and alert us when some kind of regression occurs.
- Cypress has made business oriented workflow verification super easy and fun
- Lighthouse has provided incredible tools to verify the performance of an application
- Pa11y provides multiple tool to control the accessibility state of our applications in a wonderful way
The problem is that they run in their own context and with their own internal tricks for authentication and page browsing.
The idea of cypress-audit is to unify all of this by providing some Cypress Custom Commands so that you can use these tools directly inside your Cypress tests, close to your custom shortcut for navigation and login.
To make cypress-audit working in your project, you have to follow these 3 steps:
- In your favorite terminal:
$ yarn add -D cypress-audit
# or
$ npm install --save-dev cypress-audit- In the
cypress/plugins/index.jsfile:
const { lighthouse, pa11y, prepareAudit } = require("cypress-audit");

module.exports = (on, config) => {
  on("before:browser:launch", (browser = {}, launchOptions) => {
    prepareAudit(launchOptions);
  });

  on("task", {
    lighthouse: lighthouse(), // calling the function is important
    pa11y: pa11y(), // calling the function is important
  });
};- In the
cypress/support/commands.jsfile:
import "cypress-audit/commands";After completing the Installation section, you are now able to use the cy.audit and cy.pa11y commands inside your tests.
it("should pass the audits", function () {
  cy.lighthouse();
  cy.pa11y();
});
You can now check the APIs for the cy.lighthouse and cy.pa11y commands here.
You can call cy.pa11Y(opts) with opts being any kind of the pa11y options.
Lighthouse is a tool that is supposed to run against a production bundle for computing the performance and best-practices metrics. But it's widely suggested by Cypress to run their test on development environment. While this seems a bit counter intuitive, we can rely on the Cypress project feature to run some dedicated test suites against production bundles and to have quick feedbacks (or prevent regression) on these metrics.
If you don't provide any argument to the cy.audit command, the test will fail if at least one of your metrics is under 100.
You can make assumptions on the different metrics by passing an object as argument to the cy.audit command:
it("should verify the lighthouse scores with thresholds", function () {
  cy.lighthouse({
    performance: 85,
    accessibility: 100,
    "best-practices": 85,
    seo: 85,
    pwa: 100,
  });
});
If the Lighthouse analysis returns scores that are under the one set in arguments, the test will fail.
You can also make assumptions only on certain metrics. For example, the following test will only verify the "correctness" of the performance metric:
it("should verify the lighthouse scores ONLY for performance", function () {
  cy.lighthouse({
    performance: 85,
  });
});
This test will fail only when the performance metric provided by Lighthouse will be under 85.
While I would recommend to make per-test assumptions, it's possible to define general metrics inside the cypress.json file as following:
{
  "lighthouse": {
    "performance": 85,
    "accessibility": 50,
    "best-practices": 85,
    "seo": 85,
    "pwa": 50
  }
}
Note: These metrics are override by the per-tests one.
You can also pass any argument directly to the Lighthouse module using the second and third options of the command:
const thresholds = {
  /* ... */
};

const lighthouseOptions = {
  /* ... your lighthouse options */
};

const lighthouseConfig = {
  /* ... your lighthouse configs */
};

cy.lighthouse(thresholds, lighthouseOptions, lighthouseConfig);When using custom tools, it can be conveniant to directly access to raw information provided by the specific tool for doing manual things like generating a custom reports.
To do so, you can pass a callback function to the task initializer and when an audit is run, it will be triggered with the raw information.
In the cypress/plugins/index.js file:
const { lighthouse, pa11y, prepareAudit } = require("cypress-audit");

module.exports = (on, config) => {
  on("before:browser:launch", (browser = {}, launchOptions) => {
    prepareAudit(launchOptions);
  });

  on("task", {
    lighthouse: lighthouse(lighthouseReport => {
      console.log(lighthouseReport) // raw lighthouse report
    },
    pa11y: pa11y(pa11yReport => {
      console.log(pa11yReport) // raw pa11y report
    }),
  });
};

