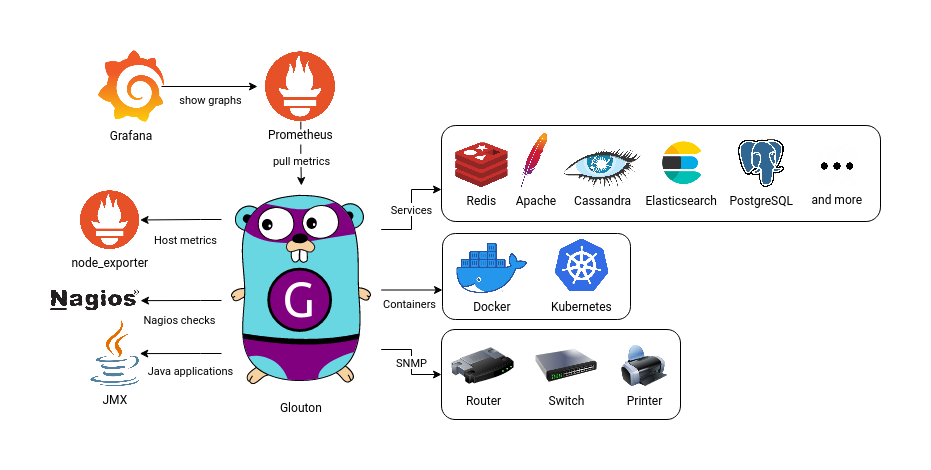
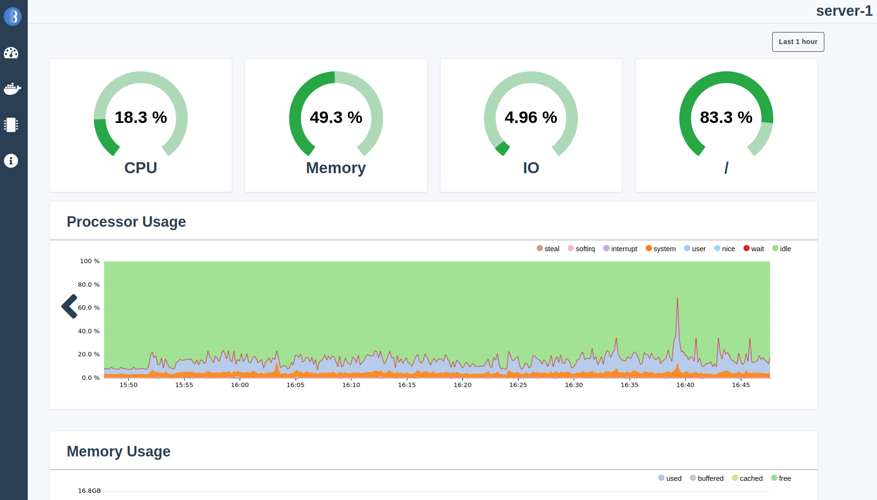
Glouton is a monitoring agent that makes observing your infrastructure easy. Glouton retrieves metrics from node_exporter and multiple telegraf inputs and expose them through a Prometheus endpoint and a dashboard. It also automatically discovers your services to retrieve relevant metrics.
Glouton is the agent used in the Bleemeo cloud monitoring solution. Deploying a robust, scalable monitoring solution can be time consuming. At Bleemeo, we focus on making users life easier. Check out the solution we offer on our website and try it now for free!
- Automatic discovery and configuration of services to generate checks and metrics
- Can be used as the main Prometheus endpoint for another scrapper
- Support Nagios checks, NRPE and StatsD metrics ingester
- Kubernetes native: create metrics and checks for pods
- Monitor your printers and network devices with SNMP
- JMX support to monitor your Java applications.
- Integrated web dashboard
- Support pushing metrics to an external MQTT broker
Glouton automatically detects and generates metrics for your services. Supported services include Apache, Cassandra, Redis, Elasticsearch, Nginx, PostgreSQL, and many others. The full list of services and generated metrics can be found here.
A metrics endpoint is available on port http://localhost:8015/metrics by default (this can be configured here). This endpoint can be scrapped by Prometheus for example to retrieve the metrics and show them in Grafana.
A docker compose file is available to quickly setup a full monitoring stack. It includes Grafana, Glouton and a Prometheus configured to scrap Glouton's metrics endpoint.
# For Linux
(cd examples/prometheus; docker-compose up -d)
# For MacOS
(cd examples/prometheus_mac; docker-compose up -d)
Then go to the Grafana dashboard at http://localhost:3000/d/83ceCuenk/, and log in with the user "admin" and the password "password".
Glouton can periodically push metrics to an external MQTT broker.
A docker compose file is available to show a working monitoring setup with a Glouton pushing points to MQTT. SquirrelDB Ingestor is used to receive the metrics from MQTT and to write them to SquirrelDB, a scalable timeseries database. This setup uses NATS as the broker, any other broker will work but we prefer NATS for its scalability.
(cd examples/mqtt; docker-compose up -d)Then go to the Grafana dashboard at http://localhost:3000/d/83ceCuenk/, and log in with the user "admin" and the password "password". You might have to wait a little before seeing data on the graph.
More details are available on SquirrelDB Ingestor on how to use authenticated MQTT connections and how this setup can be scaled for high availability.
You can use your own ingestor if you want, the messages sent to MQTT are encoded in JSON and
compressed with zlib. Glouton sends its messages to the topic v1/agent/fqdn/data with fqdn
replaced by the host FQDN (. are replaced by , in the FQDN because NATS doesn't support .
in MQTT topics). Here is an example of a MQTT message:
[
   {
      "labels_text": "__name__=cpu_used",
      "time_ms": 1665479613948,
      "value": 46.8,
   }
]Glouton can be installed with Docker, Kubernetes, on Windows or as a native Linux package. If you use Glouton with the Bleemeo solution, you should follow the documentation.
A docker image is provided to install Glouton easily.
docker run -d --name="bleemeo-agent" \
    -v /var/lib/glouton:/var/lib/glouton -v /var/run/docker.sock:/var/run/docker.sock -v /:/hostroot:ro \
    -e  GLOUTON_BLEEMEO_ENABLE='false' --pid=host --net=host \
--cap-add SYS_PTRACE --cap-add SYS_ADMIN bleemeo/bleemeo-agentThe docker compose will run Glouton with jmxtrans (a JMX proxy which queries the JVM over JMX and sends metrics over the graphite protocol to Glouton).
To use jmxtrans, two containers will be run, one with Glouton and one with jmxtrans and a shared volume between them will allow Glouton to write the jmxtrans configuration file.
docker-compose up -dIf you are not a Bleemeo user, disable the Bleemeo connector in /etc/glouton/conf.d/30-install.conf:
bleemeo:
   enable: false
To install Glouton as a native package on Linux, or to install it on Windows or Kubernetes, check out the documentation. Note that this documentation is made for users of the Bleemeo Cloud solution, but it also works without a Bleemeo account if you skip adding the credentials to the config.
The full configuration file with all available options is available here.
See CONTRIBUTING.md.


