This repository contains the R script (tech-radar.R) used to create the technology radar pilot as a SVG file. You can find versions of the technology radar in English, German, French and Italian in the corresponding folders, best by opening the corresponding README.md files.
The master is the table data-English.csv. It can be found in the subdirectory English. Any number of rows may be updated, but the header names must stay the same. Once the table is changed, it can be translated to the other languages by running the corresponding R script.
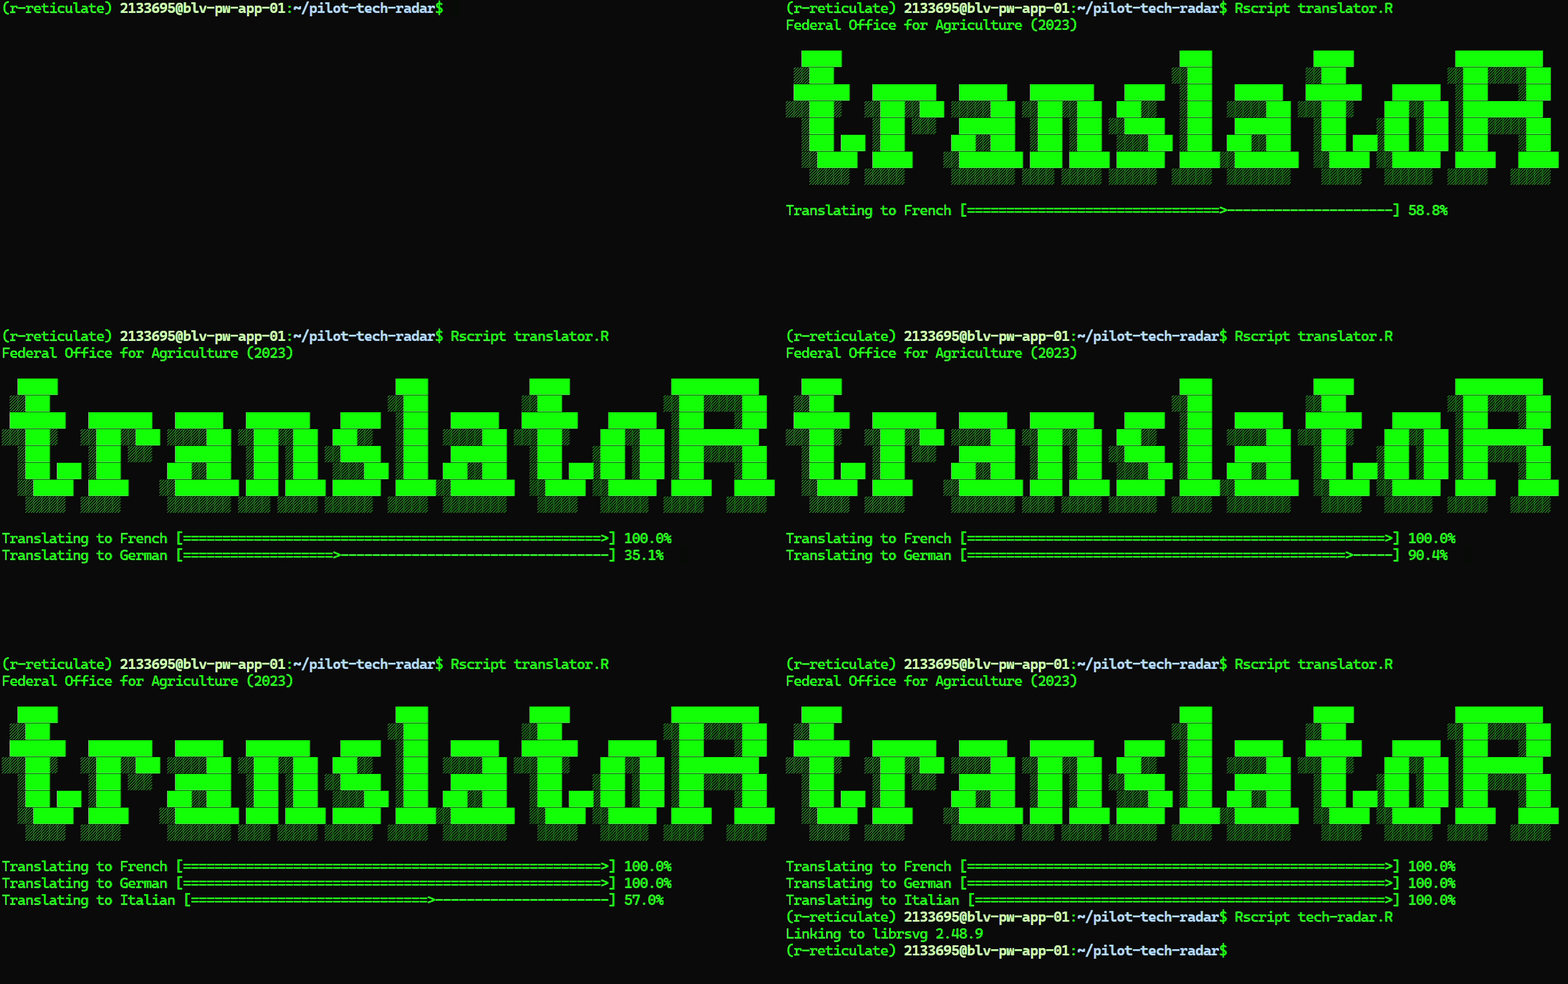
Rscript translator.RThe program runs a tripple for-loop to individually translate the content of cells to the different languages.
Note
In order to run the script translator.R, you need to set up an OpenAI account and create an API access key. You then have to save the key in a file called my-secret-API-key.
Once the data is translated to all desired languages, you may run the main script.
Rscript tech-radar.RThis program will create a visualization of the technology radar content for every language, and a corresponding README.md file containing the legend of the different technologies in the visualization.
The data sets in each sub-directory contain observations with name, description etc. as well as the coordinates of said observation in the plot. Because it's a circular plot, the polar coordinates are provided. They can quickly be converted to cartesian coordinates:
Where
