SingleAnalyst is an integrated platform for single-cell RNA-seq data analysis, focusing on the cell type assignment problem. SingleAnalyst implemented various quality control, normalization and feature selection methods for data preprocessing, and featured a k-nearest neighbors based cell type annotation and assignment methods. It also extended such method to large scale single cell RNA-seq data by introducing several approximate algorithms.
SingleAnalyst consists of three part: data preprocessing, data inspecting and knn based cell type assignment
- Data preprocessing: SingleAnalyst implemented multiple quality control, data normalization and feature selection methods, which are conventionally applied in single-cell RNA-seq analysis.
- Data inspecting: SingleAnalyst employed a couple of useful visualization functions for data investigation, as well as a embedded neighbor density based cluster method.
- kNN based cell type assignment: SingleAnalyst implemented a k-nearest neighbors based cell type annotation methods. Furthermore, for large-scale single cell RNA-seq data analysis several approximate nearest neighbors methods were deployed, providing the ability to deal with data of variety scale.
- python3 >= 3.6
- linux
- Install some dependencies by Anaconda or system's package manager (as pip did not work properly for those packages)
conda install numpy bitarray
conda install faiss-cpu -c pytorch
- Download SingleAnalyst
git clone git@github.com:bm2-lab/Singleanalyst.git
- Install SingleAnalyst
pip install ./Singleanalyst
Read data, and create a singleCellData object.
from SingleAnalyst.basic import indexedList, infoTable, singleCellData

gene_info = indexedList(gene_list)
cell_info = infoTable(
    ['cell_list', 'cell_type'],
    [cell_list, cell_type_list])
ex_m =  np.loadtxt('expression',delimiter="\t", skiprows=1)
dataset = singleCellData(ex_m, gene_info, cell_info)
Or, read from saved data
import SingleAnalyst

datapath = 'example_data'
data_set = SingleAnalyst.dataIO.read_data_mj(datapath)
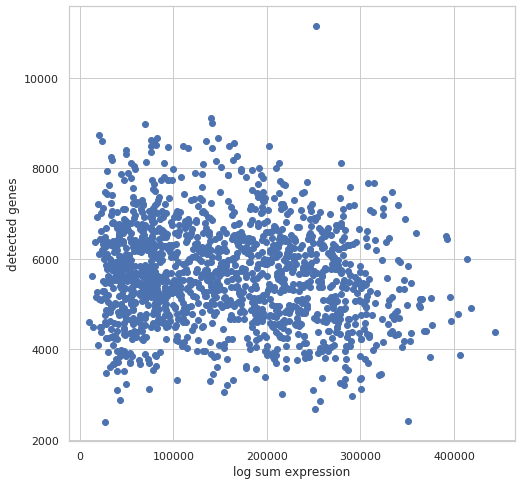
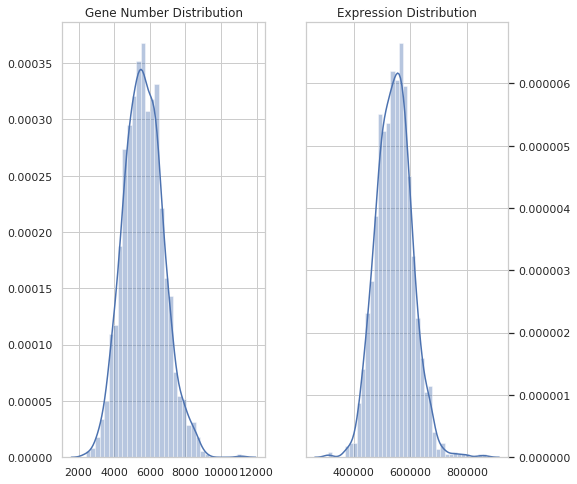
After data was loaded, there are several tools for visually inspected the data
SingleAnalyst.vis.plot_g_e(dataset, log=True)
SingleAnalyst.vis.dist_plot(dataset)Filter out low quality data
f1 = SingleAnalyst.filter.minGeneCellfilter()
f2 = SingleAnalyst.filter.minCellGenefilter()

dataset = dataset.apply_proc(f1)
dataset = dataset.apply_proc(f2)Data normalization
norm = SingleAnalyst.normalization.logNormlization()
dataset.apply_proc(norm)
Select informative features.
s1 = SingleAnalyst.selection.dropOutSelecter(num_features=500)
s2 = SingleAnalyst.selection.highlyVarSelecter(num_features=500)
s3 = SingleAnalyst.selection.randomSelecter(num_features=500)

dataset.apply_proc(s1)
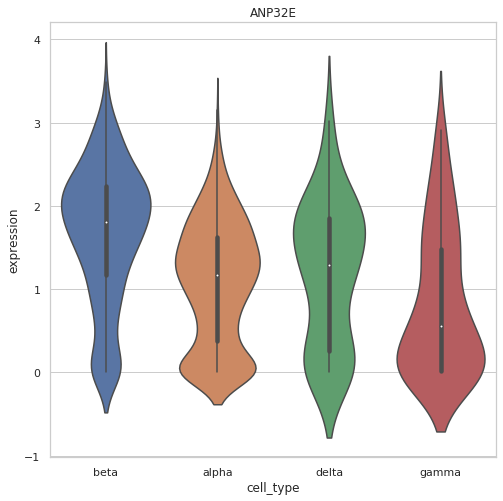
The selected features can be visualized
# random pick one feature
one_f = np.random.choice(np.arange(dataset.gene_num))
gn = dataset.index_to_gene([one_f])
v_plot1 = scr.vis.gene_violinplot(dataset, gn[0])For illustration purpose, we split data for test
train_d, test_d = SingleAnalyst.process.tt_split(dataset)
refdata = SingleAnalyst.RefData.queryData(train_d)
q_xdata = SingleAnalyst.RefData.queryData(test_d)nn_indexer = SingleAnalyst.index.faiss_baseline_nn()
index = SingleAnalyst.index.indexRef(refdata, nn=nn_indexer)qxm = q_xdata.get_qxm(gene_list=index.gene_ref.get_list())
res = index.get_predict(qxm=qxm)
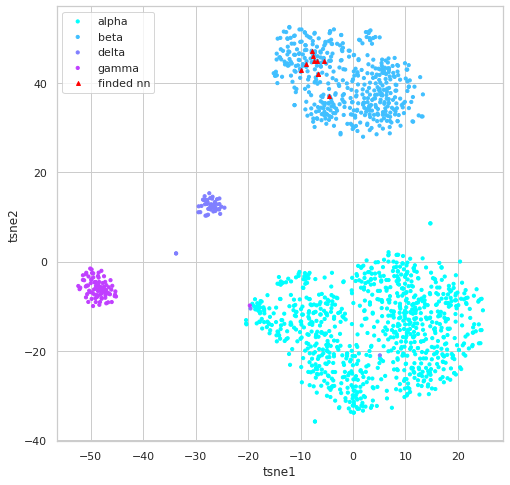
# visually inspect knn result
i_qx = qxm[19,:]
nnf = index.get_knn_vis(i_qx)


