Documentation can be found here
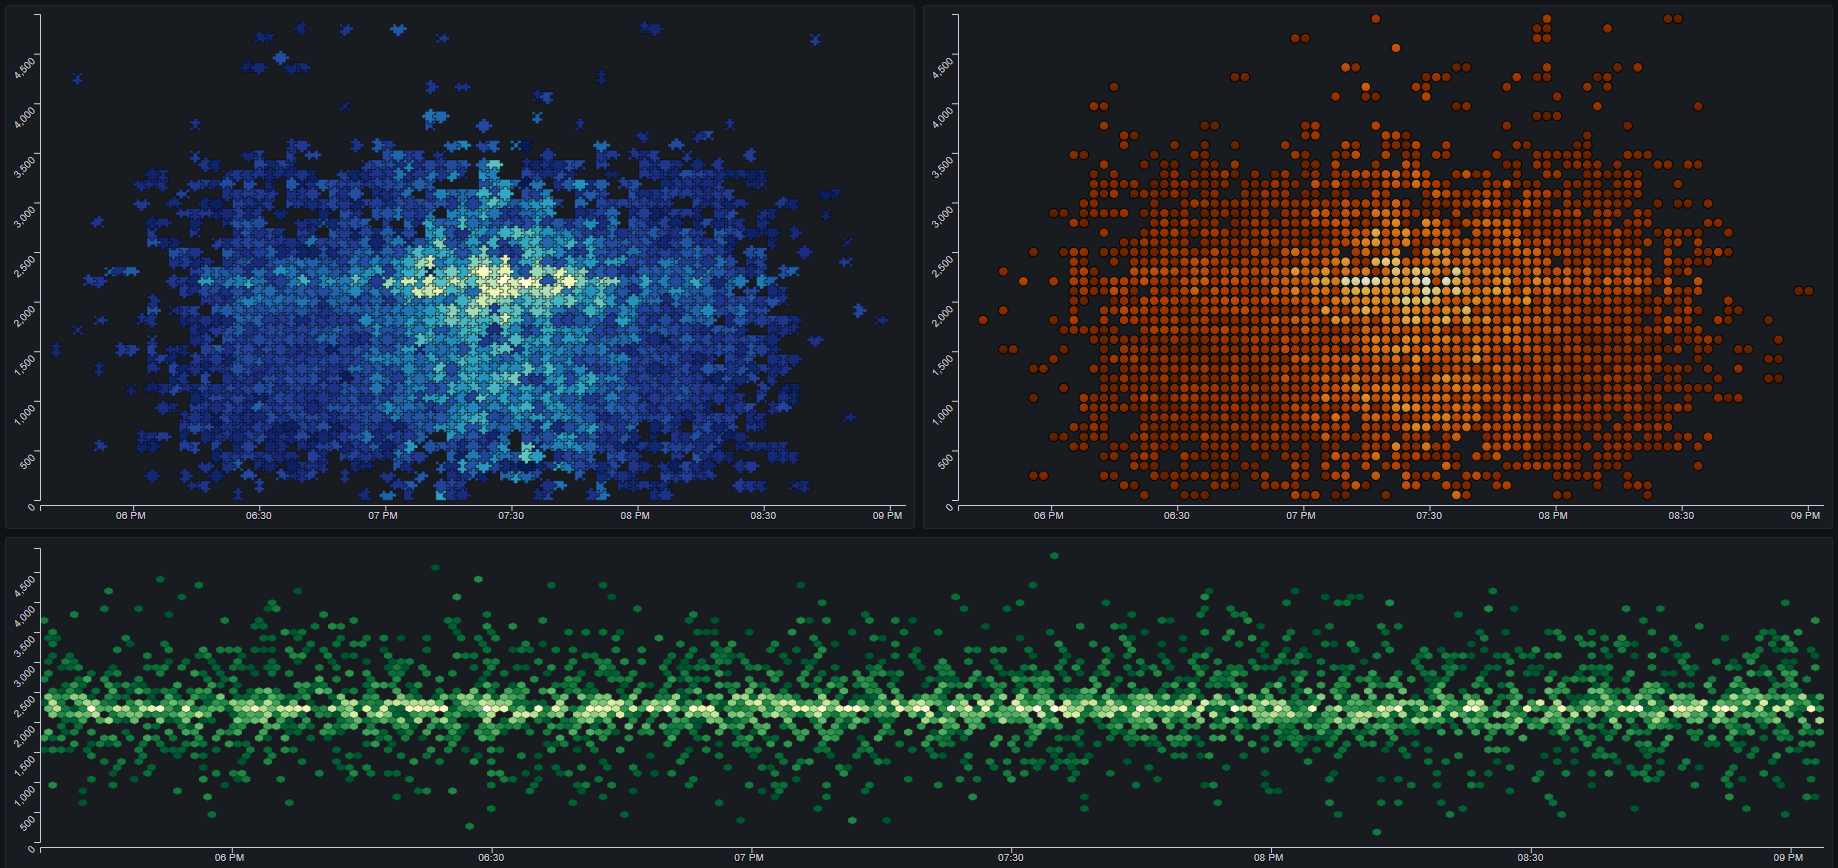
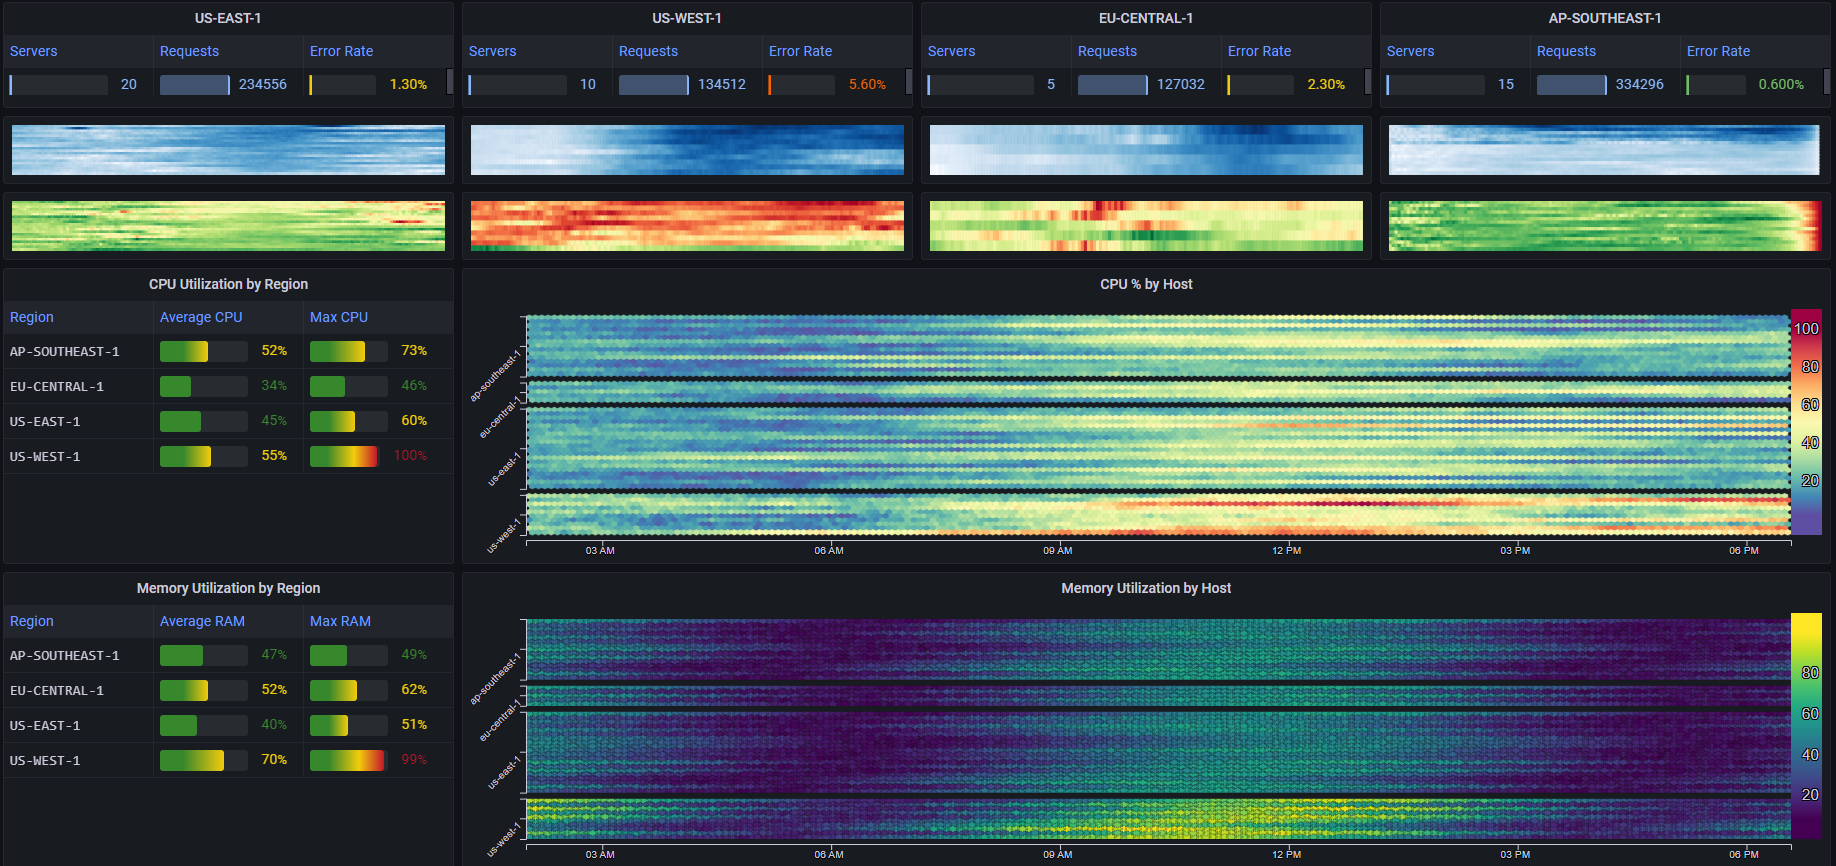
Mosaic Plot is a Grafana panel plugin for visualizing large datasets as heatmaps
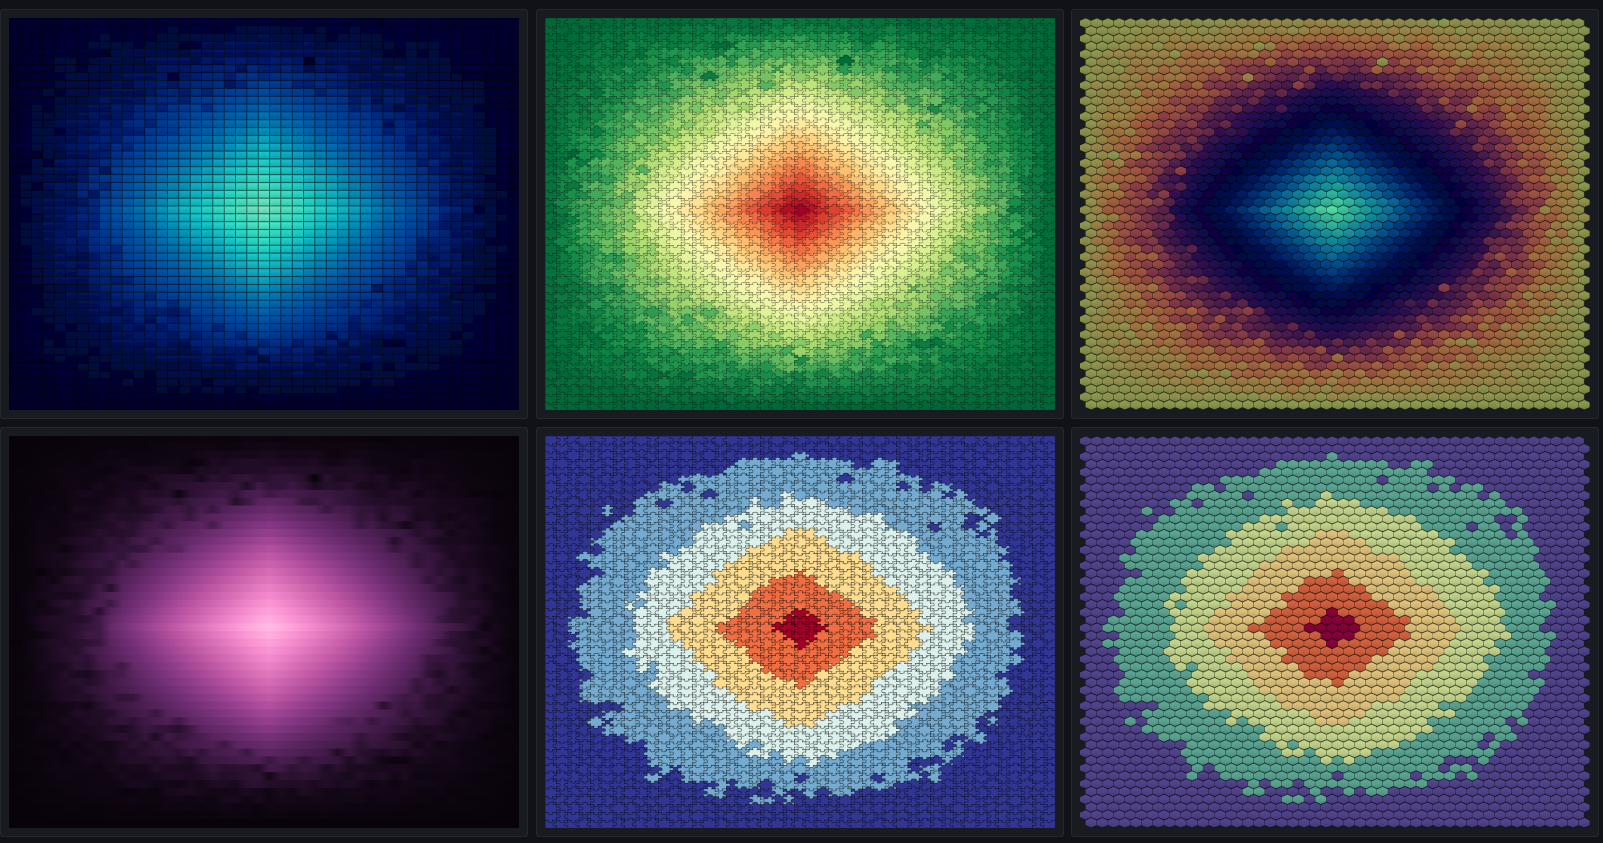
Mosaic Plot differs from existing heatmap panels by providing several additional features as well as by providing many more styling options
Besides visualizing regular heatmaps, Mosaic Plot can be used to plot regular timeseries data with high cardinalities in a very space-efficient manner
Mosaic Plot can be configured to be very compact, allowing a user to show a very large amount of data while taking up only a minimum porition of a dashboard's "real estate"


