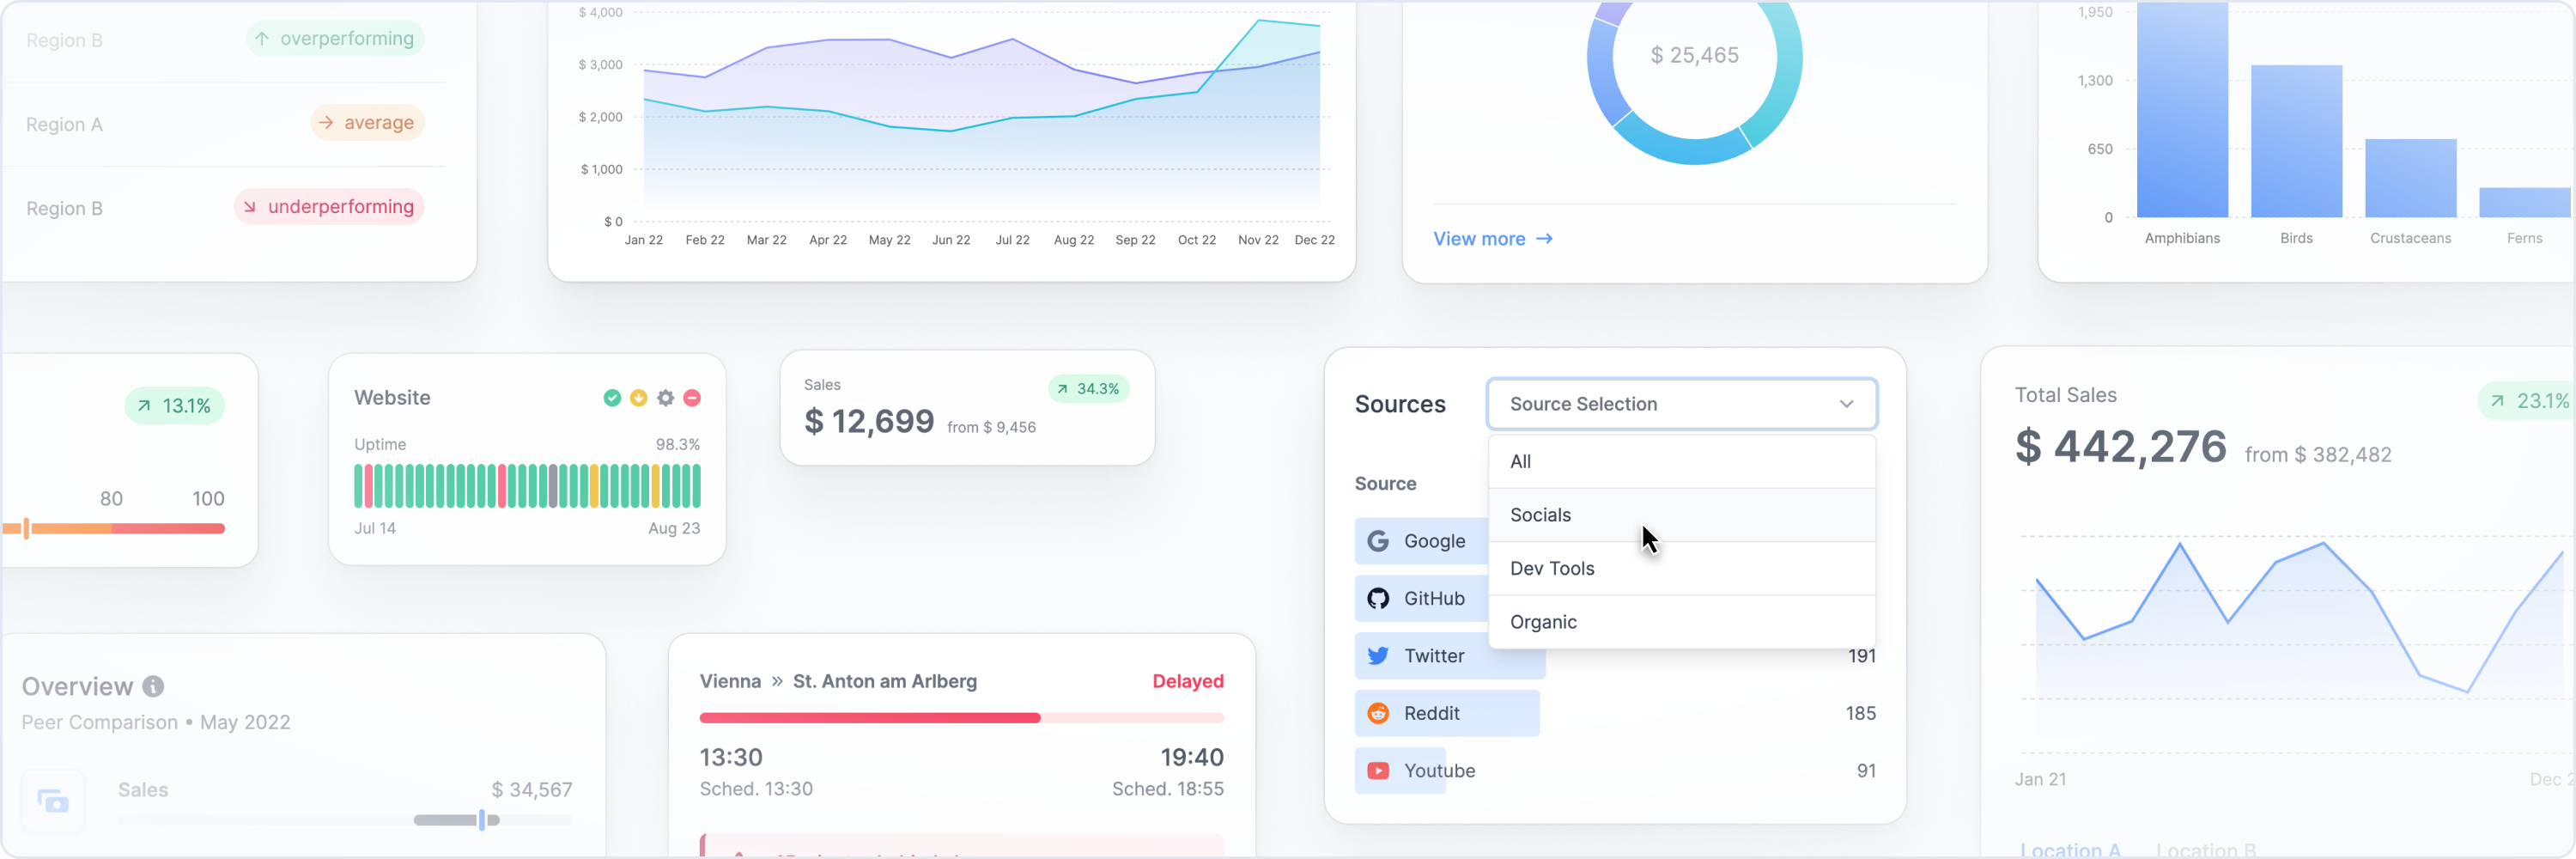
Tremor 20+ open-source components built on top of Tailwind CSS to make visualizing data simple again. Fully open-source, made by data scientists and software engineers with a sweet spot for design.
See our Installation Guide. To make use of the library we also need Tailwind CSS setup in the project.
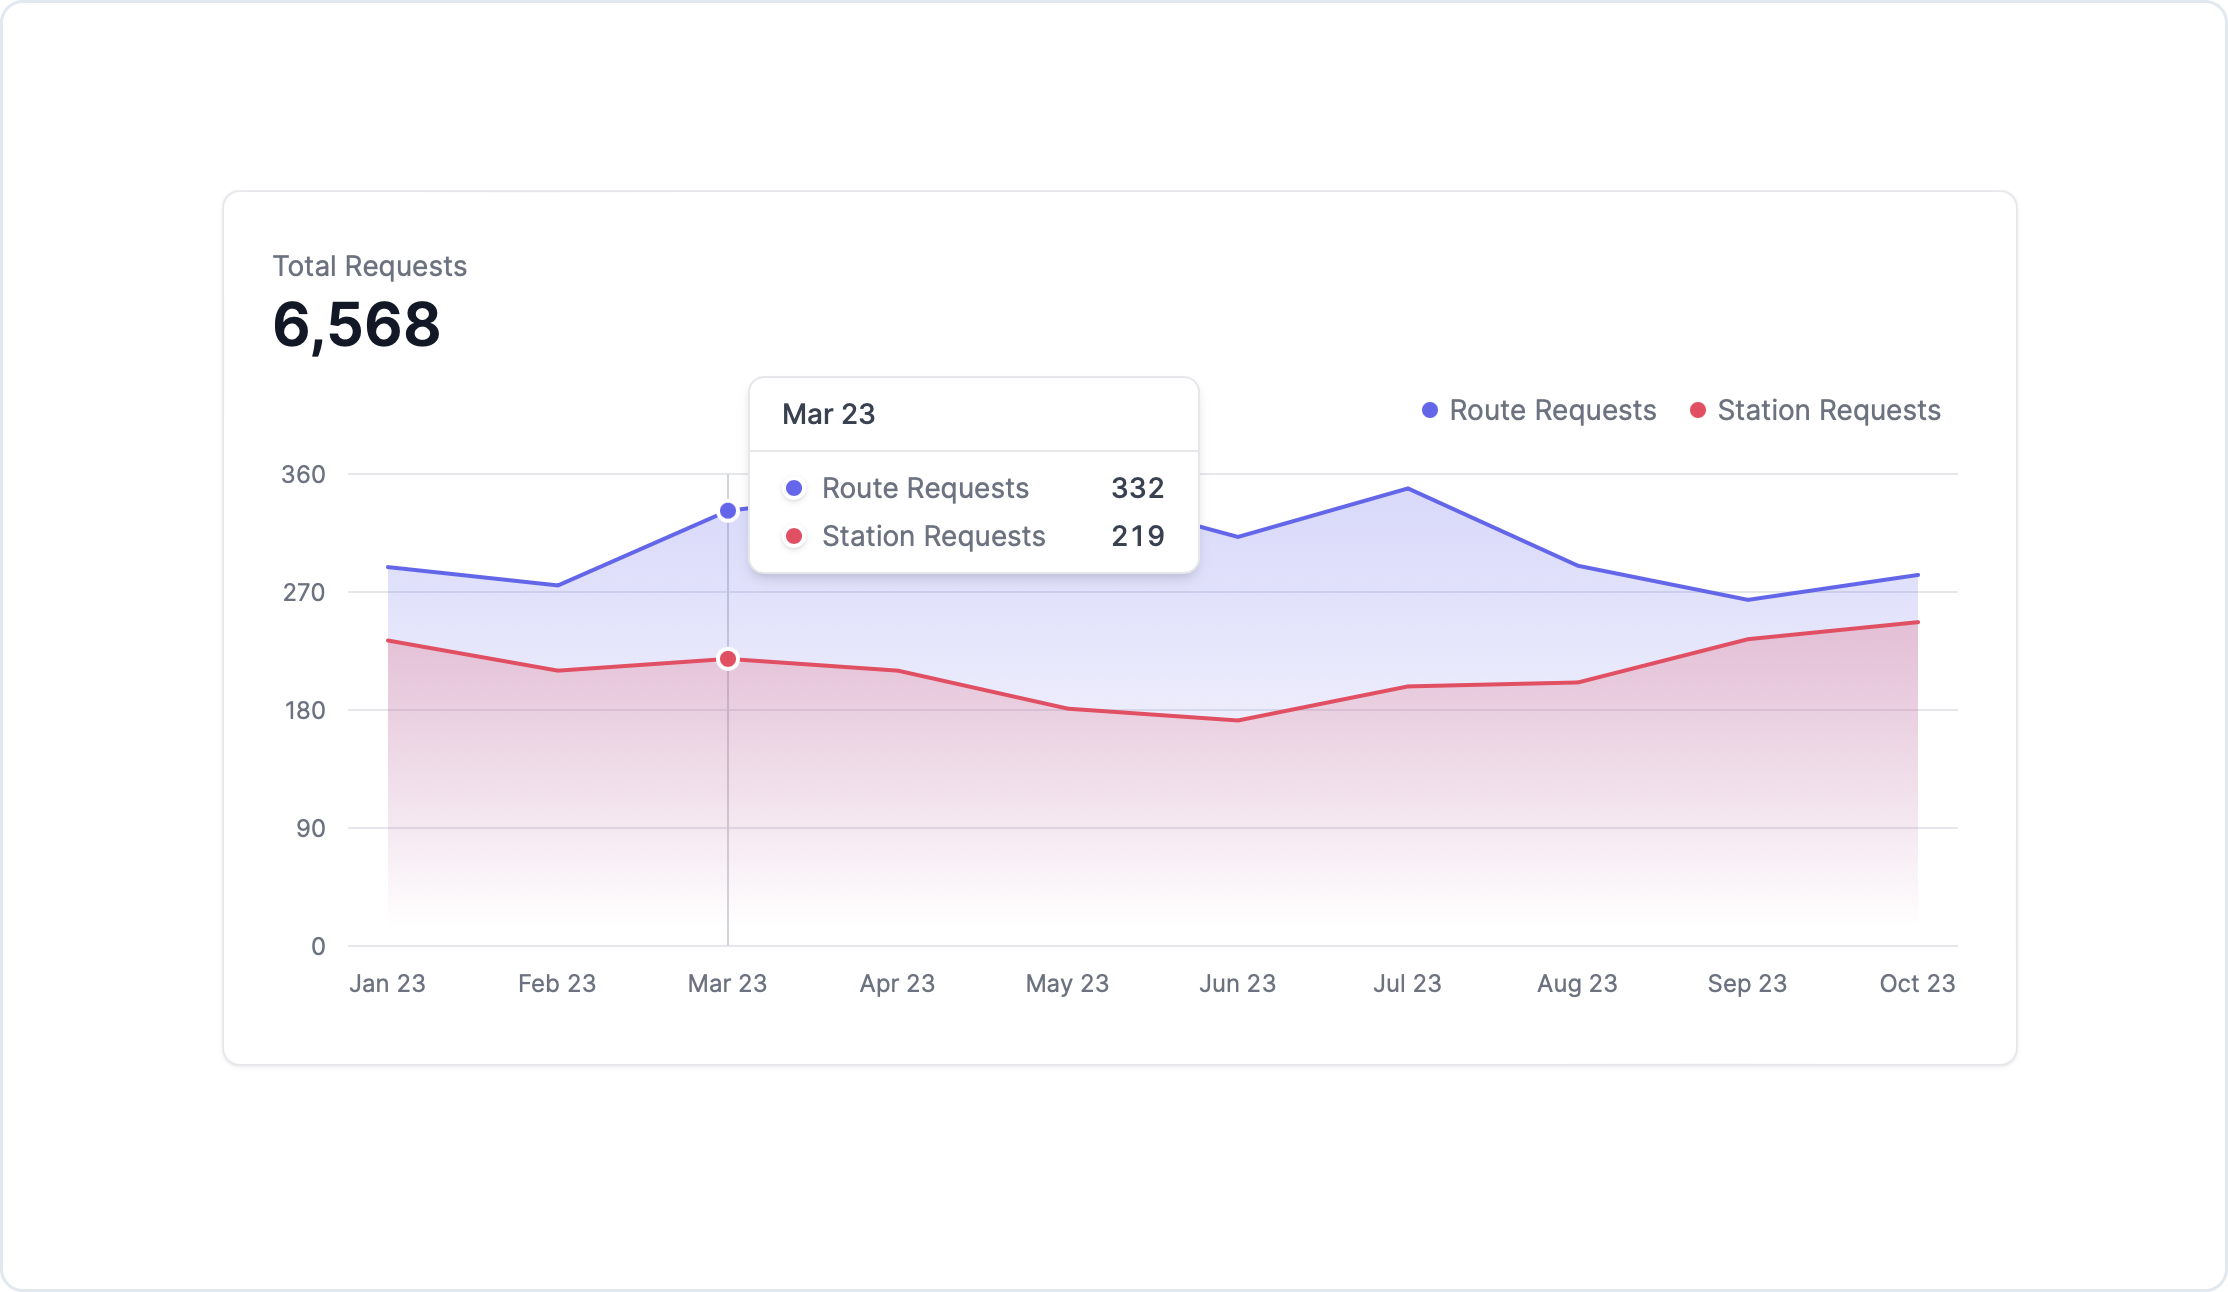
With Tremor creating an analytical interface is easy.
"use client";
import { AreaChart, Card } from "@tremor/react";

const chartdata = [
  {
    date: "Jan 23",
    "Route Requests": 289,
    "Station Requests": 233,
  },
  // ...
  {
    date: "Oct 23",
    "Route Requests": 283,
    "Station Requests": 247,
  },
];

export default function Example() {
  return (
    <Card className="max-w-4xl">
      <span className="text-tremor-default text-tremor-content dark:text-dark-tremor-content">
        Total Requests
      </span>
      <p className="text-tremor-metric font-semibold text-tremor-content-strong dark:text-dark-tremor-content-strong">
        6,568
      </p>
      <AreaChart
        className="mt-2 h-80"
        data={chartdata}
        index="date"
        categories={["Route Requests", "Station Requests"]}
        colors={["indigo", "rose"]}
        yAxisWidth={33}
      />
    </Card>
  );
}
We are always looking for new ideas or other ways to improve Tremor. If you have developed anything cool or found a bug, send us a pull request. Check out our Contributor License Agreement here.
Copyright © 2024 Tremor Labs, Inc. All rights reserved.


