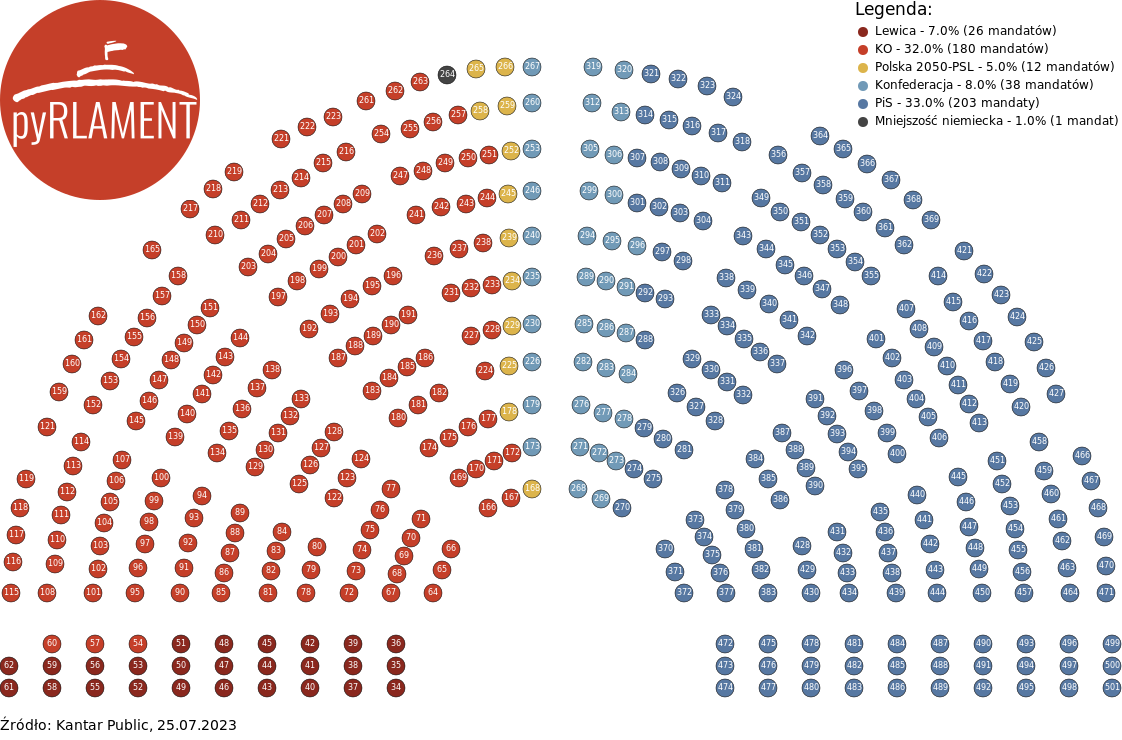
Python library for visualizing seats in the Sejm of the Republic of Poland. So far still in development. Its main goal is to practice the capabilities of Python on various platforms (web/mobile/desktop).
from pyrlament import SeatsCounter
from pyrlament.data import Party

election2019 = {
    Party(name="PiS", support=43.59, threshold=8),
    Party(name="KO", support=27.4, threshold=8),
    Party(name="Lewica", support=12.56),
    Party(name="PSL", label="Polska 2050-PSL", support=10.8, threshold=8, color="DCB44B"),
    Party(name="Konfederacja", support=6.81),
}
election = SeatsCounter(parties=election2019)
election.count()
As a result of the operation of the count method, the parties parameter will contain information about the seats in the parliament, ex.:
for party in election.parties:
    print(f"{party.name}: {party.seats}")
...should print:
PiS: 235,
KO: 134,
Lewica: 49,
PSL: 30
Konfederacja: 11
Mniejszość niemiecka: 1
from pyrlament import SeatsGenerator

g = SeatsGenerator(parties=election.parties)
g.randomize()
with open('pyrlament.svg', 'w') as f:
    f.write(g.svg())
Known bug: for some reason png output is missing logotype.
| Module | statements | missing | excluded | coverage |
|---|---|---|---|---|
| pyrlament/init.py | 4 | 0 | 0 | 100% |
| pyrlament/configs.py | 13 | 0 | 0 | 100% |
| pyrlament/counter.py | 93 | 0 | 0 | 100% |
| pyrlament/data.py | 68 | 0 | 0 | 100% |
| pyrlament/generator.py | 289 | 167 | 0 | 42% |
| Total | 467 | 167 | 0 | 64% |
Here are my plans (some already implemented) for this library:
- count seats basing on election support
- cover code with unit tests
- 5% and 8% support threshold
- check if all support does not reach 100%
- draw svg with seats
- randomise seats colors
- split seats between parties
- improve seats placement (it's a bit messy)
- svg output
- fix png output (I've implemented workaround)
- build webapp using Flask
- build mobile app using Kivy
- build desktop app using Kivy
- cli interface for library


