Welcome to worldwide_demographics analysis repository. In this repository I made my first try on analizing a set of data with Python Pandas library. I tried to have a simple view of a serie of charts to answer two questions.
The same .csv file this repository use with its description can be found at the link bellow:
https://www.kaggle.com/datasets/mathsian/world-demographic-indicators-extract
The two questions and the answers are detailed here bellow.
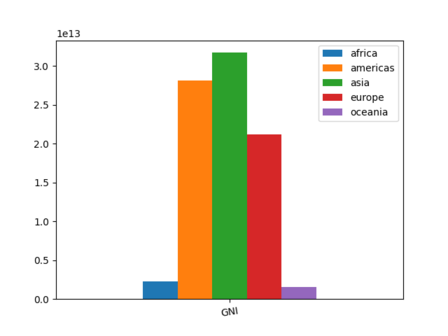
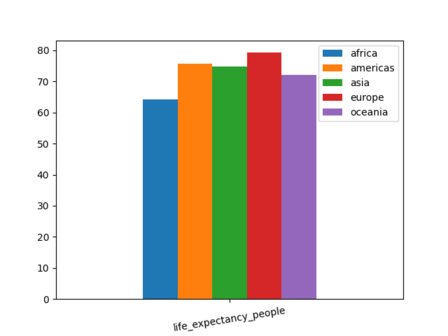
- Does life expectancy increase or decrease according to the GNI?
According to the generated charts bellow GNI is not 100% linked to life expectancy.
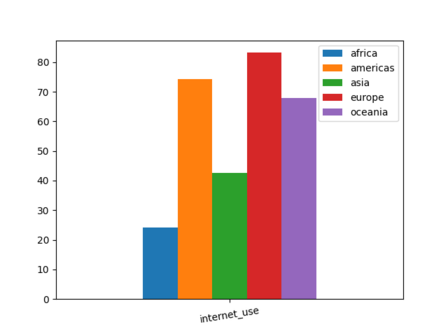
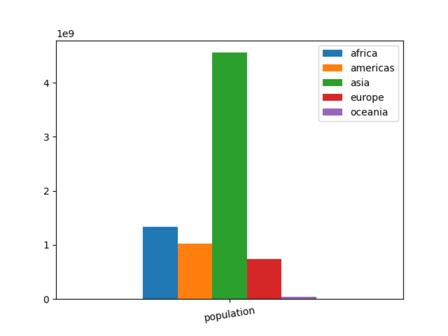
- The total amount population of a continent is proportional to people internet access?
The total amount of population is not related or proportional to the amount population of a continent as shown in the chart bellow.
- Python 3.10
- pandas
- numpy
- matplotlib
{Make a list of websites that you found helpful in this project}
- Create a .pdf file to be downloaded
- Create a console menu to select what chart and how the user wants to generate it
- Fix the rotation labels of the x asis


