The data comes from a Kaggle database. When doing some research I found some interesting ratios you can compare in this vast dataset. The following categories are some interesting ratios shown in charts and a graph made in rust.
In the following SVGs, I divided the descriptions of over 50,000 Steam games given in the dataset into individual words. I then took the words and found the average positive ratio for each game to see what words could drive up the given ratio. The SVGs each with a different minimum appearance in game filer and how it affects the words and shows the top and bottom 5 ratios.
These ratios are the same as the previous but using the already built-in tags fields attached to games metadata.
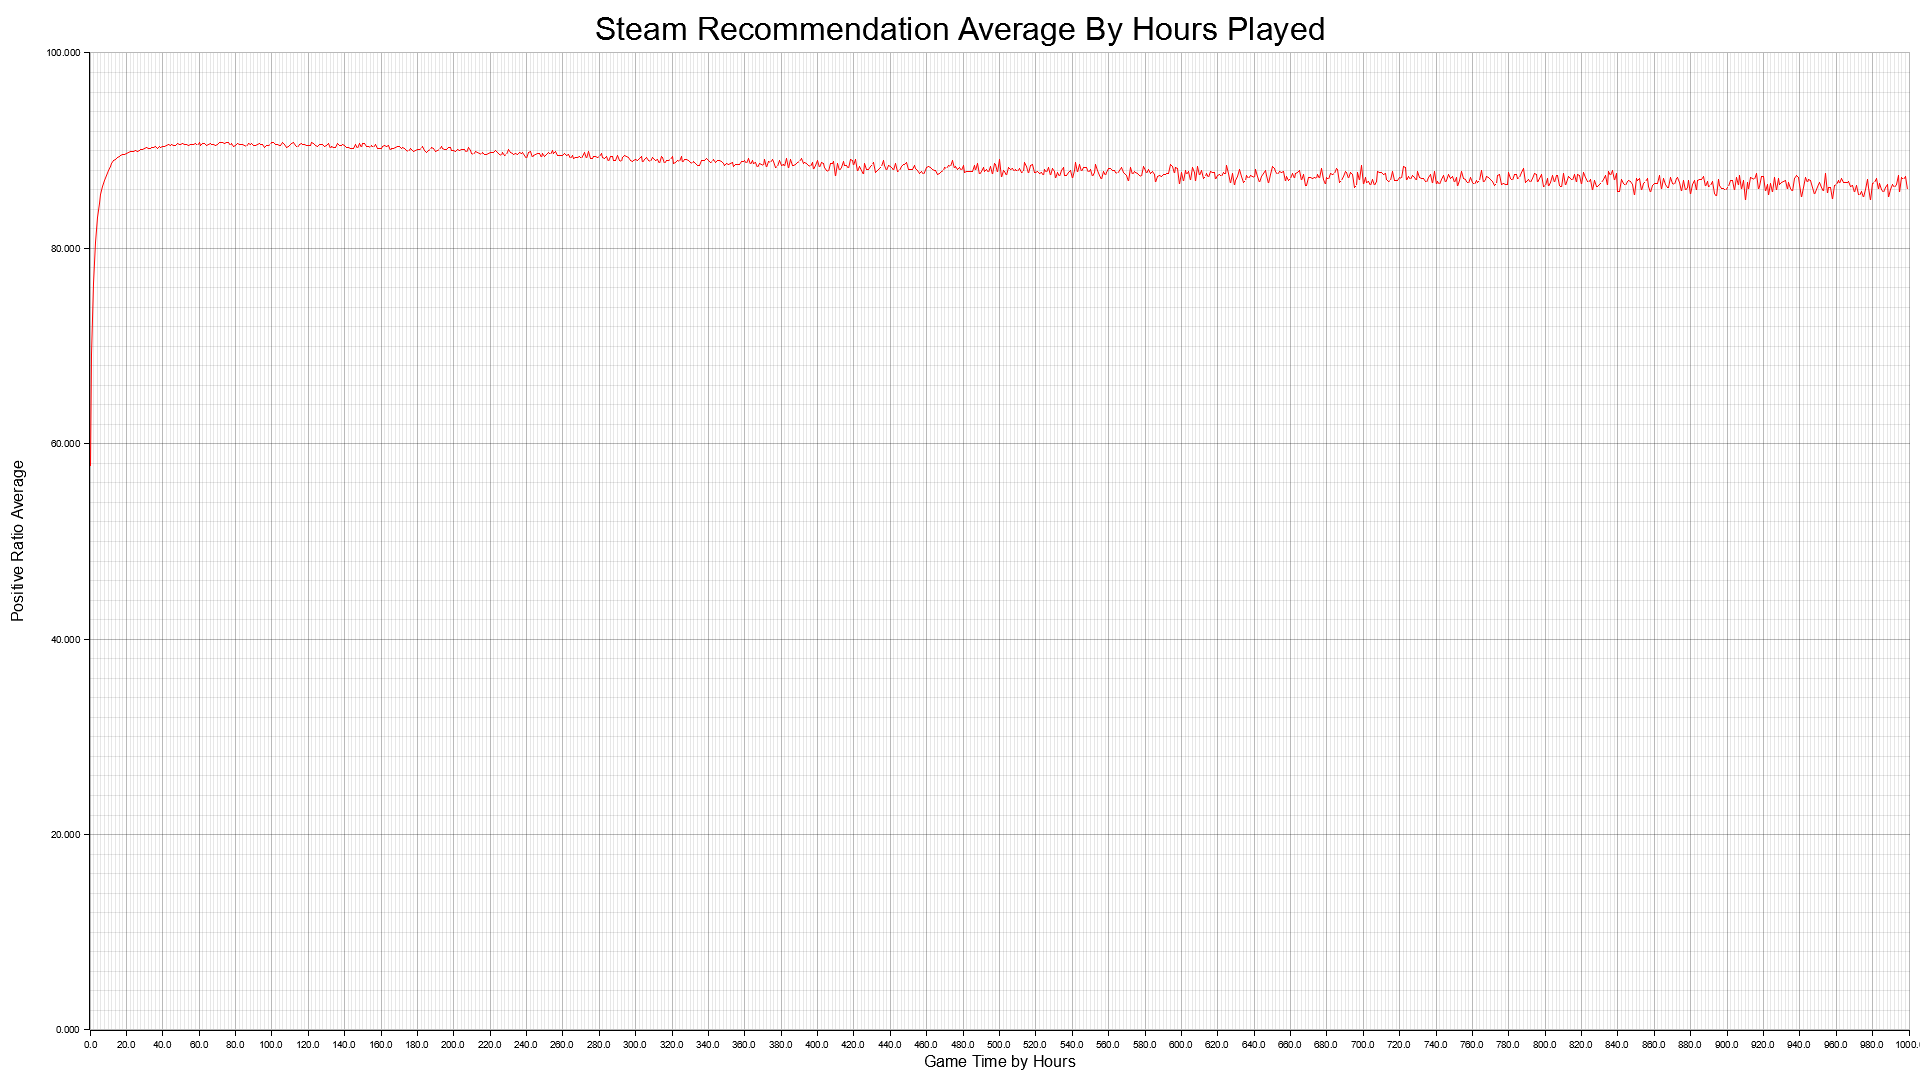
This final ratio I looked into was how the amount of hours played affects the recommended ratio. The following PNG shows the averages for each hour put on a graph by parsing over 30 million reviews 100 times with binary searches.

#conclusion Feel free to take my code and add your twist. I made the functions easily adjustable so you can run some of your hypotheses on the database as well. However, the last update to this database at the time of writing this was a year ago.